Bill Gates’ favourite business book tells us why Tata Nano “really” failed

TATA NANOVivek Kaul

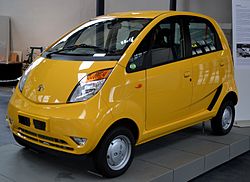
In July this year Bill Gates wrote a blog. He titled it The Best Business Book I’ve Ever Read. As he wrote “Not long after I first met Warren Buffett back in 1991, I asked him to recommend his favorite book about business. He didn’t miss a beat: “It’s Business Adventures, by John Brooks,” he said. “I’ll send you my copy.” I was intrigued: I had never heard of Business Adventures or John Brooks.” Gates got a copy of the book from Buffett. “Today, more than two decades after Warren lent it to me—and more than four decades after it was first published—Business Adventures remains the best business book I’ve ever read. John Brooks is still my favorite business writer. (And Warren, if you’re reading this, I still have your copy),” Gates added. The book is essentially a collection of 12 long articles (I don’t know what else to call them) that Brooks wrote for the New Yorker magazine, where he used to work. A chapter that should be of interest to Indian readers is The Fate of Edsel. A reading of this chapter clearly tells us why Tata Nano, the most hyped Indian car ever, has failed to live up to its hype. But before we get to that, here is a brief summary of the chapter. In 1955, the Ford Motor Company decided to produce a new car, which would be priced in the medium range of $2,400 to $4,000. The car was designed more or less as was the fashion of the day. It was long, wide, lavishly decorated with chrome, had a lot of gadgets and was equipped with engines which could really rustle up some serious power. The car was called the Edsel. It was named after Edsel Ford, the only son of Henry Ford who started the Ford Motor Company. In 1943, Edsel Ford had died at a young age of 49, of stomach cancer. In fact, even before the Edsel car was launched there was a lot of hype around it. As Brooks writes “In September 1957, the Ford Company put its new car, the Edsel, on the market, to the accompaniment of more fanfare than had attended the arrival of any other new car since the same company’s Model A. A model brought out thirty years earlier.” The company had already spent $250 million on the car, before it was launched. The Business Week called it more costly than any other consumer product in history. Given this huge cost, Ford had to sell around 200,000 Edsels in the first year, if it had to get its investment back. Nevertheless, two years, two months and fifteen days later, it had only sold 109,446 Edsels. This included cars bought by Ford executives, dealers, salesman, workers etc. The number amounted to less than 1% of the cars sold in America during that period. On November 19, 1959, it pulled the plug on the car. Estimates suggested that Ford lost around $350 million on the car. So what went wrong? Some of the feedback from trade publications was negative. Over and above that, some of the cars that were sent out initially were badly made. As Brooks writes “Automotive News reported that in general the earliest Edsels suffered from poor paint, inferior sheet metal, and faulty accessories, and quoted the lament of a dealer about one of the first Edsel convertibles he received: “The top was badly set, doors cockeyed, springs sagged.”” Some individuals who worked on making and launching the car liked to believe in later that it was the because of the Sputnik, the first artificial space satellite launched by the Soviets that led to the car not selling. As Brooks puts it “October 4th[1957], the day the first Soviet Sputnik went into orbit, shattering the myth of American technical pre-eminence and precipitating a public revulsion against Detroit’s fancier baubles.” Detroit was the city were the biggest motor companies in the United States were head-quartered back then. While these could have been reasons for the car not selling, the real reason for the car not selling was the hype that accompanied it. As Brooks writes “It was agreed that the safest way to tread the tightrope between overplaying and underplaying the Edsel would be to say nothing about the car as a whole but to reveal its individual charms a little at a time—a sort of automotive strip tease…The Ford Company had built up an overwhelming head of public interest in the Edsel, causing its arrival to be anticipated and the car itself to be gawked at with more eagerness than had ever greeted any automobile before it.” C Gayle Warnock, director of public relations of the Edsel division of Ford, shares an interesting example, which provides the real reason behind the failure of the Edsel car. In 1956, a senior official working on the Edsel launch (in fact it wasn’t called the Edsel then, it was just the E-Car) gave a talk about it in Portland, Oregon. Warnock was aiming for some coverage regarding the event in the local press. But what he got was something he had not expected. The story got picked up by wire services and was splashed all across the country. As Warnock recounts in the chapter “Clippings [of the media coverage] came in by the bushel. Right then I realized the trouble we might be headed for. The public was getting to be hysterical to see our car, figuring it was going to be some kind of dream car—like nothing they’d ever seen. I said… “When they find out it’s got four wheels and one engine, just like the next car, they’re liable to be disappointed.”” And this is precisely the reason why the Edsel flopped. The hype was so much that the public expected something that was totally out of the world. But what Ford was basically giving them in the rephrased words of Larry Doyle, the head of sales at the Edsel division, “exactly the car that they had been buying for several years.” As Doyle put it “We gave it to them and they couldn’t take it.” Further, it did not help that the first lot of cars was not properly manufactured. “Within a few weeks after the Edsel was introduced, its pitfalls were the talk of the land,” writes Brooks. Now replace the word Edsel with Nano and the situation stays more or less the same. The hype around the car was huge. When the car was launched in 2009, the entire world media was in Delhi for the launch. In fact, before the car was launched the rating agency Crisil said that the car could expand the Indian car market by 65%. People who had cars were already worried about the traffic on the roads getting worse than it already was, because of the Nano. Before the car was launched in 2009, prices in the used car market fell by 25-30%, given Nano’s expected price point of Rs 1 lakh. Nonetheless, Nano could not live up to the hype. In a May 2014 newsreport, the Business Standard pointed out that Launched in 2009,Nano sales between 2010-11 and 2012-13 constituted 23-24 per cent of Tata Motors’ total sales. But Nano sales declined dramatically after peaking to 74,527 in 2011-12. The numbers came down by more than 70 per cent in two years to 21,129 in 2013-14. Tata Motors has set up a facility at Sanand in Gujarat to make 250,000 Nanos a year.” So, the car sold nowhere near the numbers it was expected to. What did not help was that when the car actually started hitting the market in 2010, some units caught fire. After all the hoopla around the Nano, this wasn’t what the public was ready to accept. Brooks’ sentence written for Edsel can be re-written for Nano as well: “After the Nano was introduced, its pitfalls were the talk of the land.” Further, the hype around the car was so huge that the people were expecting something totally out of this world. They did not know what they wanted, but they did not want, what they got. The question that remains is how much could you expect out of a car which was supposed to be sold at Rs 1 lakh? The article originally appeared on www.FirstBiz.com on Nov 18, 2014

(Vivek Kaul is the author of the Easy Money trilogy. He tweets @kaul_vivek)

Nifty 10,000: Coming soon at a stock market near you

bullfightingVivek Kaul

It is that time of the year when the stock market analysts get busy predicting what levels do they see Sensex/Nifty reaching during the course of the next financial year.
First off the blocks this year are Gautam Chhaochharia and Sanjena Dadawala of UBS Global Research, who have predicted that the NSE Nifty will touch 9,600 points by the end of 2015. As I write this, the Nifty is trading at around 8375 points. Hence, the UBS analysts are basically talking about the Nifty index, rallying by around 15% over the course of the next thirteen and a half months by end 2015.
The prediction of 9,600 points has been arrived at by making certain assumptions, including the expectation of earnings of companies growing by 15% during the course of the next financial year (i.e. the period between April 1, 2015 and March 31, 2016).
Over the next few weeks you will see a spate of analysts of making such predictions. And it won’t be surprising if someone comes up with a Nifty target of 10,000 points or more. For one, saying that Nifty will touch 10,000 points is inherently more sexier than saying Nifty will touch 9,600 points. A big round number always sounds so much better.
Further, Nifty at 10,000 points will be around 19.4% higher than the current level of 8375 points. It has rallied by 32.6% during the course of this year (from January 2014 to November 13, 2014). Hence, a rally of 19.4%, assuming that Nifty will touch 10,000 by end 2015, sounds pretty reasonable.
Nevertheless, the question is how do these analysts know? John Kenneth Galbraith explains this in his book 
The Economics of Innocent Fraud. As he writes “The fraud begins with a controlling fact, inescapably evident but universally ignored. It is that the future of economic performance of the economy, the passage from good times to recession or depression and back, cannot be foretold. There are more ample predictions but no firm knowledge.”
And why is that ?“There is the variable effect of exports, imports, capital movements and corporate, public and government reaction thereto. Thus the all-too-evident-fact: The combined result of the unknown cannot be known,” writes Galbraith.
Nevertheless, these predictions serve a useful purpose. They tell people what they want to hear, especially during a bull market, when share prices are going up and people are inherently optimistic about things. As Galbraith puts it “The men and women so engaged[i.e. the ones making the predictions] believe and are believed by others to have knowledge of the unknown; research is thought to create such knowledge. Because what is predicted is what others wish to hear and what they wish to profit or have some return from, hope or need covers reality.”
The stock market rally this year has been more about “easy money” from abroad coming into India, rather than any fundamental improvement in economic activity. Since the beginning of the year (and upto November 13,2014) foreign institutional investors have made a net investment of Rs 67,359.4 crore into the Indian stock market.
This has largely been on account of Western central banks maintaining low interest rates. Hence, foreign investors have been able to borrow money at low interest rates and invest it in the Indian stock market. The inflows have been particularly strong since May, when Narendra Modi came to power. Since May 2014, Rs 35,545.7 crore has been the net investment made by FIIs in India.
The basic point is that in an environment where easy money is essentially driving up stock prices, predictions are more about understanding investor psychology than the underlying fundamentals of the market.
An excellent analogy here is that of Henry Blodget, who used to work as a senior analyst with
the Wall Street firm CIBC Oppenheimer, in the late 1990s. In October 1998, Blodget brought out a report on Amazon.com. In this report he had predicted that the stock would go past $150 in a year’s time. He had also added in that report that the stock was worth anywhere between $150 and $500. At that point of time, the stock was quoting at $80. The stock raced past Blodget’s one-year target within a few weeks, so huge was the flow of money into the stock market.
His sales team then began to pester him for a new target. By December 1998, the price of the Amazon stock had crossed $200. As Maggie Mahar recounts in Bull!—A History of the Boom and Bust, 1982–2004 “Privately, he[Blodget] was confident that Amazon would hit $400—he just didn’t know if he had the balls to say it. But as his very first boss on Wall Street had told him, “You’re not a portfolio manager—you‘re not trying to sneak quietly into a stock before someone else sees it. You’re an analyst: your job is to go out and take a position.”
And that is what Blodget did. He took the position that Amazon would hit $400 within a year’s time. There must have been hundreds of other analysts on Wall Street who could have said the same thing. It was just that Blodget had the balls to say the right thing at the right time. He told the stock market what it wanted to hear.
Blodget put out his recommendation of Amazon hitting $400 on December 16, 1998. Within minutes, his forecast was traveling around the world. A Bloomberg reporter got a tip and put out the story. Soon, CNBC picked it up. And in no time, the recommendation had hit the chat boards across the various internet sites. And once that happened, the stock simply went through the roof. Amazon, which had closed at a price of $242.75 on December 15, 1998, closed 19 percent higher at $289 on December 16, 1998.
After this, the price of Amazon went on a roll. The stock was split in early January 1999, and the price crossed the $400 level that Blodget had predicted in March 1999, in split adjusted terms. Blodget got the investor psychology right. At some level, Blodget understood that he was in the midst of a stock market driven more by emotion and momentum. Hence, more than the price of the stock, he had to predict investor psychology and where that could take the price.
The Indian stock market is going through a similar era of easy money right now, though of a lower degree in comparison to the dot-com bubble that was on in the United States in the late 1990s. Hence, making predictions is going to about predicting investor psychology than the underlying fundamentals.
Given this, it won’t be surprising to see forecasts predicting that Nifty will cross 10,000 points next year, coming out over the next few years. Of course all these forecasts will indulge in what American writer Steven Pinker calls “compulsive hedging”. As he writes in his new book
The Sense of Style “Many writers cushion their prose with wads of fluff that imply that they are not willing to stand behind what they are saying.”
The UBS analysts do just that. After predicting that Nifty will touch 9600 points by end 2015. They go on to write “If our expectations of the earnings growth recovery are not met (with only 10-12%
growth in corporate earnings)…the Nifty could decline to the 7,500 levels.”
So much for being in the business of making predictions.

The article originally appeared on www.FirstBiz.com on Nov 15, 2014

(Vivek Kaul is the author of the Easy Money trilogy. He can be reached at [email protected])

Eight things you need to know about falling oil prices

oil

Vivek Kaul

The price of oil has been falling for a while now. As I write this the brent crude oil is selling at around $80.4 per barrel. There are several reasons behind the fall and several repercussions from it as well. Let’s look at them one by one.

1) The Chinese demand for oil has not been growing at the same rate as it was in the past, as Chinese economic growth has been falling. As Ruchir Sharma, head of Emerging Markets and Global Macro at Morgan Stanley Investment Management wrote in a recent column in The Wall Street Journal “The growth rate in Chinese demand for oil has plummeted to nearly zero this year, down from 12% in 2010. This is arguably the main reason why oil prices are down.”
2) In the past when oil prices fell, the Organization of Petroleum Exporting Countries (OPEC) led by Saudi Arabia used to cut production to ensure that supply fell and that ensured that prices did not continue to fall. This hasn’t happened this time around. As the Saudi oil minister Ali Naimi told Reuters on November 12, “Saudi oil policy has been constant for the last few decades and it has not changed today.” He added that: “We do not seek to politicise oil…for us, it’s a question of supply and demand, it’s purely business.”
And what is this pure business Al Naimi is talking about? The United States and other western nations like Canada have had a boom in shale oil production. This boom has led to the United States and Canada producing much more oil than they were a few years back. Data from the U.S. Energy Information Administration shows that United States in 2013 produced 12.35 million barrels per day. This is a massive increase of 35% since 2009. In case of Canada the production has gone up by 22.8% to 4.07 million barrels per day between 2009 to 2013.
Shale oil is very expensive to produce and depending on which estimate one believes it is viable only if oil prices range between $50 and $75 per barrel. Hence, by ensuring low oil prices the Saudis want to squeeze out the shale oil producing companies in Canada and United States.
3) So is the Saudi policy working? The US Energy Information Administration in its latest Drilling Productivity Report said that the seven largest shale oil companies will produce 125,000 barrels more per day in December 2014 in comparison to November 2014.
Hence, the Saudi strategy of driving down oil prices to ensure that the production of oil by shale oil companies is no longer viable, hasn’t seemed to have had an impact yet. Nevertheless that doesn’t mean that a fall in oil prices will have no impact on shale oil production.
The
International Energy Agency (IEA) has said that the investment in shale oil fields will fall by 10% next year, if oil prices continue to remain at $80 per barrel. Faith Bristol, chief economist of IEA recently said “there could be a 10 per cent decline in US light tight oil, or shale, investment in 2015 [from full-year 2014 levels]”…I wouldn’t be surprised to see statements from different companies in the weeks and months to come [outlining a change in] their investment plans and reducing budgets for investments in North America . . . especially the United States.” And this will have an impact on the production of shale oil in the medium term, if Saudis continue to sustain low oil prices.
4) Nonetheless, the interesting thing that the United States and other Western nations may never have to increase production of shale oil, just the threat of doing that will act as an insurance policy. As Niels C. Jensen writes in the Absolute Return Letter for November 2014 “There is nothing easier to get used to in this world than higher living standards, and the populations of most oil producing nations have seen plenty of that in recent years. Shale [oil] is a threat against those living standards, and falling oil prices are the best assurance they can hope for that shale [oil] will never become the major production factor that we are all being told that it could become. It is very expensive to produce and thus requires high oil and gas prices to be economical.”
But even with that shale oil can act as an insurance policy against high oil prices, feels Jensen. As he writes “In a rather bizarre way, shale [oil] has thus become an insurance policy, as the western world never have to ramp up shale production to levels that have been discussed. The sheer threat of doing so should keep the oil price at acceptable levels.”
5) Also, low oil prices are going to benefit nations which import oil. “A $20-per-barrel drop in oil prices transfers $6-700 billion from oil producing nations to consumers worldwide or nearly 1% of world GDP. Assuming consumers will spend about half of that on consumption, which historically has been a fair assumption, the positive effect on GDP in consumer countries is 0.5%,” writes Hunt. And this is clearly good news for oil importing nations like India. Falling oil prices are also benefiting airlines and shipping companies given that oil is their single biggest expense.
6) News reports suggest that China is using this opportunity to buy a lot of oil. As a recent report on Bloomberg points out “The number of supertankers sailing toward China’s ports matched a record on Oct. 17 and is still close to that level now.”
7) The countries that are likely to get into trouble if oil prices continue to remain low are primarily Russia and Iran. Russia relies heavily on exports of oil and gas. As a recent article on cnbc.com points out “In 2013, for example, Russia’s energy exports constituted more than two-thirds of total exports amounting to $372 billion of a total $526 billion.” Further, the Russian government’s budget gets balanced (i.e. its income is equal to its expenditure) at an oil price of anywhere between $100-110 per barrel. Iran’s case is similar. Hence, both these countries need higher oil prices.
As a recent Oped in the Los Angeles Times points out “Russia and Iran compete with Saudi Arabia in the international oil market, and both need oil prices to be at roughly $110 a barrel in order to balance their budgets. If oil prices remain at $80 a barrel, the strategic ambitions of Tehran and Moscow could be severely undermined.”
8) Saudi Arabia also gets hit by a lower oil prices. “Saudi produces close to 10m barrels per day, similar to Russian output. A $20 fall in the oil price, costs Saudi Arabia about $200m per day,” a recent article in The Independent points out.
But Saudi Arabia has more staying power than the others. The fact that
Aramco (officially known as Saudi Arabian Oil Company) has deep pockets is a point worth remembering. As Vijay Bhambwani, CEO of BSPLIndia.com recently told me “Saudis can produce low cost arab light sweet crude very cost efficiently and only the recent state welfare schemes implemented after the arab spring, have raised the marginal costs. Even a slight rollback / delayed released of the additional welfare payments (US $ 36 billion) can add sizeable cash flow into the Saudi national balance sheet and give it additional staying power.”
To conclude, there are many different dimensions to falling oil prices and the way each one of them evolves, will have some impact on oil prices in the days to come .

The article originally appeared on www.FirstBiz.com on Nov 13, 2014

(Vivek Kaul is the author of the Easy Money trilogy. He tweets @kaul_vivek)

Inflation dips, but here’s why Indians don’t believe it will stay low


deflationHere is the good news—the inflation as measured by the consumer price index for the month of October 2014 came in at 5.52%. It was at 6.46 % in September 2014 and 10.17% in October 2013. The price of food products which make up 42.71% of the consumer price index rose by 5.59% in October 2014, in comparison to the same period during the previous year.
A major reason for the fall in inflation has been a global fall in food prices.
The Food and Agriculture Organization’s Food Price Index averaged at 192.3 points in October 2014. It was lower by around 0.2% in comparison to the September number. In comparison to a year earlier, food prices fell by 6.9%. Global food prices have now fallen for seven months in a row, and this has been the longest slide since 2009.
While food prices on the whole haven’t been falling in India, vegetable prices fell by 1.45% during October 2014 in comparison to October 2013. Interestingly, they had risen by 45.7% in October 2013 in comparison to October 2012. Cereal prices during the month went up by 6% in comparison to 12% a year earlier. Also, only two food products showed an increase in price of greater than 10%. The price of milk went up by 10.8% and the price of fruits went up by 17.5%.
Nevertheless, food prices might start rising again. The government has forecast that the output of
kharif crops will be much lower than last year and this might start pushing food prices upwards all over again. As the Business Standard reports “As per very preliminary estimates, India’s food grain production in 2014-15 kharif crop season is expected to be around 120 million tonnes, nearly 9.5 million tonnes less than last year, but officials have said that there could be a further downward revision in the estimates as arrivals gather steam from middle of November onwards.”
And this could push up prices in the days to come. As As Rupa Rege Nitsure, Chief Economist,
Bank Of Baroda told Reuters “recent data shows that towards the end of October we have seen spikes in vegetable prices as well as in cereal prices because of delayed monsoon. So there’s a big question of sustainability of these readings.”
Falling food inflation has come as a big relief given that half of the expenditure of an average household in India is on food. In case of the poor it is 60% (NSSO 2011). Over and above this a fall in global oil prices has also helped. Fuel and light inflation in October 2013 was at close to 7%. In October 2014, the number came in at 3.3%.
Hence, it can clearly be seen that there has been some relief on the inflation front.
For more than five years, inflation in general and food inflation in particular was very high. High inflation ate into the incomes of people and led to a scenario where their expenditure went up faster than their income. This led to a cut down on expenditure which was not immediately necessary.
With food inflation coming down, this should leave more money on the table for people to spend and at least theoretically should lead to a revival of consumer demand and hence, industrial activity. It is worth remembering here that when people cut down on expenditure, the demand for manufactured products falls as well. This is in turn reflected in the index of industrial production (IIP).
The IIP for the month of September 2014 was 2.5% higher in comparison to September 2013. This is a little better than the IIP for the month of August 2013 which was only 0.4% higher in comparison to August 2013. The IIP is a measure of the industrial activity in the country.
The manufacturing sector which forms a little over 75% of the IIP, grew by 2.5% during the course of the month. The number had fallen by 1.4% in August 2014. Hence, there seems to have been some recovery on this front. Nevertheless, it is highly unlikely that recovery will sustain in the months to come.
As Nisture put it “What really matters is that all other indicators of economic activity actually have slowed in the month of October, whether it is PMI, or credit demand or auto sales. So I don’t think that today’s reading of industrial production is sustainable.”
Further, what is worrying are the consumer goods and the consumer durables sectors. The numbers representing these sectors are both down in comparison to last year. When we look at the IIP from the use based point of view it tells us that consumer durables (fridges, ACs, televisions,computers, cars etc) are down by 4% in comparison to September 2013. The consumer goods are down by 11.3%.
What this clearly tells us is that despite falling inflation, people still haven’t come out with their shopping bags.  When consumers are going slow on purchasing goods, it makes no sense for businesses to manufacture them.
Why is that the case despite falling inflation? A possible explanation is the fact the wounds of a very long period of high inflation still haven’t gone away. People are still not ready to believe that low inflation is here to stay. Hence, inflationary expectations (or the expectations that consumers have of what future inflation is likely to be) are on the higher side.
As per the Reserve Bank of India’s Inflation Expectations Survey of Households: September – 2014, the inflationary expectations over the next three months and one year are at 14.6 percent and 16 percent. In March 2014, the numbers were at 12.9 percent and 15.3 percent. Hence, inflationary expectations have risen since the beginning of this financial year.
The only possible way to bring them down is to ensure that low inflation persists in the months to come. Only then will people start to believe that low inflation is here to stay. And once that happens, it won’t take much time for some consumer demand to return. As Shivom Chakrabarti, Senior Economist at HDFC Bank told Reuters “The real improvement in industrial production will be seen next year when inflation comes down, which will spur consumer spending and exports will be higher.”

The article originally appeared on www.FirstBiz.com on Nov 13, 2014

(Vivek Kaul is the author of the Easy Money trilogy. He tweets @kaul_vivek) 

The Western growth model is broken and it ain’t getting fixed any time soon

3D chrome Dollar symbol

Everyone has a plan until they get hit in the mouth – Mike Tyson

In the aftermath of the financial crisis that started in September 2008, the central banks of Western countries started printing money and pumping it into their financial systems. The hope was that by flooding the financial system interest rates could be maintained at low levels.
At low interest rates people would borrow and spend more and economic growth would return. The Federal Reserve of United States led the money printing race. But money printing hasn’t led to people borrowing and spending as was expected, as can be seen from the accompanying chart.

Source: http://www.pimco.com/EN/Insights/Pages/For-Wonks-Only.aspx

The total loans in the United States currently amount to around $58 million. The loans have been growing at 2% per year in the last five years and 3.5% over the last 12 months. As can be seen from the accompanying graph this rate of loan growth is much slower than the growth in pre-financial crisis years, when the loan growth was at around 10% per year. It even touched 20% in 2007, a year before the crisis broke out.
Hence, economic growth in the United States was a clear function of the loan growth in the pre-financial crisis years. Now that the loan growth has slowed down so has economic growth. So what will it take to bring this growth back?
As Bill Gross who formerly worked for PIMCO, one of the largest mutual funds in the world,
put it in a September 2014 columnOver the long term, however, economic growth depends on investment and a rejuvenation of capitalistic animal spirits – a condition which currently does not exist…The U.S. and global economy ultimately cannot be safely delivered with artificially low interest rates, unless they lead to higher levels of productive investment.”
The standard theory that has emerged in the aftermath of the financial crisis is that consumer demand has collapsed in the Western world and this has led to a slowdown in economic growth. In order to set this right people need to be encouraged to borrow and spend. The trouble is that it was “excessive” borrowing and spending that had led to the crisis in the first place.
Raghuram Rajan and Luigi Zingales suggest this in a new afterword to
Saving Capitalism from the Capitalists: “For decades before the financial crisis in 2008, advanced economies were losing their ability to grow by making useful things. But they needed to somehow replace the jobs that had been lost to technology and foreign competition… So in an effort to pump up growth, governments spent more than they could afford and promoted easy credit to get households to do the same. The growth that these countries engineered, with its dependence on borrowing, proved unsustainable.
Interestingly, from 1900 to 1980, 70–80 percent of the global production of goods happened in the United States and Europe. By 2010, this share had declined to around 50 percent, around the same level that it was at in 1860. Also, faced with increased global competition, Western workers were unable to demand the pay increases that they used to in the past. This led to Western governments following an easy money policy, where they encouraged citizens to borrow and spend, and this ensured that economic growth remained strong.
But in the aftermath of the financial crisis this growth model has broken down with people not borrowing as much as they did in the past. So what is the way out? The way out is to create sustainable growth that is not financed through debt-fuelled consumption all the time. As Rajan and Zingales put it “The way out of the crisis cannot be still more borrowing and spending, especially if the spending does not build lasting assets that will help future generations pay off the debts they will be saddled with. The best short-term policy response is to focus on long-term sustainable growth.”
Nevertheless that is easier said than done.
A March 2011 working paper by Michael Spence and Sandile Hlatshwayo provides the reason for the same. As the economists point out “Between 1990 and 2008, jobs have seen a net increase of 27.3 million on a base of 121.9 million in 1990..Almost all of those incremental jobs (26.7 of 27.3 million) were created in the nontradable sector. In the aggregate, tradable sector employment growth was essentially flat.”
So what does this mean? Jordan Ellenberg defines the term nontradable sector in his book
How Not To Be Wrong—The Hidden Maths of Everyday Life. Nontradable sector is “the part of the economy including things like government, health care, retail, and food service, which can’t be outsourced and which don’t produce goods to be shipped overseas.”
Hence, basically whatever could be outsourced outside the United States has already been outsourced. This is simply because it is cheaper to produce stuff outside the United States. And this is likely to continue in the years to come. Over the coming decades, a billion more people are expected to join the work force in Asia, Africa and Latin America. This will apply a further downward pressure on costs and prices. Hence, Americans will not really be in a position to demand pay increases as they could have in the past.
What is true about the United States is also true about other developing countries as well. Given this, the Western growth model is well and truly broken. And as of now, the way things stand, it doesn’t look like if it will be fixed any time soon.

The article originally appeared in www.FirstBiz.com on Nov 12, 2014

(Vivek Kaul is the author of the Easy Money trilogy. He tweets @kaul_vivek)