All is well with the economy? Surely you must be joking, PM Modi

narendra_modi

Prime Minister Narendra Modi briefly turned economist, in a speech, a couple of days ago, and in his charismatic and characteristic style told the country that there is no reason to worry, all is well.

He further said that people who were critical of the current economic scenario were spreading pessimism because only after spreading pessimism could they sleep well at night.

Modi offered us a whole host of economic data to show that India continues to do well. On economic growth slowing down to 5.7 per cent during April to June 2017, the Prime Minister had this to say: “Is it the first time that economic growth during a quarter has reached 5.7 per cent?

He then went on to point out: “In six years of the previous government, eight times the economic growth rate had fallen to 5.7 per cent or lower.”

By this logic, nothing that is happening now is a reason to worry because it has, more or less, already happened before. This seems like pretty convoluted logic. Also, it goes back to what the Bharatiya Janata Party (BJP) does every time it is in some sort of a soup: blame the Congress.

In this piece, I will stick to the economic growth point, having made a point-to-point rebuttal of Modi’s cherry-picking of data to build a positive economic narrative, elsewhere.

Let’s look at Figure 1, which basically plots the quarterly (three-month period) gross domestic product (GDP) growth from June 2012 onwards.

Figure 1

Source: Ministry of Statistics and Programme Implementation

What is plotted as June 2012 in Figure 1 is basically the economic growth (GDP growth) during April to June 2012 in comparison to April to June 2011. This is true for all other data points.

The question is why have I taken economic growth from the period of three months ending June 2012 onwards? The answer lies in the fact that the new GDP series that the government started using from January 2015, has data starting from April to June 2011 onwards.

Given this, economic growth can be calculated only from April to June 2012 onwards. It will become clear later in this piece as to why am I making this point.

As is clear from Figure 1, economic growth has been falling from March 2016 onwards. The economic growth has fallen for the last six quarters. This is a real reason for worry. This is something that PM Modi forgot to mention in his big speech. This has never happened before if we were to just look at the new GDP series.

As mentioned earlier, Modi pointed out in his speech: “In the six years of the previous government, eight times the economic growth rate had fallen to 5.7 per cent or lower.”

As can be seen from Figure 1, economic growth has fallen below 5.7 per cent five times. Of this, economic growth fell below 5.7 per cent four times when Manmohan Singh was PM. It needs to be mentioned here that Manmohan Singh was the PM for 10 years, whereas Modi has been for three-and-a-half.

So, how Prime Minister Modi ended up saying that during the previous government “eight times the economic growth rate had fallen to 5.7 per cent or lower”, is a question well worth asking.

Did he use the old GDP series along with the new GDP series? Let’s merge the data from the two series (which is not the right way of going about things, but nonetheless) and see what we get.

Basically, we use GDP growth from the old series between the period of three months ending June 2005 and the period of three months ending March 2012, and after that we use the new GDP series. Take a look at Figure 2.

Figure 2

Source: Ministry of Statistics and Programme Implementation

Even after merging the two series, we get only five instances of growth falling below 5.7 per cent during the previous regime. This makes me wonder, where did Prime Minister Modi’s speech writer get the data from?

Modi had also said in his speech: “The country’s economy has seen quarters when the economic growth rate has fallen to levels of 0.2 per cent, 1.5 per cent.”

This hasn’t happened any time since June 2005 (again, we come to this conclusion only by wrongly merging the two GDP series, but Prime Minister Modi’s speech doesn’t leave us with any other option).

While the new GDP series has been in use from January 2015 onwards, the government hasn’t come up with GDP data based on the series for the period before April to June 2011, up until now.

The reason perhaps lies in the fact that the old GDP series under-declared growth to the extent of 2 per cent. Hence, any economic growth data from before April to June 2011 will basically end up showing the current slow rate of economic growth, in further bad light.

Now let’s take a look at Figure 3.

Figure 3

Source: Author calculations on data from the Ministry of Statistics and Programme Implementation

Figure 3 basically plots the growth of the non-government part of the economy, which typically constitutes 87 to 92 per cent of the economy. The growth of the non-government part of the economy has fallen to around a little over 4 per cent. This extremely important detail did not find a place anywhere in Prime Minister Modi’s speech.

If the non-government part of the economy is growing at such a slow rate, how will jobs for the one million youth entering the workforce every month, ever be created. The situation becomes even more worrisome if we look at Figure 4.
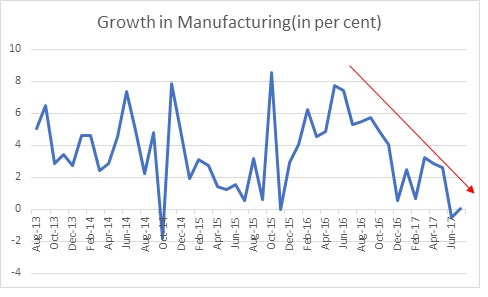
Figure 4

Source: Ministry of Statistics and Programme Implementation

As is clear from Figure 4, the growth rate of industry in general and manufacturing and construction in particular is at a five-year low. The manufacturing part of industry grew at 1.17 per cent during April to June 2017, whereas construction grew by 2 per cent during the same period.

This is a big reason to worry simply because manufacturing and construction have the potential to create new jobs. An estimate made by Crisil Research suggests that in construction, 12 workers are typically required to create Rs 10 lakh worth of output. In case of manufacturing, it is seven workers.

India’s economy has a problem. The sooner the government acknowledges and works towards it, the better it is going to be for all of us. But in this era of post-truth, it is more important for the government to keep spinning things than acknowledge the truth.

The column originally appeared on Newslaundry on October 6, 2017.

Mudra Loans Haven’t Created 8 crore Self-Employment Opportunities

mudra-580x372

Arjun Kumar and Vivek Kaul

In his fourth Independence Day speech on August 15, 2017 as Prime Minister, Narendra Modi said: “Over the past three years, Pradhan Mantri Mudra Yojana has led to millions and millions of youth becoming self-dependent. It’s not just that, one youth is providing employment to one, two or three more people.”

Similar views were expressed by Amit Shah, the president of the Bharatiya Janata Party in May 2017, when he said: “We have tried to give new perspective to employment as it is not possible to provide employment to everyone in a country of 125 crore people. We are promoting self-employment and the government has made eight crore people self-employed.”

These remarks emerge out of the assumption that each loan given under the Pradhan Mantri Mudra Yojana(PMMY, and more popularly referred to as a Mudra Loan), leads to the creation of at least one self-employment opportunity. Is that correct? Let’s take a look at Table 1.

Table 1, tells us that up until early September 2017, close to 9 crore loans have been disbursed under the PMMY. When Shah had made the statement in late May, he had perhaps claimed on the basis of this data that the government had made 8 crore people self-employed.

The assumption was that one Mudra loan makes one individual self-employed. PM Modi in his speech essentially seemed to have assumed one Mudra loan leads to one individual becoming self-employed and he, in turn, employs more people. Take a look at Table 2.

What does Table 2 tell us? It tells us that the average loan being given under the PMMY has jumped from Rs 39,405 in 2015-2016 to around Rs 46,528 in the current financial year. Now let’s take a look at the data at a more granular level in Table 3, focusing on two previous financial years.

As can be seen from Table 3, in the previous two financial years, the total number of loans given to new entrepreneurs stood at 2.25 crore. This amounts to a little over 30 per cent of the total loans. Hence, the claim that 8 crore self-employment opportunities have been created because of PMMY loans doesn’t really add up. A bulk of the loans has been given to people who are already self-employed.

The PMMY loans are categorised into three types. These are Shishu (upto Rs 50,000), Kishore (from Rs 50,000 to 5,00,000) and Tarun (from Rs 5,00,000 to 10,00,000). Let’s look at Table 4, which goes into some detail of these different kinds of PMMY loans.

We can see from Table 4 that the most basic Shishu loans over the last two financial years formed around 92-93 per cent of the total loans. Now look at Table 5, which basically tells us the average amount of loan taken under each of the different kind of loans.

The Shishu loans on an average amounted to Rs 19,400 in 2015-2016 and Rs 23,300 in 2016-2017. This basically means that the average loan given under PMMY is very small. It is highly unlikely that such a small amount of capital can create any employment. Hence, it might act more as an overdraft facility for the self-employed (such as Kisan Credit Cards for farmers) than be able to create employment. Also, whether the new entrepreneurs who have taken PMMY loans continue to survive as entrepreneurs, is an interesting question which researchers need to explore.

It is worth pointing out that many self-employed people in India are not self-employed by choice. Economists Abhijit Banerjee and Esther Duflo call them ‘reluctant entrepreneurs’. They do not have a choice. This can be understood from the fact around 46-47 per cent of the Indian workforce is self-employed. Take a look at Table 6.

The above table clearly indicates that the salaried labour force is way better off than the self-employed. Nearly two-thirds of the self-employed earn up to Rs 7,500 per month. For the salaried, this is at a little over 38 per cent.

To conclude, the CEO of Mudra (Micro Units Development & Refinance Agency Ltd.) in an interview to a private media house, when asked the question on the number of jobs created by the Mudra loans, had said: “We are yet to make an assessment on that… We don’t have a number right now, but I understand that NITI Aayog is making an effort to do that.”

In such a situation, the hypothesis of the government that Mudra loans are making crores of youth self-dependent seems to be flawed. It seems more of a political gimmick, because remaining in power is more important than working to allay the distresses of those who are still seeking employment.

This originally appeared in Newslaundry on September 21, 2017.

Modinomics, meet the industrial slowdown!

narendra modi
The Prime Minister, Shri Narendra Modi addressing the Nation on the occasion of 71st Independence Day from the ramparts of Red Fort, in Delhi on August 15, 2017.

The index of industrial production (IIP) figures declared earlier this week, portray a worrying picture of the overall Indian economy. The IIP is a measure of industrial activity in the country.

For the month of July 2017, the IIP grew by 1.2 per cent in comparison to July 2016. In June 2017, it had contracted by 0.2 per cent. While, there has been some improvement month on month, the overall trend of the IIP growth has been down for a while. Take a look at Figure 1, which basically plots the IIP growth (or contraction for that matter) over the last four years.

Figure 1:


As is clear from Figure 1, for more than a year now, the overall trend of IIP growth in the country has been downward. This is a clear indication of a slowdown in the growth of industrial activity.

One of the ways through which IIP is measured is referred as economic activity based classification. As per this method, manufacturing accounts for 77.6 per cent of the IIP. And if things for overall IIP have been bad, they have been worse for manufacturing. Take a look at Figure 2, which basically plots the growth (and contraction) in manufacturing over the last four years.

Figure 2:

modinomics
Source:  Ministry of Statistics and Programme Implementation.

What does Figure 2 tell us? The manufacturing scene in the country doesn’t look great. In July 2017, manufacturing grew by just 0.1 per cent, after having contracted by 0.5 per cent in June 2017. This is a trend that was also visible in the gross domestic product (GDP) data released in late August 2017. Let’s take a look at Figure 3, which plots the growth rates of industry and manufacturing using GDP data, over the last four years.

Figure 3:

Figure 3 clearly tells us that the growth in industry and manufacturing as per the GDP data is at a four-year low. For the period April to June 2017, industry and manufacturing grew at 1.6 per cent and 1.2 per respectively, in comparison to the same period last year.

What does this mean for the overall economy? Industry has formed around 29-31 per cent of the GDP over the years. The fact nearly one-third of the economy is barely growing should be a big reason for worry. This will impact economic growth in both direct and indirect ways. If one-third of the economy barely grows, overall economic growth is bound to slowdown. That is the direct impact.

What about the indirect impact? In order to understand this, we need to figure out how many people actually work for industry. In 2009-2010, the industry as a whole employed around 9.9 crore individuals. Analysts, Nikhil Gupta and Madhurima Chowdhury, who work for stock brokerage Motillal Oswal, in a recent research note using data from the 2014-2015 Annual Survey of Industries, state: “Over the past 35 years, employment in Indian industrial sector has grown at an average of ~2%.” The actual figure is 1.9 per cent per year.

Hence, employment in the industrial sector tends to rise at the rate of 1.9 per year on an average. Using this, we can conclude that by March 2017, the total number of people working in industry would stand at around 11.3 crore. Further, the average Indian family has 5 people. Given this, around 55 crore individuals in a population of 130 crore or around 42 per cent of the population depend on income from industry, in one way or another. An if the industry is barely growing, these people will go slow on their consumption and other expenditure, and in the process slowdown overall economic growth. This is the indirect impact.

Why is this happening? The economic slowdown initiated by demonetisation is basically continuing. It is worth remembering that first and foremost is a medium of exchange. It is a token to carry out economic transactions. When you take 86.4 per cent of the currency in circulation out of an economy, where 80 to 98 per cent of the consumer transactions (in volume, and depending on which data source you take) is carried out in cash, economic transactions are bound to slowdown. And ultimately this is reflecting in the manufacturing data.

If there is slowdown in consumption, there is a bound to be a slowdown in manufacturing. If people are not buying stuff at the same pace as they were in the past, there is no point in companies increasing production like they were in the past.

The irony is that this crisis the Modi government brought upon us. Indeed, this is very worrying in a country where one million individuals are entering the workforce every month. That makes it 1.2 crore, a year. If the growth in industrial sector slows down to the level that it currently has, how will any jobs be created for these youth.

And that is a question worth asking.

The column originally appeared in Newslaundry on September 14, 2017.


India@70: Where are the jobs?

indian flag

On August 9, 2017, lakhs of people belonging to the Maratha caste poured into the city of Mumbai for a silent march. 57 similar marches had already taken place in the state of Maharashtra, starting from Aurangabad on August 9, 2016. This was the 58th. The rallying cause behind the marches was to protest against the rape and murder of a teenaged girl belonging to the caste in Ahmednagar district in July last year. Other than the rallying cause, the Marathas have demanded quotas in government run as well as aided educational institutions. They also want reservations in government jobs.

Marathas are not the only land-owning caste in the country demanding a reservation in government jobs. Similar demands have been made by the Patels in Gujarat, the Kapus in Andhra Pradesh, the Jats in Haryana and the Gujjars in Rajasthan. The question is why do land-owning castes suddenly want reservation in government jobs, seven decades after Independence?

A major reason for this lies in the fact that the average size of a farmer’s landholding has fallen over the years. As the State of Indian Agriculture Report of 2012-2013 points out: “As per [the] Agriculture Census [of] 2010-11, small and marginal holdings of less than 2 hectare[s] account for 85 per cent of the total operational holdings and 44 per cent of the total operated area. The average size[s] of [the] holdings for all operational classes (small & marginal, medium and large) have declined over the years, and for all classes put together it has come down to 1.16 hectare[s] in 2010-11 from 2.82 hectare[s] in 1970-71.”

Take a look at Figure 1.

Figure 1:  Decline in the average size of agricultural landholdings between 1970-1971 and 2010-2011.

Source: State of Indian Agriculture Report, 2012-2013.

The agriculture census is carried out every five years. Hence, the latest available data is as of 2010-2011. The situation would have only gotten worse since then. The trend of falling farm sizes can be clearly seen from Figure 1. As the same piece of land has got divided among more and more family members over the generations, the average holding has fallen dramatically. And this has made agriculture unviable for many in the land-owning castes. Hence, the demand for reservation in government jobs.

The trouble is that the government doesn’t create jobs anymore, neither at the level of state governments nor at the level of the central government. Hence, what will happen once the land-owning castes figure this out? Will they demand reservations in private jobs as well?

The rate of unemployment

The irony is that the huge demand for jobs among the land-owning castes and others is not reflected in India’s rate of unemployment. The Labour Bureau carries out the Annual Employment-Unemployment Survey. This Survey is hardly annual. It was first carried out in 2009-2010. It skipped a year and was carried out for the next three years. It skipped a year again in 2014-2015 and was carried out again in 2015-2016. The 2015-2016 Survey is what will be discussed here.

The Labour Bureau basically measures unemployment using two methods. The first method is called the Usual Principal Status (UPS) approach. In this approach, “the major time spent by a person (183 days or more) is used to determine whether the person is in the labour force or out of the labour force.”

As per this method, the rate of unemployment was just 5 per cent.

The second method is called the Usual Principal and Subsidiary Status (UPSS) approach. Here, “a person who has worked even for 30 days or more in any economic activity during the reference period of [the] past twelve months is considered as employed under this approach.” As per this method, only 3.7 per cent of the workforce was unemployed.

Such low rates of unemployment are hardly surprising given the definitions of unemployment that are being followed. In the first method, an individual might have been unemployed for close to half the year but would still be considered to be employed. In the second method, an individual might not have had a job for 11 months during the year and would be considered employed.

Given this, the rate of unemployment does not tell us anything about the desperate search for jobs. But there is another set of data points that the Labour Bureau puts out, and that rarely makes it to the media. Take a look at Table 1.

Table 1:  All-India percentage distribution of persons available for work for 12 months (UPSS approach).

Source: Report on the Fifth Annual Employment-Unemployment Survey, 2016.

Table 1 basically tells us what proportion of the population which is looking for a job all through the year is able to find one. Around 61 out of 100 Indians in the workforce looking for a job all through the year are able to find one. In rural areas, only around 53 out of 100 individuals who are looking for a job all through the year are able to find one. These numbers point towards the huge underemployment of India’s workforce.

This is hardly surprising given that in the last two financial years, agriculture has contributed around 14 per cent to the gross domestic product and employed close to half of the working population. There is a clear mismatch here. Around half the country’s workforce is only contributing 14 per cent of the GDP.

What this means is that there is huge disguised unemployment in the rural areas. Disguised unemployment essentially means that there are way too many people trying to make a living out of agriculture. On the face of it, they seem employed. Nevertheless, their employment is not wholly productive, given that agricultural production would not suffer even if some of these employed people stopped working.

So, the unemployment numbers might not point towards India’s distressing job situation but the underemployment number clearly does. This is also borne out in Figure 2, which has been sourced from a recent report titled OECD Economic Surveys India.

Figure 2:

This report puts the rate of unemployment among India’s youth between the ages of 15 and 29 at more than 30 per cent. These youths are neither employed nor in education or training.

Regular unemployment data

The Fifth Annual Employment-Unemployment Survey was carried out in 2015-2016. It has been close to a year and a half since then and we haven’t had any fresh unemployment data being published by the government.

As Volume 2 of the Economic Survey of 2016-2017 released earlier this month, points out: “The lack of reliable estimates on employment in recent years has impeded its measurement and thereby the Government faces challenges in adopting appropriate policy interventions.” It then lists out 10 ways used by the government to measure unemployment and the problems with them. The problems listed are: “Partial coverage, inadequate sample size, low frequency, long time lags, double counting, conceptual differences and definitional issues, rarely used for the purpose of employment estimation etc.” This, of course, leads to the question why have 10 wrong ways of measuring unemployment and not one right way?

The government has tried to correct this by setting up a task force headed by [now former] NITI Aayog Vice-Chairman Arvind Panagariya to generate timely and reliable employment data. This is a step in the right direction. The tragedy is that this should have happened many years back, even before Narendra Modi took over as the prime minister. Of course, the previous governments are to be blamed for this as well. The Modi government also took more than three years to initiate something to solve this problem.

The trouble is that close to one million Indians are entering the workforce every month. That makes it around 1.2 crore Indians a year. And the government is still struggling with counting the number of the unemployed.

What makes things worse is that most of the individuals who are entering the workforce are not skilled enough. Over the years, the government has tried to correct this by outsourcing skill development to the private sector rather than just depending on the Industrial Training Institutes or the ITIs. But the scale of operation continues to remain very small.

As the Economic Survey referred to earlier points out: “For urban poor, Deendayal Antyodaya Yojana National Urban Livelihoods Mission (DAYNULM) imparts skill training for self and wage-employment through setting up self-employment ventures by providing credit at subsidized rates of interest. The government has now expanded the scope of DAY-NULM from 790 cities to 4,041 statutory towns in the country. So far, 8,37,764 beneficiaries have been skill-trained [and] 4,27,470 persons have been given employment.” When one million Indians are entering the workforce every month, this is not even a drop in the ocean.

Other data points

While we may not know the right rate of unemployment on a regular basis, there is enough other data that suggests that job creation is not happening. Take a look at Figure 3. It basically plots the bank lending to industry.

Figure 3:

Source: Reserve Bank of India.  

The lending carried out by banks to the industry has fallen over the years. In fact, in 2016-2017, the lending to industry shrunk by more than Rs 50,000 crore. This basically means that on the whole, the banks did not lend a single new rupee to the industry in 2016-2017. The reason for this is very straightforward. The industry has defaulted on its past loans and banks are no longer in the mood to lend.

This also shows us that the industries are no longer borrowing and expanding and creating jobs in the process. Of course, banks are not the only source of borrowing for industry. If we were to look at the overall flow of financial resources to the commercial sector it was down by around 11 per cent in 2016-2017 in comparison to a year earlier (Source: RBI Monetary Policy Report April 2017).

Over and above this, demonetisation had a huge negative impact on jobs in the informal sector. The Bharatiya Mazdoor Sangh (a trade union affiliate of the BJP) estimated that nearly 2.5 lakh units in the unorganised sector were closed down. Then there is the latest Reserve Bank of India (RBI) Consumer Confidence Survey. More people now believe that the employment conditions have worsened over the last year.

The leaders of the Bharatiya Janata Party like to claim that crores of jobs have been created through Mudra (Micro Units Development and Refinance Agency Bank) loans given out by banks. In 2015-2016 and 2016-2017, a total of 7.46 crore individuals were given Mudra loans. Hence, 7.46 crore jobs were created is the logic that is offered. But this is something that the CEO of Mudra does not confirm. As he told NDTV recently, when asked how many jobs had these loans created: “We are yet to make an assessment on that… We don’t have a number right now, but I understand that NITI Aayog is making an effort to do that.

The point being India has a serious jobs problem and we aren’t doing much to tackle it. And there are going to be no acche din without jobs.

The column originally appeared on Newslaundry on August 15, 2017.

The Other Side of GST

There is a difference between making things simple and making them simplistic. In the zeal to make things simple a significant chunk of media’s coverage on the recently introduced Goods and Services Tax (GST) has turned out to be simplistic.

Here’s how.

There are two basic concepts at the heart of the GST. It has a self-policing feature built into it and it allows for an input tax credit. And both are linked.

Let’s start with the second feature first. What is input tax credit? Let’s say you are a manufacturer. The product you make needs different kinds of raw material. You buy this raw material from other suppliers. When you buy this raw material from other suppliers, they have already paid some indirect taxes on it and these indirect taxes are built into the price that you pay.

In the pre-GST era, you could not deduct for the taxes already paid down the value chain, while you paid your share of indirect taxes. In this way, you ended up paying a tax on tax and hence there was a cascading effect on the final price of the product.
GST subsumes many indirect taxes both at the level of the state governments as well as the central government. And that is a good thing because it actually reduces the number of taxes.

With the introduction of the GST, you can deduct the GST already paid as a part of your value chain, while paying your share of the GST. This is referred to as input tax credit.
And how do you get this input tax credit? As Section 16(2a) of the Central Goods and Services Tax Act, 2017, points out: “Notwithstanding anything contained in this section, no registered person shall be entitled to the credit of any input tax in respect of any supply of goods or services or both to him unless,–– (a) he is in possession of a tax invoice or debit note issued by a supplier registered under this Act, or such other tax paying documents as may be prescribed.”

What does this mean in simple English? It basically means that anyone claiming an input tax credit for the GST already paid down his value chain, needs to ensure that his suppliers have registered under this Act (i.e. they have a Goods and Services Tax Identification Number (GSTIN)). The individual also needs to ensure that he is in possession of an invoice from his suppliers.

This is the self-policing feature built into the GST. Anyone claiming an input tax credit needs to ensure that all his suppliers are a part of the GST as well. This basically ensures that if any supplier was operating in the informal economy, he now has to become a part of the formal economy by getting a GSTIN. Wherever this chain breaks, the government knows that somebody is not paying his fair share of taxes. So far so good.

Norman Loayza, an economist with the Development Research Group of the World Bank defines informality asa term used to describe the collection of firms, workers, and activities that operate outside the legal and regulatory frameworks or outside the modern economy.” And given this, governments are not able to collect tax from firms operating in the informal economy. The GST is a way of ensuring that these firms become a part of the formal economy and they pay taxes.

Much of the writing in the media has focused on this and passed it as a good effect of the GST, which it is. But saying that it is only a good effect and does not have any negative sides to it, is making things simplistic instead of simple.

Let me explain.

Loayza estimates that in a typical developing country the informal economy employs 70 per cent of the labour force and produces around 35 per cent of the GDP. India has multiple estimates of the size of the informal economy.

Take a look at the following figure.

Source: Boosting Growth and Employment in the BRICS’ Prepared by ILO and VV Giri National Labour Institute, INDIA. September 15, 2016.

As per Figure 1, nearly 67 per cent of India’s labour force works in the informal economy. This touches nearly 85 per cent, if we take the informal workers in the formal economy into account as well. Many formal firms under declare the total number of people they employ.

The India Employment and Labour Report of 2014 states: “An overwhelmingly large percentage of workers (about 92 per cent) are engaged in informal employment and a large majority of them have low earnings with limited or no social protection.”

There are other estimates as well. Nevertheless, most of these estimates put the size of the labour force working in the informal economy at around 75 per cent or more of the total labour force. Also, depending on which estimate you believe the informal economy contributes 35 to 45 per cent of the GDP, which is huge.

The question is why are the firms operating in the informal economy, and not formal? The simplistic answer is that they want to avoid paying tax. And GST will make them compliant on that front.

Many Indian firms operating in the informal economy do so because going formal means following a whole host of rules and regulations, which they simply do not have the wherewithal to follow. The National Manufacturing Policy of 2011 estimates that, on an average, a manufacturing unit needs to comply with nearly 70 laws and regulations. At the same time, these units sometimes need to file as many as 100 returns a year.

Furthermore, India has 150 state level-labour laws and 44 central-level labour laws.
GST will force informal firms to go formal, the question is, will they? It really depends on whether it will be viable for them to do so. Instead of going formal, they may simply decide to shutdown. This is also a possibility, which the media seems to have taken great care not to talk about. How this will play out, no one really knows and only time will tell.

If GST has to be a real success then the ease of doing business in India needs to start improving as well. Nothing much has happened on that front.

If the informal firms shutdown, how is the situation likely to play out? Many people will end up losing jobs and this will have an impact on consumption and economic growth.
Will the smaller formal firms cash in on the situation by expanding their production and recruiting more people? Again, it’s not so easy. The average Indian manufacturing firm is very small. In many cases, it employs even less than ten people.

Many formal firms continue to want to stay small so that they don’t come under the ambit of labour laws. As Jagidsh Bhagwati and Arvind Panagariya write in India’s Tryst with Destiny: “The costs due to labour legislations rise progressively in discrete steps at seven, ten, twenty, fifty and 100 workers. As the firm size rises from six regular workers towards 100, at no point between the two thresholds is the saving in manufacturing costs sufficiently large to pay for the extra costs of satisfying these laws.” Panagariya is currently the Vice Chairman of the NITI Aayog.

The situation will end up benefitting the larger firms who will end up capturing a larger portion of the market. And this will give them pricing power as well. Of course, it will mean more taxes for the government, which can then continue with its many boondoggles or create newer ones.

Also, it is worth mentioning here that while the owners of firms working in the informal economy don’t pay taxes, those working in these firms do pay their share. Most of these workers earn lesser than Rs 2.5 lakh. Hence, they don’t come under the ambit of income tax. When they spend the money that they earn they pay indirect taxes. Also, the money they spend is income for firms operating in the formal economy, which then pay their share of income tax.

Given this, simply arguing that all informal economy is bad, is basically a very simplistic way of looking at things. Ultimately, it provides jobs to three-fourths of the labour force and that can’t be ignored. Hence, it is important that the media, economists and analysts, try to explore this other side of the GST as well.

The article originally appeared on Newslaundry on July 12, 2017.