Stop Fighting, Mr Taxman

Sometime in mid-2016, the revenue secretary Hasmukh Adhia, quoted the prime minister Narendra Modi as saying: “You should behave like mentors to people, rather than invaders. Don’t presume that every one is tax evader.”

The “you” in this case were tax administrators. Prime minister Modi was speaking at a two-day annual conference of tax administrators. He also asked taxmen to be soft and sober in their approach towards those who pay tax.

The Economic Survey for 2017-2018 released yesterday reveals that the taxmen across board are anything but soft and sober towards taxpayers. And that they love to litigate and then lose.

As of March 2017, more than 1.37 lakh direct tax (individual income tax, corporation tax etc.) cases were pending at the level of ITAT, various High Courts and the Supreme Court (See Figure 1).

Figure 1: Pending Direct Tax Cases.

Source: Economic Survey 2017-2018.

As the Survey points out: “Just 0.2% of these cases constituted nearly 56% of the total demand value; and 66% of pending cases, each less than Rs 10 lakhs in claim amount, added up to a mere 1.8% of the total locked-up value of pending cases.” Basically, this data shows that the cases where the amount of the tax dispute is really large, form a very small part of the whole.

A similar situation exists for indirect taxes (customs and excise) as well. Take a look at Figure 2.

Figure 2: Pending Indirect Tax Cases.

Source: Economic Survey 2017-2018.

As of end March 2017, a total of 1.45 lakh appeals were pending with the Commissioner (Appeals), CESTAT, various High Courts and the Supreme Court.

As of end March 2017, the total claims for both direct and indirect taxes stuck in litigation amounted to Rs 7.58 lakh crore or 4.7 per cent of the GDP. This value of total claims stuck in litigation has been going up over the years.

Imagine the kind of things that the government could do with this money. The trouble is that the taxmen do not have a great record at litigation. Their success rate is extremely low. Take a look at Table 1.

Table 1:

Source: Economic Survey 2017-2018.

As can be seen from the above Table, the taxmen tend to lose a bulk of the cases. In case of the Supreme Court, their success rate is 27 per cent in case of direct tax cases and 11 per cent in cases of indirect tax cases. This also tells us the strength of the cases brought upon the assessees are fairly week.

In fact, over a period of time, the success rate of the taxmen has been going down, the Economic Survey points out: “The [taxman] unambiguosuly loses 65% of its cases. Over a period of time, the success rate… has only been declining, while that of the assessees has been increasing.”

Despite, this lack of success, the taxmen are big litigants. As can be seen in Table 1, the petition rate is very high. The petition rate is basically defined as “the percentage of the total number of appeals filed by” the taxmen. The remaining appeals are those filed by the assessees. In case of indirect taxes, the petition rates are lower than that of direct taxes.

The taxmen don’t give up litigating easily and even if they lose at lower levels, they continue to appeal at higher levels. But as we saw earlier, at least in case of direct taxes, a bulk of these claims are of less than Rs 10 lakh. And given that the taxmen lose a bulk of these cases, this is basically nothing but the harassment of people who pay their taxes honestly.

Gurcharan Das explains one reason for this in his book India Grows at Night. As he writes: “The problem [lies] in the fact that the decision to litigate [is] made at the lowest level in the bureaucracy but the decision not to litigate [is] made at the highest level. If this process were simply reversed, government litigation would come down.”

In fact, the fact that taxmen love to litigate increases the workload on the Courts and this is something that can be well avoided. Even though, the “strike rate [of taxmen] has been falling considerably over a period of time, it is undeterred, and persists in pursuing litigation at every level of the judicial hierarchy.” And this impacts the functioning of the Courts.

As the Survey points out: “Since tax litigation constitutes a large share of the workload of High Courts and the Supreme Court, Courts and the Department may gain from a reduction in appeals pursued at higher levels of the judiciary. Less might be more.”

This is something that the Narendra Modi government needs to think about if it wants the tax to GDP ratio to go up in the years to come. The taxmen need to litigate less and concentrate on the bigger cases to be more effective and deliver more bang for the buck. But this isn’t happening currently. And most importantly, who reads the Economic Survey?

The column was originally published in Think Pragati on January 31, 2018.

Economic Survey 2018: It is confirmed; this bull market has seen lower number of bakras

The Economic Survey along with being a good commentary on the state of the economy, also has some very interesting data points. One of the data points in the latest Economic Survey which was released yesterday, concerns the current bull run in the stock market.

The law of demand in economics basically states that at lower price levels, the demand is more. But this doesn’t seem to work for the stock market. Money comes pouring into shares, only after they have rallied a bit. This can easily be seen in the kind of money that has been invested into equity mutual funds during the course of this financial year.

Equity mutual funds largely invest in shares. Between April and December 2017, Rs 1,25,712 crore has been invested (net investment) into equity mutual funds. This is the highest amount of money that has ever been invested in equity mutual funds, during the course of any financial year, and the current financial year ends only in March 2018. 

As the overall stock market has gone higher and higher, more money has come into it. Other than mutual funds, public and private offerings of shares by companies, also tend to blossom when the stock market is doing well. It allows companies to sell their shares, at higher prices than they would be able to manage at any other point of time. This incentive motivates more and more companies to sell their shares, which get lapped up by the stock market investors.

The following table shows the total amount of money raised by companies through the sale of shares.

graph


Take a look at the above Table. Rs 1,52,919 crore has been raised by firms between April 2017 and November 2017, by selling their shares, during this financial year. In absolute terms, it remains the highest amount of money ever raised by companies by selling shares. The next best year was 2007-2008, when companies managed to raise Rs 1,40,844 crore, through the sale of shares.

Nevertheless, this does not take into account the fact that the Indian economy in 2017-2018 is significantly bigger than it was in 2007-2008. Hence, the capacity of the companies to raise money by selling shares, is also significantly more than it was ten years back.

How do things stack up when we look at the money raised by companies by selling shares as a proportion to the overall size of the Indian economy (the gross domestic product (GDP)). Take a look at the next Figure.

graph1


The ratio of the total amount of money raised by companies through the sale of shares to the gross domestic product, was higher in 2007-2008 than 2017-2018. As a size of the economy, companies raised more money ten years back than they have managed to do during this financial year. As we can see from the above Figure, the total money raised through the sale of shares was around 2.8 percent of the GDP, in 2007-2008. In 2017-2018, this was at around 1.5 per cent. (Look at the left axis of the figure).

Given that a lot of money raised through the sale of shares in 2007-2008 and even in 2017-2018, was and has been raised at very high prices (look at the red line in the above figure which maps the price to earnings ratio), many new investors who venture into the stock market very late in the game, tend to be made bakras in the process. They lose money on their investments.

The good thing is that during this bull run, the proportion of bakras given the increased size of the Indian economy, has been lower than was the case in 2007-2008. At least, that is what the Economic Survey data seems to suggest.

The column was originally published on January 30, 2018, on Firstpost. 

One Learning from Economic Survey: India’s Future is Pakodanomics

One issue that I have regularly written and discussed in my columns is India’s investment to gross domestic product (GDP) ratio, which has fallen dramatically over the years. The latest Economic Survey gets into great detail regarding this issue and paints, what I would call a very bleak picture of India’s economic future.

India’s investment to GDP ratio “climbed from 26.5 percent in 2003, reached a peak of 35.6 percent in 2007, and then slid back to 26.4 percent in 2017.” This is a huge fall of 9.2 per cent from the peak.

As the Economic Survey points out: “And while it is true that the past 15 years have been a special period for the entire global economy, no other country seems to have gone through such a large investment boom and bust during this period.”

Why has this dramatic fall in investment as a proportion of the overall economy happened? This is something that has been analysed to death. Nevertheless, as the Survey points out: “India’s investment slowdown is unusual in that it is so far relatively moderate in magnitude, long in duration, and started from a relatively high peak rate of 36 percent of GDP. Furthermore, it has a specific nature, in that it is a balance sheet related slowdown. In other words, many companies have had to curtail their investments because their finances are stressed, as the investments they undertook during the boom have not generated enough revenues to allow them to service the debts that they have incurred.”

It is well known that companies tend to invest and expand when they are unable to meet the demand from their current production capacity. The Reserve Bank of India carries out capacity utilisation surveys of manufacturing firms every three months. The latest survey for the period April to June 2017, found that capacity utilisation stood at 71.2 per cent. In fact, capacity utilisation has varied between 70 and 72 per cent for a while now.

As economist Madan Sabnanvis writes in his new book Economics of India-How to Fool all People for all Times: “The capacity utilisation rate has gotten stuck in the region of 70-72 per cent which means two things: first demand is absent, and second, even if it does increase, production can be scaled up without going in for fresh investment.”

While, it is easy to hope that this is something that can be unravelled, history tends to suggest otherwise. The Economic Survey looks at many other countries which, in the past, have gone through what India is currently going through on the lack of investment front. The Survey specifically looks at “cases in which the rate of investment has fallen by at least 8.5 percentage points from its peak over a 9 year period are considered.” It then goes on to find out, “what is the investment rate 11, 14 and 17 years after the peak?”

The results are far from encouraging. As the Survey points out: “Investment declines flowing from balance sheet problems are much more difficult to reverse. In these cases, investment remains highly depressed, even 17 years after the peak… India’s investment decline so far has been unusually large when compared to other balance sheet cases.”

The Survey further points out: “The median country reverses only about 25 percent of the decline 14 years after the peak, and about 40 percent of the decline 17 years after the peak.” This conclusion is based on a sample of 30 countries where the investment to GDP ratio fell by 8.5 per cent from its peak, over a 9-year period. As we have seen earlier, the investment to GDP ratio in the Indian case fell from a peak of 35.6 per cent in 2007 to 26.4 per cent in 2017.

The data points stated above do not give us much hope. It basically means that over a period of 11 years after the investment to GDP ratio peaked, the median country in the sample tends to improve its investment to GDP ratio by 2.5 per cent from the lowest level achieved. As the Survey points out: “A ‘full’ recovery is defined as attainment of an investment rate that completely reverses the fall, while no recovery implies the inability to reverse the fall at all or worse.”

The trouble is in the Indian case, more than a decade has elapsed, and the investment to

GDP ratio has continued to fall.

Take a look at Figure 1.

Figure 1: Count and Extent of Recovery from India-Type Investment Decline*Note: *T is the peak time Period *: A fifty percent recovery implies that the country attained an investment rate that reversed half of the 8.5 percentage point fall. The dots imply the percentage of the total fall that the median country namaged to reverse.
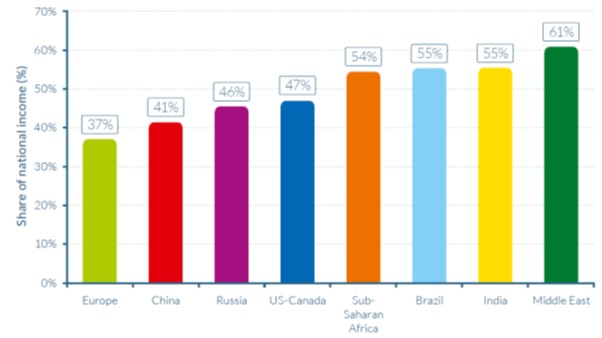
Figure 1, basically points out that over a period of 17 years after the investment to GDP ratio peaked, 10 out of the 28 countries were able to make a recovery of more than 50 per cent. Given that the Indian investment to GDP ratio has continued to fall, this does not give us too much hope. Despite this large fall in investment, India has had to pay a moderate cost in terms of growth. As the Survey points out: “Between 2007 and 2016, rate of real per-capita GDP growth has fallen by about 2.3 percentage points-that is lower than the above 3 percent decline in growth noticed, on average, in episodes in other countries that have registered investment declines of similar magnitudes.”

It is a given that unless this investment slowdown reverses at a very rapid rate, India’s hopes of providing jobs and decent employment opportunities, to a million Indians who are entering the workforce every month and the 8.4 crore Indians who need to be moved out of agriculture to make it economically feasible, remains just that, a hope.

India’s hopes of a double digit economic growth, also remain just a hope. As the Survey points out: “A one percentage point fall in investment rate is expected to dent growth by 0.4-0.7 percentage points.”

What does the Economic Survey think India’s chances are? “India’s investment decline seems particularly difficult to reverse, partly because it stems from balance sheet stress and partly because it has been usually large. Cross -country evidence indicates a notable absence of automatic bounce-backs from investment slowdowns. The deeper the slowdown, the slower and shallower the recovery,” the Survey states.

But given that it is a government document, it ends on a note of hope. “At the same time, it remains true that some countries in similar circumstances have had fairly strong recoveries, suggesting that policy action can decisively improve the outlook,” the Survey states. While this sentence suggests hope, there is nothing in the analysis carried out in the Economic Survey, which gives any hope.

The trouble is that the policy action has had next to no impact on the investment to GDP ratio for more than a decade now. The ratio has simply continued to fall.

So, what does that leave us with? Without an increase in investment there will be very few jobs and employment opportunities being created. Basically, any industry that is set up in any area, first provides jobs to people who work for it. It also creates jobs for the ancillary industries which feed into it. Over and above this, it creates other employment opportunities in the area.

When the IT industry took off in and around Bengaluru, other than providing jobs to engineers, it provided employment opportunities for drivers, cooks, maids, shop keepers, and so on. At the second level, as the engineers earned more, and demanded good residential spaces to live in, it created demand for builders. That in turn created employment opportunities in the construction and the real estate industry. And so cycle worked.

To conclude, the question is what will feed India’s huge demographic dividend of one million youth entering the workforce, every month, if investment doesn’t take off? The only answer right now is: Pakodanomics.

And to distract attention from Pakodanomics, given that it is not a great way to make a living, we will keep having more and more Padmavats, for distraction.

(You can read in detail about pakodanomics here and here).

The column was originally published in Equitymaster on January 30, 2018.

The Republic at 69 and the next seven decades

indian flag

India has been independent for more than 70 years and a republic for 68 years. Between 1950, the year, the country became a republic and 1991, the year, the government initiated economic reforms, the economic size of the country became five times.

By 2014, the economic size of the country was 4.2 times of what it was in 1991. I am forced to stop this comparison at 2014 because India adopted a new GDP series in January 2015 and the GDP data in that series is available only from 2011-2012 onwards.
The differentiating point between pre and post 1991 eras, is that the economic growth has been faster post 1991. There is no denying that this economic growth has had huge benefits.

At the same time, it has created its own set of problems as well. In 1990, as per the World Inequality Report 2018, the top 10 % of India’s population earned around 34 % of the national income. By 2016, this had jumped to 55 %. This rise in inequality has happened because the upper echelons of the society have benefitted more from the economic reforms of 1991.

As can be seen from Figure 1, India along with Brazil, have the highest concentration of wealth in the world, after the Middle East. In purchasing power terms, the per capita income of Brazil is 2.3 times that of India.

Figure 1:
inequality
Source: World Inequality Report 2018.

Inequality is not the only reason to worry about on the economic front. For years, the story of India’s demographic dividend has been sold to the world. Demographic dividend is a period of few decades in the lifecycle of a nation where it’s workforce increases at a faster pace than its overall population. As these individuals enter the workforce, find jobs, earn and spend money, the economy grows at a faster pace and pulls out many people out of poverty.

At least that is how things are supposed to work in theory. Around a million Indians are joining the workforce every month. This is expected to continue for the next decade and a half. The trouble is that there aren’t enough jobs going around. A recent estimate made by the Centre for Monitoring Indian Economy suggests that in 2017, two million jobs were created for 11.5 millions Indians who joined the labour force during the year.

There are other data points also which suggest a lack of jobs. The investment to gross domestic product ratio has been falling for a while now. The capacity utilisation rate of manufacturing firms has stagnated between 70 and 72%. If existing capacities are not being used, there is no reason for firms to expand and create jobs.

Labour intensive export sectors like apparels, gems and jewellery, leather, agriculture etc., have remained flat, over the last few years. Real estate and construction, two sectors which have tremendous potential to create jobs which cater to India’s cheap and largely unskilled labour, are down in the dumps.

For many, agriculture is no longer economically feasible. A discussion paper recently published by NITI Aayog suggests that agriculture contributes 39% of rural economic output, while employing 64 % of the workforce. For agriculture to be economically feasible nearly 8.4 crore individuals need to be moved out of it. This unfeasibility of agriculture has also resulted in landowning castes across the country, wanting reservation in government jobs.

The education scenario continues to be depressing. Children are going to school but aren’t really learning. The latest Annual Status of Education Report (ASER) states: “For the past twelve years, ASER findings have consistently pointed… that many children in elementary school need urgent support for acquiring foundational skills like reading and basic arithmetic.” Given this, even when firms have jobs, they cannot find people with the necessary skillset.

The trouble is that skilling is not happening at the scale that it needs to. The different ministries in the government had accepted a target of training 99,35,470 individuals in 2016-2017. Of this, only 19,58,723 or around less than one-fifth had been trained up to December 2016. It isn’t fair to blame the government for this, given the huge scale required. This needs a total overhauling of our education system with a huge focus on vocational studies.

Further, the Indian firms start small and continue to remain small. Labour laws remain the major culprit on this front. The state of Jammu and Kashmir has 260 labour laws. Other estimates suggest that India has around 200 labour laws in total. A very serious effort is needed at the government’s level to improve, the ease of doing business.

All in all, the scenario that prevails for India’s demographic dividend, is very bleak. And it is this demographic dividend which is expected to take us forward for the next seven decades.

The column originally appeared in the Daily News and Analysis, on January 26, 2018.

Why Pakodanomics is Not the Answer to Creating Employment

narendra_modi

India gave the world zero, and helped Mathematics, which until then was dependent on Roman numerals, leapfrog.

Last week we also gave the world, what I would like to call pakodanomics (I guess even bondanomics would work fine).

In a television interview, prime minister Narendra Modi, said: “If someone opens a ‘pakoda’ shop in front of your office, does that not count at employment? The person’s daily earning of Rs 200 will never come into any books or accounts. The truth is massive people are being employed.”

Thus, prime minister Modi, helped found a new discipline in economics, pakodanomics.

What was prime minister Modi really trying to say here? This entire jobs crisis is being overblown. What is important is employment and not jobs. This, I think, is a fair point, which most people in India do not get, given our fascination for sarkari (i.e. government) jobs. Of course, expecting the government to create employment for one million Indians entering the workforce every month and the 8.4 crore Indians who need to be moved from agriculture to make it economically feasible, is unfair. That point is well taken.

Employment can come in various forms. Even selling pakodas and making Rs 200 per day is employment. Selling pakodas on the street is incidental here. What is more important is that the prime minister of India is saying that people can sell stuff on the street, make money and employment can thus be generated.

There is a basic problem with this argument. Before I get into explaining that problem, a couple of clarifications: a) I didn’t come up with the example of the selling pakodas, the prime minister did. b) The piece is not about the unit economics of pakodawallahs and how much money they make on a given day (I know, dear reader, you know a pakodawallah who is a millionaire). But it is about selling any product on the street to earn Rs 200 per day and the prime minister of our country offering this as an employment opportunity.

At Rs 200 per day, the annual income of an individual selling pakodas (Again, let me repeat here, pakodas are incidental to the entire example. It is about making money by selling stuff on the street) would be Rs 73,000 (Rs 200 x 365 days). This is assuming that he sells 365 days a year. This is an unrealistic assumption, but we will let it be.

The per capita income of an average Indian was Rs 1.03 lakh in 2016-2017. Hence, the individual selling pakodas earns 29 per cent less than the average Indian. If I were to flip this point, an average Indian makes 41 per cent more than the individual selling pakodas. So, clearly there is a problem.

Of course, someone has to earn lower than the average income. But the difference between the average income and the income of the individual selling pakodas is significant. PM Modi’s pakoda seller is not earning much simply because there are too many people out there selling pakodas. At a broader level there are too many Indians selling stuff on streets. This is primarily because there aren’t proper jobs going around. And if there are, people are unskilled to carry them out.

Let’s get into a little more detail by looking at some data. Take a look at Table 1, which deals with the self-employed people in India.

Table 1: Self Employed / Regular wage salaried / Contract/ Casual Workers
according to Average Monthly Earnings 

What does Table 1 tell us? It tells us that nearly half of India’s workforce (46.6 per cent to be exact) is self-employed. Further, 67.5 per cent of India’s self employed make up to Rs 90,000 a year. A little over 41 per cent make only up to Rs 60,000 a year. What does this tell us? It tells us very clearly that self-employment (selling pakodas for example) does not pay well.

Most of India’s self-employed workers make lesser money per year than the average per capita income of the country, which in 2015-2016 (for which the self-employed data is), was Rs 94,130. So, there is a clearly a problem with being self-employed. (The good part is, it is better than being a casual labourer, which is by far worse. But to be self-employed you need some basic capital to start, which many Indians, who end up as casual labourers, don’t).

People in India are self-employed because they do not have a choice. Currently, the government is busy trying to pass of self-employment in India as entrepreneurship, which are two very different things. People in India become self-employed because there are no jobs going around for them. Entrepreneurship, on the other hand, is by choice.

Further, as can be seen from Table 1, getting a job is more monetarily rewarding than being self-employed. Hence, selling pakodas or being self-employed, is not the solution to the problem. It is a symptom of the problem, an indication of the problem and the fact that barely anything is being done about it.

To conclude, zero was a useful invention, pakodanomics isn’t. It’s better to get rid of it as soon as possible and concentrate on the real problem of creating the right environment which will help the real entrepreneurs create genuine employment opportunities for India’s youth.

As I keep saying, the first step towards solving a problem is recognising that it exists.

The column originally appeared in Equitymaster on January 24, 2018.