Why I agree with Arun Jaitley on ease of doing business

Fostering Public Leadership - World Economic Forum - India Economic Summit 2010
I am often accused of being extremely pessimistic about things.

May be that’s a function of having grown up in erstwhile Bihar, when Lalu Prasad Yadav ruled the state, first directly and then through Rabri Devi.

It was an era when there was nothing to look forward to and that possibly led to me becoming extremely pessimistic about most things and a cynic to boot.

The cynicism and the pessimism got further refined when I first spent three years trying to do a PhD (academics can do that to you) and then spent nearly seven years working in daily newspapers. “If it bleeds, it leads,” is an oft repeated dictum in the media, though this has started to change in the recent past.

In this scenario, my contacts in the financial services industry (mutual funds, insurance, stock broking and so on) keep telling me that I am extremely pessimistic about things. “Things are not as bad as they seem,” I am often told. But then they need to sell things but I don’t.

So today’s column is an exception to me being pessimistic all the time—but only slightly.

The World Bank released its Ease of Doing Business Rankings on October 27, 2015. India moved up four positions to 130, out of 189 nations which were a part of the ranking. This is a jump of four places in comparison to last year.

Certain sections of the media made a lot of song and dance about India’s rank jumping twelve positions to the 130th position. But that is incorrect. When the rankings were first released last year, India was at 142nd position. Nevertheless, the World Bank later revised the ranking to 134, after it started following a new methodology.

Hence, India’s ranking has jumped by only four positions and not 12 positions as a reasonably large section of the media seems to have reported.
The ranking is carried out on multiple parameters (as can be seen from the accompanying table).

TopicsDB 2016 RankDB 2015 RankChange in Rank
Starting a Business1551649
Dealing with Construction Permits1831841
Getting Electricity709929
Registering Property138138No change
Getting Credit4236-6
Proteting Minority Investors88No change
Paying Taxes157156-1
Trading Across Borders133133No change
Enforcing Contracts178178No change
Resolving Insolvency136136No change

Source: http://www.doingbusiness.org/data/exploreeconomies/india#Hence, the ranking does not measure how things stand across the length and breadth of India, when it comes to the ease of doing business. I have no way of figuring out how much Delhi and Mumbai represent the country as a whole. Hence, this and any other analysis on this topic should be viewed with this fact in mind.

India’s jump of four places has come primarily because the country’s performance has improved dramatically on the getting electricity parameter. As the report accompanying the ranking points out: “In getting electricity the main pattern is clear: economies with a simpler, faster and less costly process for connecting to the electrical grid also tend to have a more reliable electricity supply.”

And what is that Delhi and Mumbai have done right on this front? As the report points out: “Another focus is to make the process for getting a new electricity connection simpler and faster. Toward that end the utility in Delhi eliminated an internal wiring inspection by the Electrical Inspectorate—and now instead of two inspections for the same purpose, there is only one. The utility also combined the external connection works and the final switching on of electricity in one procedure.”

And how did things pan out in Mumbai? “The utility in Mumbai reduced the procedures and time for connecting to electricity by improving internal work processes and coordination. It combined several steps into one procedure—the inspection and installation of the meter, the external connection works and the final connection. Now companies can get connected to the grid, and get on with their business, 14 days sooner than before.”

The other big jump came on starting a business parameter. India moved from the 164th position to 155th position. What were the right things that happened on this front? “In May 2015 the government adopted amendments to the Companies Act that eliminated the minimum capital requirement. Now Indian entrepreneurs no longer need to deposit 100,000 Indian rupees ($1,629)—equivalent to 111% of income per capita—in order to start a local limited liability company. The amendments also ended the requirement to obtain a certificate to commence business operations, saving business founders an unnecessary step and five days,” the report points out.

Over and above this “several other initiatives to simplify the start-up process were still ongoing on June 1, 2015, the cutoff date for this year’s data collection. These include developing a single application form for new firms and introducing online registration for tax identification numbers.”

These factors helped in India’s performance on the starting a business parameter improving. On protecting minority investors front India is ranked number eight in the world, so there is not much scope for improvement there.

But look at other factors. Paying taxes continues to remain a pain and it is reflected in the 157th rank on this parameter. As a self-employed professional I can vouch for that. I am still unable to figure out why does a self-employed professional need three different numbers for income tax, service tax and professional tax? I understand that three different departments of the government are collecting these taxes, but why do I have to suffer because the right hand of the government does not talk to its left hand?

When it comes to trading across borders, India is at 133rd position and this is the same as last year. The rankings on resolving insolvency, enforcing contracts and registering property continue to remain abysmally low, all very important parts of running any business.

Once these factors are taken into account, the jump of four positions in the ease of doing business, doesn’t seem much. Yes, it is better than what it was in the past. Nevertheless, there is no real reason to make a song and dance about it, as has been done in large sections of the media.

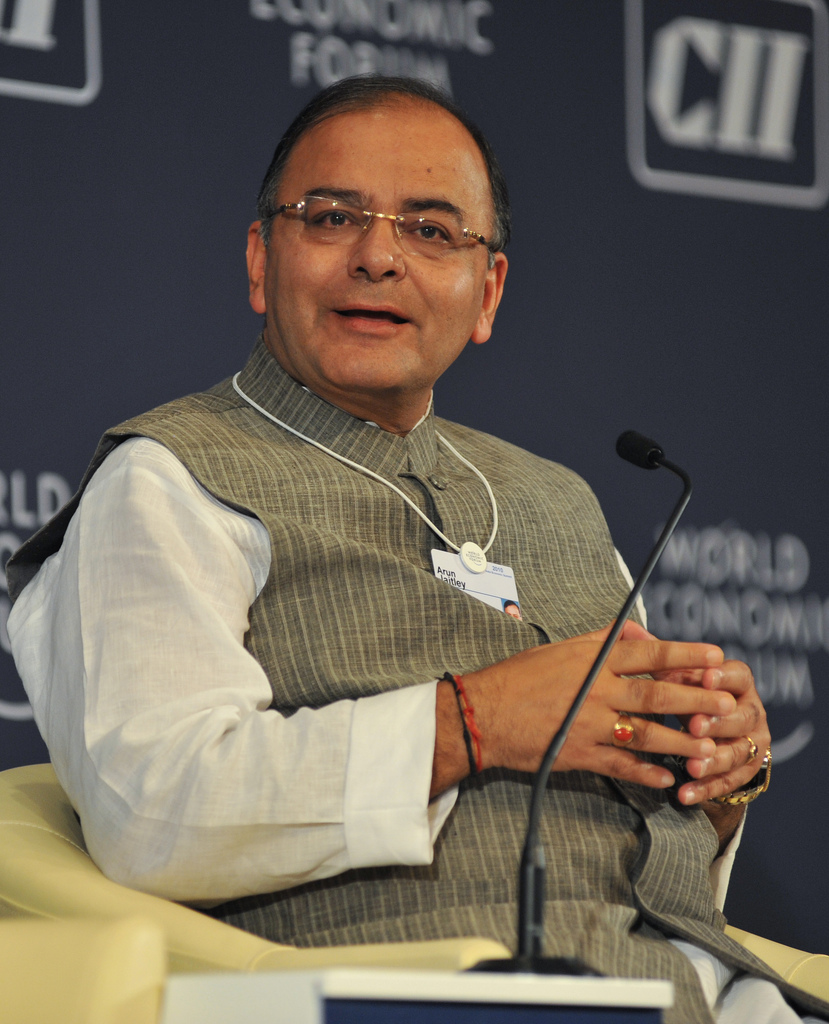
In fact, on this issue I for once agree with the finance minister Arun Jaitley who said: “I personally believe that we are still a long way away from our eventual goal. Our ranking really has to move up substantially. As of now, we are just a work in progress.”

Yes, we are just in work progress. And there is a long way to go before we can actually make some song and dance about the ease of doing business in India.  As the report points out: “Fostering an environment more supportive of private sector activity will take time. But if the efforts are sustained over the next several years, they could lead to substantial benefits for Indian entrepreneurs—along with potential gains in economic growth and job creation.”

For once I am ending on an optimistic note.

The column originally appeared in The Daily Reckoning dated October 29, 2015

Elections with tur dal tadka

Toor_Dal_Tur_dal
Dal prices have been on fire. The bureaucrats and politicians have been caught napping once again. In the recent past, tur dal prices have crossed Rs 200 per kg. The prices of other major pulses have also crossed more than Rs 100 per kg.

The governments (central as well as state governments) have gone on an overdrive and blamed the hoarders for the price rise, as they have often done since the 1960s. A statement released by the ministry of consumer affairs, food and public distribution late last week pointed out that 74,846.359 tonnes of pulses have been seized from hoarders after 6,077 raids.

It is not surprising that the central government wants to push down the price of various pulses in general and tur dal in particular, given the on-going state assembly elections in Bihar. Media reports suggest that the high dal prices have become an election issue in Bihar, with leaders of both the NDA and the Nitish+Lalu+Congress combine accusing each other of not doing enough to control dal prices.

But is hoarding the really the only reason for high prices? The ministry of agriculture publishes a document titled Commodity Profile for Pulses. This document dated March 2015 had clearly pointed out that the total production of various kinds of dal would fall by 6.8% to 18.43 million tonnes in 2014-2015. The production had stood at 19.78 million tonnes in 2013-2014.

The production of tur dal was expected to be at 2.75 million tonnes, a fall of 13.2%.  The production for 2013-2014 had stood at 3.17 million tonnes.

The Commodity Profile for Pulses dated September 2015, revised these numbers. The total production of dal was revised to 17.2 million tonnes, a fall of 13% from 2013-2014. The production of tur dal was revised to 2.78 million tonnes, a fall of 12.3% from 2013-2014.

The point here is that the government knew at the beginning of this financial year that the production of tur dal in particular and total dal production as a whole, had fallen in 2014-2015. It was but logical that hoarders would get into the fray.

This possibility should have been tackled at that point of time. By the time the government woke up to this possibility it was too little and too late. The damage of escalating dal prices had already been done.

Further, imports have been bandied around as a solution to the escalating prices. In a press release dated October 19, 2015, the ministry of consumer prices, food and public distribution stated that the “government would further import 2000 tonnes of Tur dal and 1000 tonnes of Urad dal and tender will be floated by MMTC immediately.”

As mentioned earlier the production of tur dal has fallen from 3.17 million tonnes in 2013-2014 to 2.78 million tonnes in 2014-2015. Also, a poor monsoon this year may also have had an impact on tur production. Tur is mainly grow during the kharif season and a very small portion of the total area under production has access to irrigation. The monsoon this year was at 86% of its long period average.

So what does this mean? The production of tur dal during the course of 2014-2015 was around 0.4 million tonnes lower than 2013-2014. In an article in The Indian Express Professor Ashok Gulati of ICRIER estimates that the yearly consumption of tur dal in India is in the region of 3.3 to 4 million tonnes. Trying to plug this huge gap between falling production and consumption by importing a few thousand tonnes of tur dal is not going to help much.

In fact, the global market for pulses is not very big. In 2014-2015, India imported a total of 4.6 million tonnes of dal, of which 0.58 million tonnes was tur dal. A little over half of India’s tur dal imports came from neighbouring Myanmar and the remaining came from Africa. Also, it is worth mentioning here that India is the biggest producer of tur dal in the world. So imports really cannot help beyond a point.

Further, pulses are an important source of proteins especially for vegetarians. In this scenario as per capita income goes up, the demand for pulses will continue to go up.

As the 2013-2014 annual report of ministry of consumption, food and public distribution points out: “demand for pulses has been increasing steadily mainly due to increase in population and preference for enhanced protein requirements in food.”

A discussion paper titled Taming Food Inflation in India released by the Commission for Agricultural Costs and Prices (CACP) in April 2013 and authored by Ashok Gulati and Shweta Gulati refers to the same reason. As it points out: “[The] study finds that the pressure on prices is more on protein foods (pulses, milk and milk products, eggs, fish and meat) as well as fruits and vegetables, than on cereals and edible oils, especially during 2004-05 to December 2012. This normally happens with rising incomes, when people switch from cereal based diets to more protein based diets.”

This trend of increased consumption of proteins has been around for a while. What all this clearly tells us is that the government failed to see this crisis coming, even though the data as well as the trend suggested it very clearly.

Further, the trend of increased protein consumption will continue, as people earn more and eat better. This can be only solved by producing more pulses within the country.

The government of India actively procures wheat and rice through the Food Corporation of India and other agencies. This creates its own set of problems. As the CACP report points out “Assured procurement gives an incentive for farmers to produce cereals rather than diversify the production-basket.”

The economic incentive the way it is currently structured encourages farmers to produce more of rice and wheat and not other crops. This is something that needs to be set right.

In the short run, the good news is that the area on which pulses have been sown in this kharif season has gone up to 11.6 million hectares from 10.3 million hectares last year.

As far as tur dal is concerned the area under production has gone up by 4% to 3.74 million hectares. While the number is higher in comparison to 2014-2015, it is not as high as earlier years. Between 2010-2011 and 2013-2014, the number varied between 4.42 million hectares and 3.90 million hectares. The yield in 2010-2011 was 655 kg per hectare. This had jumped to 813 kg per hectare in 2013-2014.

With an increase in area under production, prices are likely to fall a bit in the days to come. Nevertheless, if dal prices in general and tur dal prices in particular, need to come down dramatically in the years to come, then the yield as well as area under cultivation need to go up. And this is easier said than done.

(Vivek Kaul is the author of the Easy Money trilogy. He can be reached at [email protected])

The column originally appeared in The Asian Age/Deccan Chronicle on October 28, 2015

All is not well on the employment front

narendra_modi

One of the perils of writing on the Indian economy is that the access to data and numbers continues to remain very poor. Given this, every time I come across some new data on the Indian economy which is regularly generated, I try and write a column around it.

Some time back, thanks to a story in the Business Standard newspaper, I realised that the government of India puts out employment numbers as well. The Labour Bureau based out of Chandigarh puts out a quarterly report on changes in employment in selected sectors.

Interestingly, the bureau has been doing this for some time now. The surveys started in the aftermath of the financial crisis which started in late 2008. As the latest survey report released by the Labour Bureau earlier this month points out: “A need was felt to have an indication about the impact of the Global Financial Crisis on employment situation in India on quarterly basis. The Government of India therefore entrusted the task of conducting the Quarterly surveys on employment changes in selected sectors to Labour Bureau.”

The first survey was carried out for the period October to December 2008, immediately in the aftermath of the financial crisis breaking out, with the investment bank Lehman Brothers going bust in mid-September 2008. The latest report is the twenty-fifth in the series and concerns the period January to March 2015.

The latest survey covers a total of 2013 sample units in eight selected sectors. These sectors are textiles, leather, metals, automobiles, gems & jewellery, transport, IT/BPO and handloom/powerloom.

While the number of sample units at 2013 is not very big, it does give us some flavour of the employment scenario in the country. Also, it is worth remembering here that unlike a number like gross domestic product or index of industrial production, an employment number is not a totally theoretical construct.

So how do things look like? The eight sectors added 64,000 jobs between January and March 2015, in comparison to December 2014. Of this, 49,000 jobs were added in the contract category and the remaining were direct workers. The bureau defines a contract worker as: “a workman who is hired in or in connection with the work of an establishment by or through a contractor, with or without the knowledge of principal employer.”

The IT sector added 37,000 jobs during the period. The textiles sector came in next with 24,000 jobs and automobiles added 20,000 jobs during the period. A simplistic conclusion we could draw here is that the IT sector added close to 58% of the total jobs (37,000 expressed as a proportion of the total 64,000 jobs).

But that would be incorrect.

Allow me to explain. As Jordan Ellenberg writes in How Not to Be Wrong—The Hidden Maths of Everyday Life: “For example, say I run a coffee shop. People, sad to say, are not buying my coffee; last month I lost $500 on that part of my business. Fortunately, I had the prescience to install a pastry case and a CD rack, and those two operations made $750 profit each. In all, I made $1000 this month [$750 each from the CD rack and the pastry case plus a loss of $500 on the coffee part of the business] and 75% of that amount came from my pastry case.”

So far so good.

Saying that 75% of the profit came from the pastry case makes it sound like pastries are bringing in almost all the money. But that is not really true. As Ellenberg writes: “It’s just as correct to say that 75% of my profits came from the CD rack. And imagine if I’d lost $1000 more on coffee—then my total profits would be zero, infinity percent of which would be coming from pastry!”

This is a very important concept that needs to be understood. As Ellenberg puts it: “Negative numbers in the mix makes percentages act wonky.”

Now getting back to the employment data. The IT sector added 37,000 jobs, the automobile sector added 20,000 jobs, the metals sector added 1,000 jobs and the textiles sector added 24,000 jobs. In total, these four sectors added 82,000 of the 64,000 jobs. Hence, these three sectors added 130 % of the jobs.

This is an absurd result. And we are getting this absurd result because there are negative numbers in the mix. If jobs were gained in some sectors, they were also lost in certain sectors. In total, 18,000 jobs were lost in leather, gems and jewellery, transport and handloom/powerloom sectors.

Hence, whenever negative numbers are also involved, expressing in terms of percentages is incorrect.

Also, between March 2014 and March 2015, there has been a growth of 5,21,000 jobs with the IT sector adding 2,34,000 jobs. The textiles sector comes in a close second adding 2,21,000 jobs. 18,000 jobs were lost in the leather sector.

Narendra Modi came to power in late May 2014. Hence, the 5,21,000 jobs that have been created are a reflection of the performance of his government.

The question is how many jobs were created between March 2013 and March 2014 when Manmohan Singh was the prime minister and the Congress led United Progressive Alliance was in power. During that period a total of 2,76,000 jobs were created. Hence, Modi’s performance looks much better than that of Singh.

Nevertheless this comes with a caveat. Of the 5,21,000 jobs created between March 2014 and March 2015, the maximum of 1,82,000 jobs were created between April 2014 and June 2014. Manmohan Singh was in power through much of this period. If we were to adjust for this, Singh’s performance looks a little better.

But even with this adjustment Modi’s performance has been better than that of Singh, on this front.

Another point that needs to be made here is that the number of jobs being created since March 2014 has been falling in every quarter. As mentioned earlier, 1,82,000 jobs were added between April and June 2014. The number fell to 1,58,000 jobs between July and September 2014. It fell further to 1,17,000 jobs between October and December 2014. And finally collapsed to 64,000 jobs between January and March 2015.

The initial euphoria around Modi’s election as the prime minister being good for the business as well as the economy is getting wiped out. And this is clearly a reason to worry.

The column originally appeared in The Daily Reckoning on October 28, 2015

‘Dal’onomics 101: Why dal prices have been going up

Toor_Dal_Tur_dal

One of the first things that gets taught in any basic course on economics (or Economics 101) is the substitution effect. This is a scenario where high prices of one commodity pushes consumers into consuming another commodity. If lamb meat prices are too high, consumers move to eating chicken. If coffee prices go up, consumers may move towards drinking the more affordable tea.

In the rational world of theoretical economics this makes tremendous sense. But things are a little different in real life. Take the case of the recent rapid rise in the price of various pulses, tur dal in particular.  The prices recently crossed Rs 200 per kg. The annual increase in price has been more than 100%. In this scenario is the Indian consumer substituting tur dal for something else?

The most logical thing to do would be to consume other pulses like urad, moong, etc. But the prices of other pulses have also risen at a very rapid rate, though not as fast as tur dal. Further, it is also a matter of taste. If the consumer is used to a certain kind of food, it is not so easy to switch to something else overnight.

As economist Subir Gorkarn writes in a recent column in the Business Standard: “Unquestionably, there is some substitution going on between different pulses, but large parts of the country are predominantly tur consumers, while, in others, rising incomes create a long-term, superior-good shift towards tur.”

There have been several media reports talking about how chicken is now cheaper than dal.

It has been jocularly suggested on the social media that chicken being cheaper than dal will lead to regular dal eaters moving to regularly eating chicken. Only if it was as simple as that.

While chicken may be cheaper than dal, it still costs more than Rs 100 per kg and hence, cannot really replace dal as an everyday staple. Dal-chawal or dal-roti is an everyday staple for many Indians. And this cannot be replaced by chicken, unless it starts to cost what dal used to up until a few years back.

Also, it is worth remembering here that dal is a huge source of protein. Further, as incomes go up and people eat better, the demand for food high on protein tends to go up. Data from ministry of agriculture points out that the production of dal has gone up from 14.76 million tonnes in 2007-2008 to 19.77 million tonnes in 2013-2014. In 2014-2015, the total production fell to 17.2 million tonnes. The yield has gone up from 625 kg per hectare in 2007-2008 to 798 kg per hectare in 2013-2014.

Despite an increase in yield as well as production, the troubling point is that the per capita availability of pulses has come down over the long run. A 2014 research report titled India’s Pulses Scenario authored by the National Council of Applied Economics Research (NCAER) points out: “Pulse production has recorded less than one percent annual growth during the past 40 years, which is less than half of the growth rate in Indian human population. Consequently per capita production and availability of pulses in the country has witnessed sharp decline.”

“Per capita net pulse availability has declined from around 60 grams per day in the 1950s to 40 grams in the 1980s and further to around 35 grams per day in 2000s.  However, in the past four years, there has been significant increase in consumption averaging around 50 grams due to somewhat higher production,” the report further points out.

This largely explains why despite an increase in yields as well as overall production, dal prices have gone up over the last few years, with huge spurts in between. How can this be corrected?

A recent newsreport in the Mint points out that a part of the correction has automatically happened through the substitution effect. People are eating more eggs than they were in the past.

Between 1961 and 2013, the per capita availability of eggs has jumped from 7 to 58. At the same time consumption data provided by the National Sample Survey Office suggests “a declining trend in the consumption of pulses—from 11.8 kg per person per year in 1987-88 to 8.4 kg per person per year in 2009-10.”

During the same period “the consumption of eggs went up from 6 per year to 21 per year in rural India and from 17 to 32 in urban areas.”

This is something that the World Health Organisation also suggests when they say: “There is a strong positive relationship between the level of income and the consumption of animal protein, with the consumption of meat, milk and eggs increasing at the expense of staple foods.”

Nevertheless, what about the vegetarians? A significant proportion of Indians are vegetarians and that also needs to be taken into account. They need to eat dal for their protein needs.

The area under production of pulses over the decades has more or less been stagnant. In 1980-1981, the area under production had stood at 22.46 million hectares. This has increased marginally over the years to 24.79 million hectares in 2013-2014. In fact, the number was at 22.09 million hectares in 2008-2009.

The yield in 1980-81 was at 473 kg per hectare. It has since jumped to 798 per kg hectare in 2013-2014. This is an increase of around 1.6% per year. The Indian population has grown at a faster rate.

Further, as the NCAER research report referred to earlier points out: “Most of the increase in pulse production in recent years has been in gram. Low pulse yield in India compared to other counties is attributed to poor spread of improved varieties and technologies, abrupt climatic changes, vulnerability to pests and diseases, and generally declining growth rate of total factor productivity.”

Take the case of tur dal. Between 2007-2008 and 2013-2014, the total production increased from 3.08 million tonnes to 3.34 million tonnes. During the same period the production of gram jumped from 5.75 million tonnes to 9.79 million tonnes. So once one adjusts for the production of gram, the production of other pulses hasn’t gone up by much though their demand has.

A major reason for the area under production of pulses remaining stagnant can be explained the way economic incentives are have been structured for Indian farmers. The incentives are heavily skewed towards production of rice, wheat and sugarcane. And that explains why we have excess stock of these food products.

If prices of pulses are to come down in the years to come, the area under production needs to go up. For that to happen, the economic incentives the way they are currently structured, need to change. And that’s ‘dal’onomics 101 for you.

The column was originally published on Swarajyamag.com on Oct 28, 2015

Why everybody loves credit cards

credit cardRecently I went looking for a new Wi-Fi data card. I quickly decided on what I wanted, and put up the necessary papers required. When I was ready to pay using a debit card, I was told that there would be a 2% charge if I decided to pay using either a credit or a debit card.

This came as a surprise. The merchant clearly was still living in the 1990s.

The merchants used to charge extra on a card payment when credit and debit cards were just getting started in India in the late nineties. This continued in the early noughties as well. This was because banks charged the merchants every time a card holder used a credit or a debit card to make a payment. And merchants did not want to pay that money out of their own pockets.

Over a period of time as cards became popular this changed and no extra payments needed to be made if one decided to pay using a credit or a debit card. What brought about this change? Other than the fact that cards became ubiquitous, with people not wanting to carry cash around everywhere, merchants also realised something else.

And what was that? People end up spending more when they use cards.

This is primarily because cards take out the pain one feels while spending paper money, totally out of the equation. As Nobel Prize winning economists George Akerlof and Robert Shiller write in their book Phishing for Phools—The Economics of Manipulation and Deception: “One of the bases of credit card’s magic is that most of us think that we buy only what we need(or want).” Nevertheless “there is circumstantial evidence that people with credit cards spend more.”

In fact, psychologist Richard Feinberg carried out a series of very interesting experiments to show that just the presence of a credit card as a cue, leads to people spending more. In one of these experiments, people were shown various items on a screen, one at a time, and were asked how much would they pay for each one of them.

As Akerlof and Shiller write about the experiment: “In the presence of a credit card in the corner on the screen…subjects were willing to spend more.”  For a toaster, they were willing to pay $67.33, in the presence of a credit card cue. When there was no credit card in the corner of the screen, they were willing to pay only $21.50. The numbers for a tent were $28.42 in the presence of a credit card and $7.58 in the absence of one.

In fact, this discrepancy was seen in case for all the items that were flashed on the screen. Further, in the presence of a credit card, the decision to buy at a higher price was made much faster.

Given these reasons, it is hardly surprising that merchants have taken to cards, like a fish takes to water. And they are happy to accept cards these days, even if that means paying a fee to the bank, every time they accept a card payment. They have realised that people spend more when they use cards, and this benefits them.

This brings me to another question. Why don’t merchants offer discounts to those paying cash, given that there are no extra costs that they need to pay? As Akerlof and Shiller write: “If people are unknowingly spending more because they are paying by credit card, it would be ill-advised for…the local supermarket to remind their customers that they might, well, get a discount for paying by cash.” What is true for a local supermarket is true for other merchants as well.

This explains why everyone loves credit cards. The customer can spend more money than he has. The merchants can sell more, which is something that the merchant I mention at the beginning of this column, needs to realise. And the bank can collect exorbitant interest on the money that is spent.

The column originally appeared in the Bangalore Mirror on October 28, 2015

(Vivek Kaul is the author of the Easy Money trilogy. He tweets @kaul_vivek)