With rising inventories oil prices are falling, but real estate prices are not: Here’s why

India-Real-Estate-Market
A major reason for the price of crude oil falling has been the accumulation of oil inventories all over the world. Inventories in any commodity are a result of supply being more than demand. The trouble is that in case of oil there is only a limited amount of storage space available and this can lead to rapid decline in price, once the inventories start to build.
As the analysts at
Bank of America-Merrill Lynch point out in a research note dated January 16 and titled Oil price undershoot; Compelling value emerging: “Inventories all over the world are building at a very fast rate. In fact, we have moved up our storage numbers and now expect OECD (Organisation for Economic Co-operation and Development) inventory levels to reach 2,830 million barrels in 2Q15, 180 million barrels above last year.”
Even in the United States, there has been huge build up in oil inventories.
Numbers released by the Energy Information Administration(EIA) of the United States suggest that on January 16, 2015, the oil inventories in the country stood at 397.853 million barrels. Thus the oil inventories “are at the highest level for this time of the year in at least the last 80 years,” the EIA said in the release.
Hence, this huge build up in oil inventories has led to the oil price crashing.
This led to one of the editors at Firstpost to tweet that despite huge inventories in the real estate sector in India, why are prices not falling, like they have in case of oil.
In this piece published on Firstpost I discuss why real estate in India remains unaffordable. One of the tables in the piece shows the huge amount of home inventory in various cities. There are huge amounts of unsold flats which have been built but have not been sold.
A simple straight forward answer too high inventory not leading to falling prices is that there is too much black money in the country. And that black money keeps finding its way into real estate, keeping prices high. An article in The Caravan magazine a few years back captured this point beautifully when it said: “There isn’t a bubble of real homes…If all these apartments were actually built, and built fairly to schedule, I guarantee you that they would find real buyers. The demand is out there. But there is a huge bubble in imaginary homes.”
The reason for this is that the ill-gotten wealth of politicians has been invested in real estate through the “
benami” route over the years. In fact, the government or rather governments (the central government as well as state governments all over India) can do a few basic things to try and reverse the situation.
One straight forward way is to start selling land that they own and push down land prices. The consultancy KPMG in a report titled 
Affordable Housing – A key growth driver in the real estate sector points out: “The government holds substantial amount of urban land under ownership of port trusts, the Railways, the Ministry of Defence, land acquired under the Urban Land (Ceiling and Regulation) Act, the Airports Authority of India and other government departments.”
But this hasn’t happened despite being a very obvious solution primarily because the ill-gotten wealth of politicians is in real estate and any fall in land prices will push down home prices and in the process lead to the value of the “real” wealth of the politicians falling as well.
As 
Bombay First points out in a report titled My Bombay My Dream: “Government and the land mafia in fact do not want more land on the market: after all, you make more money out of the spiralling prices resulting from scarcities than you could out of the hard work that goes into more construction.”
Further, banks are also playing an important role in ensuring that real estate prices continue to remain high. As
India Ratings and Research points out in a recent report FY16 Outlook: Real Estate Sector: “Bank credit to the sector grew by double digits yoy in 2014. This, when coupled with declining sales, indicates bank funding is being used to build up inventory, which may further deteriorate the credit profile of the sector.”
The report further goes on to point out that: “Any fall in property prices will require steps for reduction of land costs, shortening of the approval process and removal of red tape and also pressure from lenders on such companies to liquidate inventory to reduce debt.”
What this means in simple English is that banks need to pressurize real estate companies to repay their loans instead of giving them fresh loans to repay their older loans.

But that is just one part of the story. To understand the other part of the story we need to understand an economic theory called “a market for lemons” put forward by Noble prize winning economist George Akerlof (these days more famous as Mr Janet Yellen). Akerlof wrote a research paper titled
The Market for “Lemons”: Quality Uncertainty and the Market Mechanism in 1970.
In this rather unusual paper Akerlof discussed the second hand car market in the United States. He pointed out that there are essentially four types of cars. “There are new cars
and used cars. There are good cars and bad cars [which in the United States are known as “lemons”]. A new car may be a good car or a lemon, and of course the same is true of used cars.”
An owner of a car has a good idea about whether his car is a good car or a lemon. This leads to what economists call an “information asymmetry”. As Akerlof put it in his research paper: “
After owning a specific car, however, for a length of time, the car owner can form a good idea of the quality of this machine…An asymmetry in available information has developed: for the sellers now have more knowledge about the quality of a car than the buyers.”
This leads to a problem where the buyer of the car has no idea as to how good or bad the car is. Hence, as Akerlof put it: “The bad cars sell at the same price as good cars since it is impossible for a buyer to tell the difference between a good and a bad car; only the seller knows.”
And given that the buyer has no way to differentiate between a good car or a lemon it is ultimately reflected in the price of the car. Tim Harford explains this phenomenon in his book
The Undercover Economist. As he writes: “Anyone who has ever tried to buy a second-hand car will appreciate that Akerlof was on to something. The market doesn’t work nearly as well as it should; second-hand cards tend to be cheap and of poor quality. Sellers with good cars want to hold out for a good price, but because they cannot prove that a good car is really a peach, they cannot get that price and prefer to keep the car for themselves.”
Information asymmetry essentially ensures that the market does not work well. As Nate Silver writes in
The Signal and the Noise –The Art and the Science of Prediction: “In a market plagued by asymmetries of information, the quality of goods will decrease and the market will be dominated by crooked sellers and gullible and desperate buyers.”
If this sentence strikes a chord then you have perhaps been trying to buy a home somewhere in India. The Indian real estate market is totally rigged one way. The information asymmetry totally works in favour of real estate companies, builders and brokers who are a part of this industry.
Something as straightforward as what is the going price of a flat or house in any given area is very difficult to figure out. The only source of information on this are the brokers or the builders themselves. And the world that they live in, real estate prices only go one way and that is up. This helps sustain the myth that real estate prices only go up. Given that there are no other sources of information, people end up believing everything that their broker tells them.
Also, what the buyer does not know is the volume of transactions that have happened at the price being offered by the brokers (This is visible in the miles and miles of built and unsold homes all over the country). So, there is no way of verifying anything. The buyers have no way of figuring out whether deals are actually happening or not and hence, need to either believe the broker or play mind games with him.
As Jeff Madrick writes in
Seven Bad Ideas—How Mainstream Economists Have Damaged America and the World: “Almost all homebuyers…enter into such transactions only two or three times in their lives. How can they possibly be knowledgeable and informed?”
Given these reasons, even with a huge inventory, real estate prices in India are not falling. And this has led to a situation where sales have fallen dramatically. “Sales of fresh residential units (in sq.ft.) by listed real estate companies continued to decline during 2014, falling 25.6% yoy for the 12 months ended September 2014,” the
India Ratings and Research report points out. In fact, this is also reflected in the fall in home loan disburals between April and September 2014.
The question is will home prices fall during the next financial year (i.e. April 2015 to March 2016)? “While economic growth is likely to improve in FY16, property prices might not correct. This could lead to endcustomers postponing purchase decisions,” feel the
India Ratings and Research analysts.

(Vivek Kaul is the author of the Easy Money trilogy. He tweets @kaul_vivek)

The article originally appeared on www.firstpost.com on Jan 30, 2015
The govt needs to think out of the box to finance public investment

Fostering Public Leadership - World Economic Forum - India Economic Summit 2010Vivek Kaul

There is a great belief among economists in the Western world that if emerging market nations increase investments in their countries, global economic growth can be revived. Larry Summers, a former US treasury secretary and a Harvard university economist wrote in an October 2014 column in the Financial Times that “the case for investment applies almost everywhere”.
And given that private investment is slowing down, the government needs to increase public investment seems to be the prevailing view. This becomes even more important with the International Monetary Fund recently deciding to
revise global growth downward by 0.3% in 2015 and 2016 to 3.5% and 3.7% respectively.
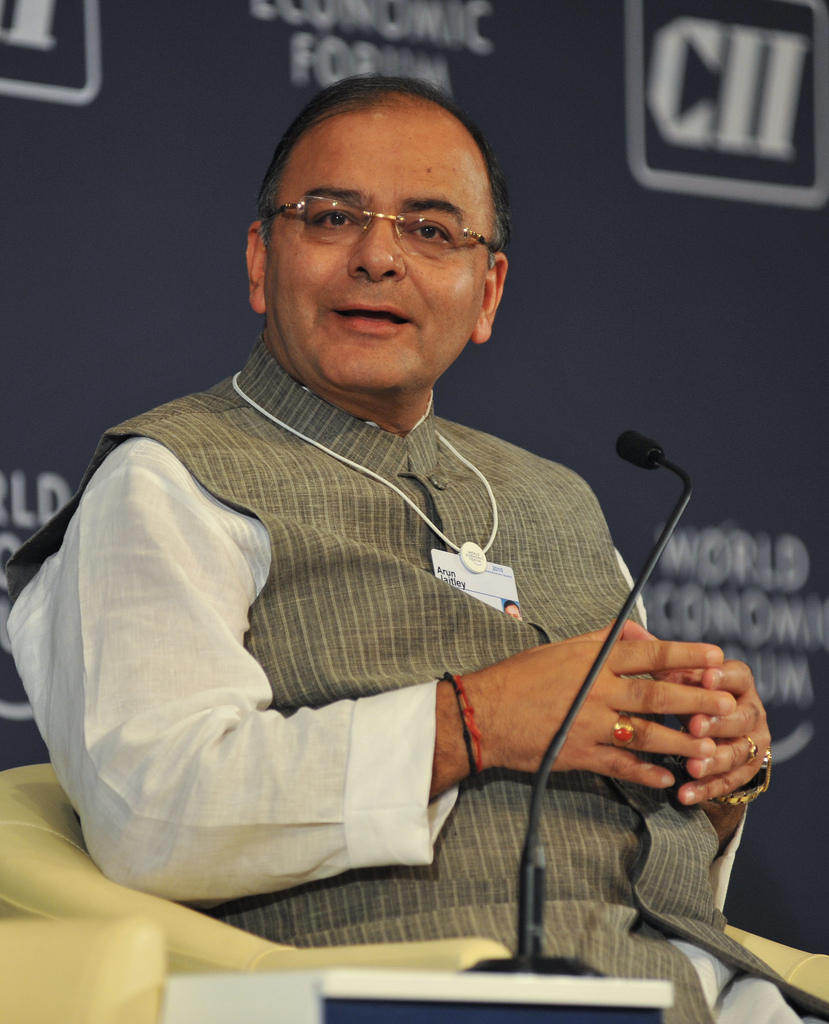
The Indian government seems to be thinking of giving a push to public investment. The finance minister Arun Jaitely
said so a few days back: “I think we have to take some special steps as far as public investments is concerned.” In yesterday’s column I had argued that the government needs to be careful about how it goes about financing the public investment programme that it may unleash in the next budget.
The recent evidence in favour of a public investment programme is not very strong. Many emerging market countries tried increasing public spending in the aftermath of the financial crisis in the hope of creating economic growth, only to see it not work and lead to other major problems.
As Ruchir Sharma author of
Breakout Nations explained in a recent column in the Wall Street Journal: “Before anyone rushes to spend, however, it is worth noting that the big emerging nations, including China, Russia and Brazil just tried a full-throttle experiment in stimulus spending, and it failed. The average growth rate for emerging economies excluding China has fallen to 2.5% today, from more than 7 % at the height of the spending campaign. That is the lowest growth rate in four decades, outside of a global recession. For leaders in these countries, stimulus is now a bad word.” The Chinese growth also recently touched a 24 year low of 7.4%.
So what went wrong? “Emerging nations borrowed from the future to produce that flash of growth in 2010, and now they face the bills. Their government budgets have fallen into the red, from an aggregate surplus equal to 1.5% of GDP in 2007 to a deficit equal to 2% of GDP in 2014. To pay for this deficit spending, public debt has risen significantly, throwing the books out of balance,” wrote Sharma. This is a point that Jaitley in particular and the Indian government in general should keep in mind, before they go on to take “special steps as far as public investments is concerned”.
The rating agencies and the foreign investors are watching India closely after Jaitley said in his maiden budget speech that “my roadmap for fiscal consolidation is a fiscal deficit of 3.6 per cent for 2015-16 and 3 per cent for 2016-17.” In the current financial year the government is aiming for a fiscal deficit of 4.1% of the GDP.
Given this, it is important that the government has a clear idea of how it will go about financing the “special steps” for public investment. One way out is to resort to asset sales. Asset sales does not just refer to the government disinvesting its shares in public sector units as well as other companies.
Take the case of Indian Railways, which owns huge tracts of land all around the country. Some of this land can be sold to generate revenue for revitalization of the Railways. Given the shortage of land in cities, this move can garner a good amount of revenue. Also, it is important to carry out some sort of an exercise which tells the government clearly how much land does the Railways actually own.
Over and above this, the Railways can also look at raising money by branding trains and stations. This is a move that has been tried in the past at least with Mumbai local trains. Also, stations on the Rapid Metro route in Gurgaon are sponsored by corporates. This can be one way of raising some “easy money” for the revitalization of Indian Railways. Also, it is worth pointing out that Railways is not the only department sitting on a huge amount of land.
If the government puts its bureaucrats and advisers to some use, such out of the box ideas will come out. Further, there is some low hanging fruit that the government can easily cash in on. One such low hanging fruit is the shares that the government owns through Specified Undertaking of Unit Trust of India (SUUTI) in ITC and Larsen and Toubro which as of January 28, 2015, were together worth Rs 45,386.86 crore (Rs 32,497.29 crore for ITC and Rs 12,889.57 crore for Larsen and Toubro and based on the shareholding pattern as on December 31, 2014). For reasons which can be best explained only by the government this holding hasn’t been sold till date.
These asset sales can directly finance public investment. As
economist Sajjid Chinoy writes in the Business Standard: “So what the government needs is a predictable plan – say of 0.8-1 per cent of GDP for the next 2-3 years of asset sales that are directly ploughed into public investment such as highways, roads, bridges, ports, airports – to offset the private sector’s inability to finance this infrastructure.”
Further, the government needs to sort out the mess that it has made of the disinvestment programme over the last few years (I mean the government in general and not the Narendra Modi government which took over only in May 2014).
Over the last few years, the government has assumed that disinvestment of its holdings in public sector units will bring in a lot of money. But that hasn’t turned out to be the case. Take the case of the last financial year when it was assumed that the government will raise Rs 54,000 crore through disinvestment. It actually managed to raise only Rs 19,027 crore.
For this financial year, Jaitley has projected that the government will raise Rs 58,425 crore through disinvestment. But only Rs 1,700 crore has been raised so far, with only around a little over eight weeks left for the financial year to end.
News-reports now suggest that the government is really trying hard to push disinvestment through. Instead of waking up at the end of the financial year, the government along with a big disinvestment target also needs to have an annual plan where it goes about disinvesting shares all through the year. This is a better way of approaching the issue and Jaitley should look at it seriously in the next budget.

(The column originally appeared on www.equitymaster.com as a part of The Daily Reckoning, on Jan 29, 2015)

Can Modi govt afford to run a higher fiscal deficit?

narendra_modiIn his maiden budget speech finance minister Arun Jaitley had talked about the government working towards lower fiscal deficits in the years to come. “ My Road map for fiscal consolidation is a fiscal deficit of 3.6 per cent for 2015-16 and 3 per cent for 2016-17,” Jaitley had said in July 2014, when he presented the first annual budget of the Narendra Modi government. Fiscal deficit is the difference between what a government earns and what it spends.
A lot has changed since then. The mainstream view that now seems to be emerging is that the government needs to spend more in the days to come, given that the private sector is not spending as much as it should.
One of the first to advocate this view was Arvind Subramanian, the Chief Economic Adviser to the ministry of finance. In the Mid Year Economic Analysis Subramanian wrote: “Over-indebtedness in the corporate sector with median debt-equity ratios at 70 percent is amongst the highest in the world. The ripples from the corporate sector have extended to the banking sector where restructured assets are estimated at about 11-12 percent of total assets. Displaying risk aversion, the banking sector is increasingly unable and unwilling to lend to the real sector.”
This has led to a situation where banks aren’t interested in lending and corporates aren’t interesting in investing. In order to get around this problem Subramanian suggested that: “it seems imperative to consider the case for reviving public investment as one of the key engines of growth going forward, not to replace private investment but to revive and complement it.”
On the face of it, this make perfect sense. It is being suggested that finance minister Jaitley should give up on the fiscal deficit target of 3.6% of the GDP for 2015-2016 and look to work with a higher fiscal deficit number. The logic offered is straightforward. The public liabilities of the central government(which includes the public debt and other liabilities like external debt reported at current exchange rates and liabilities of the national small savings fund) have been falling over the years.
The public liability in 2008-2009 stood at 48.9% of the GDP. Since then the number has fallen to 45.7% of the GDP in 2014-2015 (estimated). The biggest fall has come under other liabilities which include national small savings fund and the state provident funds. These liabilities have fallen from 9.7% of the GDP to 5.8% of the GDP. The public debt has risen marginally from 39.1% of the GDP in 2008-2009 of the GDP to 39.9% of the GDP in 2014-2015.
On the face of it, the public debt and liability numbers of the central government are in a comfortable range. All in all the simple point is that the government can spend more, run a higher fiscal deficit and look to finance that through higher borrowing.
But these numbers do not take into account the public liabilities and debt of the state governments. How do there numbers look? Article 293(1) of the Indian Constitution empowers the state governments to borrow domestically. The public liabilities of the state governments stood at 26.1% of the GDP in 2008-2009. This has since fallen to 21.4% in 2013-2014. The public debt of the state governments has also fallen from 19.1% of the GDP to 16.1% of the GDP.
The number that one needs to look at is the general government liabilities and not just the central government liabilities. As the latest
Government Debt Status Paper points out: “General government [liabilities] represents the indebtedness of the Government sector (Central and State Governments). This is arrived at by consolidating the debt of the Central Government and the State governments, netting out intergovernmental transactions viz., (i) investment in Treasury Bills by States which represent lending by states to the Centre; and (ii) Centre’s loans to States.”
As can be seen from the accompanying table the general government liabilities were at 70.6% of the GDP in 2008-2009 and have fallen to 65.3% of the GDP in 2013-2014. This fall has primarily come about due to a fall in liabilities of the state governments.


So does this mean that the government can borrow and spend more and in the process run a higher fiscal deficit? The answer is not so straightforward. The latest government debt status paper provides several reasons in favour of India’s debt being sustainable. As it points out: “Government debt portfolio is characterized by favourable sustainability indicators and right profile. Share of short-term debt is within safe limits, although it has risen in recent years. Most of the debt is at fixed interest rates which minimizes volatility on the budget.”
Over and above this most of government debt is domestic in nature and hence, there is no currency risk. “Conventional indicators of debt sustainability, level and cost of debt, indicate that debt profile of government is within sustainable limits, and consistently improving,” the status paper points out.
But does this mean that the government can borrow and spend more without attracting the ire of the international rating agencies which have been following India’s fiscal deficit levels rather closely over the last few years? The thing is that India’s public liabilities and debt cannot be looked at in isolation.
We live in a highly globalized world where economic numbers are constantly being compared. As economist Sajjad Chinoy wrote
in a recent column in the Business Standard: “India’s consolidated fiscal deficit is currently close to 6.5 per cent of GDP, while countries with the same sovereign rating as us have a median and mean deficit of 2.5 per cent of GDP – 400 bps lower! The inflation tax has been chipping away at India’s debt/GDP ratio, but at 65 per cent – it is substantially higher than the 40 per cent debt/GDP ratio of the median country amongst our sovereign ratings peers.”
This is a very important point which most mainstream views on the subject seem to be ignoring. Jaitley in his maiden budget speech had promised a path of fiscal consolidation. If he chooses to abandon it midway this is not likely to go down well with foreign investors as well rating agencies.
Further, it is worth remembering that the Federal Reserve of the United States plans to start raising interest rates sometime this year. This means that a lot of easy money that has come into India and other emerging markets might leave the country.
The last time this happened in May 2013 was when Ben Bernanke, the then Chairman of the Federal Reserve merely hinted at interest rates going up in the future. Back then, a lot of easy money left India (particularly the debt market) and the rupee fell to 69 to a dollar in the process. I am sure the finance minister does not want anything of that sort to happen all over again.
Given this, he should be very careful about how he goes about financing any big public investment programme. In tomorrow’s column I will discuss how Jaitley can look to finance a public investment programme.

The column originally appeared on www.equitymaster.com as a part of The Daily Reckoning on Jan 28, 2015

Markets are not panicking over Greece exiting the Eurozone. Here’s why

greece
In his wonderful book
How to Speak Money John Lanchester defines Grexit as the hypothetical exit of Greece from the Eurozone. Eurozone is a term used referring to countries which use euro as their currency.
As things stand as of now the chances of Grexit may have gone up. Over the weekend,
Alexis Tsipras of the Syriza party took over as the youngest prime minister of Greece. Breaking tradition Tsipras took a civil oath and not a religious one. He has also vowed not to wear a tie until he has negotiated Greece a new deal with Europe, reports the Guardian.
Tsipras and the Syriza party were elected on the plank to
end austerity in Greece and to write off its debt. “We will bring an end to the vicious circle of austerity,” Tsipras told the crowd after his party’s victory in the Greek elections.
Greece had joined the Eurozone on June 19, 2000, In the process it gave up its currency, the drachma. Before the euro was born, interest rates set by the Bundesbank, the German central bank were the benchmark for interest rates of other countries in Europe. Other central banks had to set interest rates accordingly.
Hence, Germany enjoyed the lowest interest rates in Europe. Some of this prestige was rubbed on to the European Central Bank (the central bank formed to manage the euro) and the euro. The countries which used the euro as their currency also started to enjoy low interest rates.
There were two reasons for the same. The first reason was that the weaker countries of the euro zone would no longer be able to print money to pay off their debt like they had done in the past. With the power to print money out of the hands of the government, it was widely expected that inflation would come under control. And with inflationary expectations (or the expectations that consumers have of what future inflation is likely to be) lower, interest rates came down.
The other reason for a fall in interest rates was the fact that the market assumed that in case there was any trouble with the weaker countries in the euro zone, the stronger ones (read Germany) would come to their rescue (which is how things have played out over the last few years).
As Neil Irwin writes in
The Alchemists—Inside the Secret World of Central Bankers: “In 1992, when low-inflation Germany could borrow money for a decade at 8 percent, Greece had to pay 24 percent…Greece gained the credibility of the European Central Bank, which itself was modelled after Germany’s Bundesbank.”
And this “credibility” in a few years ensured that interest rates in Greece were almost the same as they were in Germany. “Investors were willing to hand money over to the Greek government for pretty much the same interest rate they received for giving it to the German or the French governments. In 2007…German ten-year borrowing costs averaged 4.02 percent. Greek rates were 4.29 percent. Investors had become complacent, viewing Greek debt as an essentially risk-free substitute for bonds issued by better run countries like Germany, France of the Netherlands,” writes Irwin.
The Greek government made use of the low interest rates and went on a borrowing binge. The fiscal deficit of the Greek government was under 4% of the GDP In 2001. It went up to 15.7% of the GDP in 2009. The huge fiscal deficit was primarily on account of profligate public spending to finance the Greek welfare state. Fiscal deficit is the difference between what a government borrows and what it spends.
As author Satyajit Das wrote in an essay titled
Nowhere To Run, Nowhere to Hide in July 2010: “Profligate public spending, a large public sector, generous welfare systems, particularly for public servants, low productivity, an inadequate tax base, rampant corruption and successive poor governments created the parlous state of public finances.”
This led to the debt of the Greek government going up big time. When Greece joined the Eurozone in 2000 its government debt was a little over 90% of the GDP. By 2009 it had exploded to 129% of the GDP.
Since then Greece has had to be rescued by a series of bailout programmes involving the European Central Bank, the European Union and the International Monetary Fund. The total bailout amount stands at close to a whopping 240 billion euros or around $270 billion, as per the current exchange rate.
In order to ensure that the Greece government repaid its debt and the bailout amounts it was put on an austerity programme. As Mark Blyth writes in
Austerity—The History of a Dangerous Idea: “Cut spending raise taxes—but cut spending more than you raise taxes—and all will be well, the story went.”
But that did not turn out to be the case. The private sector wasn’t doing well and on top of that government spending also collapsed, leading to the Greek economy crashing. As Blyth writes: “In May 2010, Greece received a 110-billion-euro loan in exchange for a 20 percent cut in public-sector pay, a 10 percent pension cut, and tax increases. The lenders, the so-called troika of the ECB, the European Commission, and the IMF, forecast growth returning by 2012. Instead, unemployment in Greece reached 21 percent in late 2011 and the economy continued to contract.”
And the situation has only gotten worse since then. The current rate of overall unemployment in Greece is at 28% and among the youth it’s over 50%. In fact, the Greek GDP per head has shrunk by 22% since 2008,
reports the BBC. At the same time the Greek government debt has also soared to 176% of GDP by September 2014.
So, clearly the austerity programme wasn’t working and the Greek voters had had enough of it. In this environment the Syriza party came as a breath of fresh air. The rhetoric of the Syriza party and its leader Tsipras has toned down a little in the aftermath of the electoral win but it still remains very strong.
“The new Greek government will be ready to co-operate and negotiate for the first time with our peers a just, mutually beneficial and viable solution,” Tsipras said after winning the Greek election.
This posturing clearly has countries like Germany worried. The BBC reports that the German government spokesman Steffan Seibert said that it was important for Greece to “take measures so that the economic recovery continues”. What Germany is simply telling Greece here is to continue with the austerity programme and continue repaying the debt that it has accumulated over the years.
Tsipras and his party obviously don’t agree with this point of view.
As the Guardian reports: “His [i.e. Tsipras] first act as prime minister was to lay roses at a memorial to 200 Greek communists executed by the Nazis in May 1944. Analysts said the gesture left little room for interpretation: for a nation so humiliated after five years of wrenching austerity-driven recession, it was aimed, squarely, at signalling that it was now ready to stand up to Europe’s paymaster, Germany.”
And this is where the whole thing can snap. Germany wants Greece to continue with the austerity programme. Greece wants to re-negotiate the austerity as well as the total amount of debt that it owes. The question is who will blink first? Will Greece choose to leave the euro first? Will it be asked to leave?
The financial market does not seem to be unduly worried about this as of now.
One explanation that has been offered is that investors are now coming around to believe that the eurozone will emerge stronger if Greece leaves it, to the condition that other countries do not follow it.
But this is too strong an assumption to make. In case of Greece deciding to leave the euro, Greeks will start withdrawing their euros from their banks. This would happen primarily because the new currency (probably drachma in Greece’s case) would be less valuable than the euro. Hence, Greek banks would face bank runs. It would also mean that Greece would most likely default on its debt or repay them in less valuable drachmas. This could even influence the other countries( Portugal, Italy, Ireland, Spain) to do the same. Citizens of these countries expecting their countries to leave the euro would start withdrawing their euros from banks, leading to bank runs in these countries.
Long story short: The situation has become very murky to estimate how things will pan out.

The column originally appeared on www.firstpost.com on Jan 27, 2015

(Vivek Kaul is the author of the Easy Money trilogy. He tweets @kaul_vivek) 

Oil price may touch a new low of $31 per barrel by March 2015

oilVivek Kaul

I wanted to write this column last week but just got a little too involved with the three pieces that I ended up writing on Indian real estate.
As I write this column, the price of brent crude oil is around $48.8 per barrel. This price is expected to fall further over the next two months, for the simple reason that oil inventories all over the world have shot up dramatically.
In a research note titled
How Low Will Oil Price Go and dated January 6, 2015, analysts at Bank of America-Merrill Lynch explain this phenomenon. The question is why do inventories build? “Inventories typically build because supply exceeds demand in any given market. But in some markets like oil or gas, storage capacity is a finite number and price declines can accelerate as inventories build.”
In another research note titled
Oil price undershoot; Compelling value emerging and dated January 16, the Bank of America-Merrill Lynch analysts note that: “Inventories all over the world are building at a very fast rate. In fact, we have moved up our storage numbers and now expect OECD (Organisation for Economic Co-operation and Development) inventory levels to reach 2,830 million barrels in 2Q15, 180 million barrels above last year.”
Interestingly, oil inventory levels in the United States are at an 80 year high for this time of the ear.
Numbers released by the Energy Information Administration(EIA) of the United States on January 16, 2015, shows that oil inventories in the country stood at 397.853 million barrels. Thus the oil inventories “are at the highest level for this time of the year in at least the last 80 years,” the EIA said in the release.
Typically in the past, as supply would increase the Organization of the Petroleum Exporting Countries (OPEC) would cut production and that would prevent a fall in oil price. Nevertheless that hasn’t happened this time around. In fact, Ali al-Naimi, the oil minister of Saudi Arabia,
said in a December interview that:It is not in the interest of Opec producers to cut their production, whatever the price is…Whether it goes down to $20, $40, $50, $60, it is irrelevant.”
The Saudi Arabia led OPEC has essentially been driving down the price of oil to make it unviable for US shale oil firms to keep producing oil. As Niels C. Jensen writes in 
The Absolute Return Letter for January 2015 titled Pie in the Sky: “In effect, OPEC is trying to destroy the economics of this industry, which admittedly requires quite high oil prices to remain profitable. Only 4% of total U.S. shale production breaks even at $80 or higher. A high percentage of the industry breaks even with an oil price in the $55-65 range.”
Due this OPEC oil production has not been cut and oil inventory levels world over have been shooting up. As land-based inventories start to fill up, the oil inventory will move to ships. “In fact, we see floating storage coming into play over the coming months with roughly 55 million barrels building on ships by the end of 2Q15, as land-based inventories across North America, Europe, and Asia fill up. But even floating storage is limited by its very nature. If crude vessels fill up, shipping rates will spike, and that is unlikely to help any oil producer in the world,” write the Bank of America-Merrill Lynch analysts.
Taking all these factors into account the Bank of America-Merrill Lynch analysts predict that by March 31, 2015, the price of brent crude is oil all set to fall to $31 per barrel. The question though is where will oil prices go from there. That is where things get rather interesting and as I have written in the past, it is very difficult to start predicting oil prices in the short term.
The answer to where oil prices are headed in the short=term probably lies in trying to understand how will oil supply shape up in the months to come. The non-OPEC oil suppliers need to cut oil supply by at least one million barrels per day to restore some sort of equilibrium in the oil market. But how good are the chances of something like that happening?
The Bank of America Merrill Lynch analysts point out that the cash cost of non OPEC producers comes at around $40 per barrel and given that oil prices need to stay below that for a while to get them to start cutting supply. “Many producers are well hedged, face very low cash costs, are partially protected by falling domestic currencies or tax breaks, or are notoriously slow to react,” write the analysts.
Oil companies in Brazil need $23 per barrel to cover their cash cost. Russian producers are well protected because of a huge fall in the value of the rouble against the dollar and have cash costs of around $9-15 per barrel. In case of the major oil companies ,the cash costs range anywhere between $20 to $42 per barrel. Only oil produced in the North Sea has an average cost of around $48 per barrel, which is around the current brent crude oil price.
Hence, non OPEC oil can still continue to produce oil for a while, leading to higher inventories. Given this, Saudi Arabia remains the joker in the pack and depending on which way it goes will decide the way oil prices head in the short term.
From the political posturing that Saudi Arabia has indulged in, it looks highly unlikely that OPEC will cut oil production any time soon, even though the country is losing a lot of revenue by keeping the market oversupplied.
As Brahim Razgallah of JP Morgan writes in a research report titled
Saudi 2015 Budget: More than meets the eye and dated January 9, 2015: “All else equal, every $10 per barrel fall in the average oil price widens the fiscal deficit by 4.1%-pts of GDP.” Fiscal deficit is the difference between what a government earns and what it spends.
This deficit is likely to be financed through borrowing. The public debt of Saudi Arabia stands at a rather minuscule 1.9% and hence, it can easily borrow its way out of trouble. Over and above this, the country also has a huge amount of foreign exchange reserves amounting to $734 billion accumulated over the years by selling oil. This money can also be accessed.
Razgallah of JP Morgan believes that: “The 2015 budget deficit will mainly be financed by domestic resources, in our view, with public debt likely to reverse its downtrend from 1.9% of GDP in 2014. We believe the government is unlikely to draw on its external savings (97% of GDP) unless oil price weakness lasts a few years.”
Given this, the way Saudi Arabia behaves in the time to come will decide which way oil-prices head in the short term. And that remains difficult to predict.

(The article originally appeared on www.equitymaster.com as a part of The Daily Reckoning on Jan 27, 2015)