Privatization by Malign Neglect: Nationalized Banks Gave Out Just 6% of Banking Loans in 2020-21

One story that I have closely tracked over the years is the privatization of the Indian banking sector, despite the government continuing to own a majority stake in public sector banks (PSBs). I recently wrote a piece in the Mint newspaper regarding the same.

The moral of the story is that the PSBs have continued to lose market share to the private banks, over the years. This is true of both deposits as well as loans.

In the last decade and a half, when it comes to loans, the share of PSBs in the overall lending carried out by scheduled commercial banks in India  peaked at 75.1% in March 2010. As of March 2021, it had fallen to 56.5%.

When it comes to deposits, during the same period, the share of PSBs in the total deposits raised by scheduled commercial banks peaked at 74.8% in March 2012. As of March 2021, it had fallen to 61.3%. Meanwhile, the private banks had gained share both in loans as well as deposits. (For complete details read the Mint story mentioned earlier).

One feedback on the Mint story was to check for how well PSBs other than the State Bank of India (SBI), the largest PSB and the largest bank in India, have been doing. In this piece, I attempt to do that. Data for this piece has been drawn from the Centre for Monitoring Indian Economy (CMIE) and several investor presentations of SBI. The data takes into account the merger of SBI with its five associate banks as of April 1, 2017.

Let’s take a look at the findings point wise.

1)  Let’s start with the share of different kinds of banks in the overall banking loan pie.

Source: Author calculations on data from the
Centre for Monitoring Indian Economy
and the investor presentations of SBI.

In the last 15 years, the share of SBI in the overall banking loan pie has been more or less constant (look at the blue curve, it seems as straight as a line). It was at 23.1% as of March 2006 and it stood at 22.7% as of March 2021. Clearly, SBI has managed to hold on to its market share in face of tough competition from private banks.

But the same cannot be said of the other PSBs, which are popularly referred to as nationalized banks, given that they were private banks earlier and were nationalized first in 1969 (14 banks) and later in 1980 (six banks).

The share of these banks in the lending pie has fallen from 47.9% in March 2006 to 33.8% in March 2021.

In fact, the fall started from March 2015 on, when the share of the nationalized banks in overall lending had stood at 50.1%. This is when the Reserve Bank of India (RBI) rightly started forcing these banks to recognise their bad loans as bad loans, something they had been avoiding doing since 2011, when the bad loans first started to accumulate. Bad loans are largely loans which haven’t been repaid for a period of 90 days or more.

Not surprisingly, the share of private banks in the banking loan pie has been going up. It is up from 20% to 35.5% in the last 15 years, though a bulk of the gain has come from March 2015 onwards, when the share was at 20.8%. Clearly, the private banks have gained market share at the cost of nationalized banks. As stated earlier, SBI has managed to maintain its market share.

2) Now let’s take a look at the deposit share of different kinds of banks.

Source: Author calculations on data from
the Centre for Monitoring Indian Economy
and the investor presentations of SBI.

The first thing that comes out clearly is that the shape of the curves in this chart are like the earlier chart, telling us that conclusions are likely to be similar.

When it comes to overall banking deposits, the share of SBI has been more or less constant over the last 15 years. It has moved up a little from 23.3% to 23.8%, with very little volatility in between.

For nationalized banks, it has fallen from 48.5% to 37.4%, with a bulk of the fall coming post March 2015, when it had stood at 51%.

The fall in market share of nationalized banks has been captured by private banks, with their share moving up from 19.4% to 29.9% in the last 15 years. Again, a bulk of this gain has come post March 2015, when their market share was at 19.7%. Clearly, as nationalized banks have been trying to put their house back in order, private banks have moved in for the kill and captured market share.

The two charts clearly tell us that the banking scenario in India has been changing post March 2015, but they don’t show us the gravity of the situation.

To do that we need to look at the incremental loans given out by the banks each year and the incremental deposits raised by them during the same year. Up until now we were looking at the overall loans given out by banks and the overall deposits raised by them, at any given point of time.  

3) Let’s take a look at the share that different kinds of banks have had in incremental loans given out every year. Incremental loans are obtained in the following way. The outstanding bank loans of SBI stood at Rs 25 lakh crore as of March 2021. They had stood at around Rs 23.7 lakh crore as of March 2020.

The incremental loans given between March 2020 and March 2021, stood at Rs 1.3 lakh crore. This is how the calculation is carried out for different banks across different years. The number is then divided by the incremental loans given out by scheduled commercial banks, and the market share of different kind of banks is obtained.

In 2020-21, the total incremental loans given by the banks stood at Rs 5.2 lakh crore. Of this, SBI had given out around Rs 1.3 lakh crore and hence, it had a market share of around one-fourth, when it came to incremental loans given by banks.

Source: Author calculations on data from the
Centre for Monitoring Indian Economy
and the investor presentations of SBI.

The above chart tells us is that post March 2015, a bulk of incremental lending has been carried out by private banks. In 2014-15, the private banks carried out by 35.6% of incremental lending. This touched a peak of 79.5% in 2015-16 and their share was at 58.9% in 2020-21, the last financial year.

SBI’s share in incremental lending hasn’t moved around much and it stood at 24.4% in 2020-21.

The real story lies with the nationalized banks. Their share of incremental lending has collapsed from a little over half of the incremental lending in 2013-14 to just 0.2% in 2019-20. In 2020-21, it was slightly better at 6.3%.

These banks have barely carried out any lending in the last five years, with their share being limited to 6.1% of the incremental loans that have been given during the period. SBI’s share stands at 25.3% and that of private banks at 59.9%.

4) Now let’s look at how the share of incremental deposits of different kinds of banks over the years.

Source: Author calculations on data from the
Centre for Monitoring Indian Economy
and the investor presentations of SBI.

This is perhaps the most noisy of all the charts up until now. But even here it is clear that the share of nationalized banks in incremental deposits has come down over the years. It was at 50.9% in 2013-14. In 2017-18, the deposits of nationalized banks saw a contraction of 8.5%, meaning that the total deposits they had went down between March 2017 and March 2018. In 2020-21, their share of incremental deposits stood at 26.3%.

The chart also tells us that in the last six years, the private banks have raised more deposits during each financial year, than SBI and nationalized banks have done on their own.

5) In the following chart, the incremental loan-deposit ratio of banks has been calculated. This is done by taking the incremental loans given by banks during a particular year and dividing it by the incremental deposits raised during the year.

Source: Author calculations on data from the
Centre for Monitoring Indian Economy
and the investor presentations of SBI.

The curve for non SBI PSBs is broken because in 2017-18,
the banks saw a deposit contraction,
and hence, the incremental loan deposit ratio
of that year cannot be calculated.

The incremental loan deposit ratio of nationalized banks collapsed to 0.5% in 2019-20 and 7.4% in 2020-21. What this means is that while these banks continue to raise deposits, they have barely given out any loans over the last two years. In 2019-20, for every Rs 100 rupees they raised as a deposit they gave out 50 paisa as a loan (Yes, you read that right!). In 2020-21, for every Rs 100, they raised as a deposit they gave out Rs 7.4 as a loan.

One reason for this lies in the fact that many of these banks were rightly placed under a prompt corrective action (PCA) framework post 2017 to allow them to handle their bad loan issues.

This placed limits on their ability to lend and borrow. Viral Acharya, who was a deputy governor of the RBI at that point of time, did some plain-speaking in a speech where he explained the true objective of the PCA framework:

“Such action should entail no further growth in deposit base and lending for the worst-capitalized banks. This will ensure a gradual “runoff” of such banks, and encourage deposit migration away from the weakest PSBs to healthier PSBs and private sector banks.”

The idea behind the PCA framework was to drive new business away from the weak banks, give them time to heal and recover, and at the same time ensure they don’t make newer mistakes and in the process minimize the further accumulation of bad loans. This came at the cost of the banks having to go slow on lending.

As I keep saying there is no free lunch in economics. All this happened because these banks did not recognise their bad loans as bad loans between 2011 and 2014, and only did so when they were forced by the RBI mid 2015 onwards.

There is a lesson that we need to learn here. The bad loans of banks will start accumulating again as the post covid stress will lead to and is leading to loan defaults. It is important that banks do not indulge in the same hanky-panky that they did post 2011 and recognise their bad loans as bad loans, as soon as possible.

What banks did between 2011 and 2014, when it comes to bad loans, has already cost the Indian banking sector a close to a decade. The same mistake shouldn’t be made all over again.

Now with many of the nationalized banks out of the PCA framework, their deposit franchises remain intact, nonetheless, they don’t seem to be in the mood to lend or prospective borrowers don’t seem to be in the mood to borrow from these banks, and perhaps find borrowing from private banks, easier and faster.

Of course, one needs to keep in mind the fact that 2020-21 was a pandemic year, and the overall lending remained subdued.

Meanwhile, the private banks keep gaining market share at the cost of the nationalized banks. This means that by the time the government gets around to privatizing some of these banks, if at all it does, their business models are likely to have completely broken down. They will have deposit bases without adequate lending activity. 

The nation shall witness what Ruchir Sharma of Morgan Stanley calls privatization by malign neglect, play out all over again, like it had in the airline sector and the telecom sector, before this.


Amitabh Kant, the Indian Middle Class and their Dream of a Benevolent Autocrat

Dekh tere sansar ki halat kya ho gayi bhagwan,
Kitna badal gaya insaan, kitna badal gaya insaan.

— Kavi Pradeep, C Ramachandra, Kavi Pradeep and IS Johar, in Nastik (1954).

Sometime in late December last year I was part of a panel deliberating on where the Indian economy is headed, at a business school in Mumbai.

Towards the end of the discussion, a fund manager sitting towards my right, offered his final reason on why the so-called India growth story was faltering. He said, India has too much democracy.

The room was full of MBA students, just the kind of audience which laps up reasons like the one offered by the fund manager. As soon as he finished speaking, I explained to the audience why the fund manager was wrong, not just because India and the world need democracy, but also from the point of view of economic growth.

Of course, that wasn’t the first time I had heard the too much democracy argument being made in the context of it holding back India’s economic growth. Over the years, I have seen, friends, family members, random acquaintances and men and women I don’t know, make this argument with panache and great confidence.

It seemed, as if, in their minds, they had a picture of this great leader who would come on a white horse, brandishing his sword, and set everything right. They wanted India to be governed by a benevolent autocrat. 

Given this, it is hardly surprising that Amitabh Kant, the CEO of the NITI Aayog, and one of central government’s top bureaucrats, said yesterday (December 8, 2020): “Tough reforms are very difficult in the Indian context, we are too much of a democracy.”

The thinking here is that given that India is a democracy, decision making takes time and effort and you can’t just push through economic reforms which can lead to economic growth. Getting things done needs a collaborative effort and hence, is deemed to be difficult. Hence, it would be great to have less democracy, making it easier for a strong leader to push economic reforms through.

Of course, the mainstream media has largely ignored Kant’s comment. But this is an important issue and needs to be discussed.

The question is where does the thinking of too much democracy come from.

Some of it is remnant from the emergency era of 1975-1977, when trains used to apparently run on time. Trains not running on time was basically a manifestation of the general frustration of dealing with the so-called Indian system.

The logic being that, with the then prime minister Indira Gandhi keeping democracy on a backseat, it essentially ensured that the system (represented by trains) actually worked well (represented by trains running on time).

In the recent years, too much democracy hurting India’s future economic prospects comes from the economic success of China. China doesn’t have democracy. The Chinese Communist Party governs the country. In fact, there is no difference between the Party and the government.

This essentially has ensured they can push economic growth without any resistance from the opposition, different sections of the society or the citizens themselves for that matter.

China is not the only example of this phenomenon. Countries like South Korea under Park Chung-hee, Taiwan under Chiang Kai-shek and Singapore under Lee Kuan Yew, made rapid economic surges under leaders who can be categorised as benevolent autocrats.

As economist Vijay Joshi said at the 15th LK Jha memorial lecture at the Reserve Bank of India, Mumbai, in December 2017:

“ Fewer than half-a-dozen of the 200-odd countries in the world have achieved super-fast and inclusive growth for two or more decades on the run, and almost all of them were autocracies during their rapid sprints.”

So, history tells us that most super-fast growing countries at different points of time have been autocracies.

Beyond this, there is the so-called India growth story which also leads to the sort of thinking which concludes that too much democracy hurts economic growth. Ravinder Kaur makes this point beautifully in Brand New Nation—Capitalist Dreams and Nationalist Designs in Twenty-First-Century India.

As she writes:

“What is dubbed a growth story in policy-business circles is essentially an enchanting fairy-tale blueprint of economic reforms along with calls of a strong political leader to implement it… After all, capital has always rooted for strong, decisive leaders and centralized governance that can ensure its swift mobility and put the nation’s resources at the disposal of investors.”

A good part of India’s corporate and non-corporate middle class buys into this kind of thinking. They look at themselves as investor-citizens.

This leads to the firm belief that autocracies lead to faster economic growth. Hence, too much democracy is bad for economic growth. Only if India had a stronger leader. QED. Or so goes the thinking.

Dear Reader, this is nothing but very lazy thinking. While, most super-fast growing countries may have been autocracies with a benevolent autocrat at the top, the real question is, are all autocracies with a benevolent autocrat at the top, or at least most of them, super-fast growing countries.

Economist William Easterly makes this point in a research paper titled Benevolent Autocrats. As he writes: “The probability that you are an autocrat IF you are a growth success is 90 percent. This probability seems to influence the discussion in favour of autocrats.”

But that is the wrong question to ask. The question that needs to be asked should be exactly opposite—if a country is governed by an autocrat what are the chances that it will be a growth success? Or as Easterly puts it: “The relevant probability is whether you are a growth success IF you are an autocrat, which is only 10 percent.”

And this is where things get interesting, if we choose to look at data. Ruchir Sharma offers this data in his book The Ten Rules of Successful Nations. Let’s look at this pointwise.

1) In the last three decades, there were 124 cases of a country growing at faster than 5% for a period of ten years. Of these, 64 growth spells came under a democratic regime and 60 under an authoritarian one. Clearly, when it comes to countries growing at a reasonable rate of growth for a period of ten years, democracies do well as well as authoritarian regimes.

2) Let’s up the cut off to an economic growth of 7% or more for a period of ten years. How does the data look in this case? Sharma looked at data of 150 countries going back to 1950. He found 43 cases where a country’s economy grew at an average rate of 7% or more for a period of ten years. Interestingly, 35 of these cases came under authoritarian governments. As mentioned earlier, super-fast growth and autocrats go together. But this just shows one side of things.

3) So, what’s the other side? While super-fast growth in a bulk of cases has happened under authoritarian regimes, so have long economic slumps or economic slowdowns.

As Sharma writes:

“Long slumps are also much more common under authoritarian rule. Since 1950, there have been 138 cases in which, over the course of a full decade, a nation posted an average annual growth rate of less than 3 percent—which feels like a recession in emerging countries. And 100 of those cases unfolded under authoritarian regimes, ranging from Ghana in the 1950s and ’60s to Saudi Arabia and Romania in the 1980s, and Nigeria in the 1990s. The critical flaw of autocracies is this tendency toward extreme, volatile outcomes.”

Also, under authoritarian regimes, economic growth can see wild swings.

So, for every China there is a Zimbabwe as well, which people forget to talk or think about. For every Singapore, there are scores of African dictators who killed thousands of people during their rule and destroyed their respective economies. Hence, while autocracies may lead to super-fast growth, they can also lead to long-term economic stagnation and huge political turmoil.

Also, evidence is clear that steady growth happens best in democracies.

As Sharma writes:

“Together, Sweden, France, Belgium, and Norway have posted only one year of growth faster than 7 percent since 1950. But over that time, these four democracies have all seen their average incomes increase five- to sixfold, to a minimum of more than $30,000, in part because they rarely suffered full years of negative growth.”

Further, if you look at the list of countries with a per-capita income of more than $10,000, all of them are democracies. China, as and when it reaches there, will be the first autocracy, which will make it an exception. An exception, which proves the rule. That is, in the  medium to long-term, democracy and economic growth go hand in hand.

At least, that’s what history and data tell us. But don’t let that come in your way of believing the good story of authoritarian regimes run by benevolent autocrats leading to fast economic growth all the time.

It must be true if you believe in it. I mean, Mr Kant surely does. And so do a whole host of middle class Indian men and women.

India’s Demographic Dividend is Collapsing

indian flag

Sometimes we get accused of being a stuck like a broken record. But then how else does one follow an issue of utmost importance to a nation, without saying the same things over and over again.

A few days back, The Economic Times reported that the Indian Railways had received a record 1.5 crore applications for 90,000 vacancies. This is the highest number of applications that the Railways has ever received. These are vacancies in Group C and Group D categories, with salaries ranging from Rs 18,000 to Rs 60,000.

Of the 90,000 jobs, around 63,000 jobs are in the Group D category, which includes the job of a gangman. Around 26,500 jobs are in the Group C category, which includes jobs of loco pilots and assistant loco pilots.

The last day of the application is March 31, 2018.  “The number could cross even two crore as there’s still a lot of time to file application,” a senior railway ministry official not willing to be identified told The Economic Times.

Around 167 individuals are competing for one job. If the number of applicants goes up to 2 crore, then 222 individuals will compete for one job in the Indian Railways.

This is India’s demographic dividend, competing for a government job, when barely any are going around. Nearly two million people cross the age of 14 every month in India. Potentially, all of them can join the labour force to look for a job. But all of them don’t. Some people continue to study. A bulk of the women do not look for a job. After adjusting for this, and folks leaving the workforce through retirement, nearly a million Indians join the workforce every month i.e. 1.2 crore a year, which is around half the population of Australia and two and a half times, the population of New Zealand.
A recent estimate made by the Centre for Monitoring Indian Economy suggests that in 2017, two million jobs were created for 11.5 million Indians who joined the labour force during the year.

Of course, the Indian Railways example cited earlier is just one example which shows the lack of jobs for the Indian youth entering the workforce every year. A random Google search will tell you that this is not an isolated example. A late January 2018 newsreport in The Times of India points out that, engineers, law graduates and MBAs were among the 2.81 lakh people who applied for 738 peon posts in Madhya Pradesh.

Another newsreport which appeared in The Indian Express in early January 2018 pointed out that at least “129 engineers, 23 lawyers, a chartered accountant and 393 postgraduates in arts were among 12,453 people interviewed for 18 Class IV posts — in this case, for jobs as peons — in the Rajasthan Assembly secretariat.”

Imagine, if 12,453 individuals were interviewed for 18 posts of peon, how many people would have applied in the first place?

Another newsreport in The Telegraph points out that 1,000 people turned up for three data entry posts that the Odisha University of Agriculture and Technology (OUAT) had advertised for. As the newsreport points out: “While the required qualification for the post was graduation with mandatory knowledge of computer, candidates with BTech, MCA and law degrees turned up for the job interview.”

These are not isolated news stories. Such stories have appeared in the media regularly over the last few years. They are the best example of the fact that there aren’t enough jobs going around for India’s youth, the country’s demographic dividend.

As the Fifth Report on Employment and Unemployment points out: “The Unemployment Rate for the persons aged 18-29 years and holding a degree in graduation and above was found to be maximum with 18.4 per cent based on the Usual Principal Status Approach at the All India level.” Also, the Usual Principal Status Approach considers anyone working for a period of 183 days or more during the course of the year, as employed. Hence, a person could be unemployed for 182 days, and still considered to be employed.

In fact, in a recent answer to a question raised in the Lok Sabha, the government basically pointed out that the more educated an individual is in rural India, the more difficult it is to find a job, in India. Take a look at Table 1.

Table 1:

Educational classificationUnemployed
Not literate2.3%
Primary3.3%
Middle/Secondary/ Higher Secondary3.7%
Graduate & above23.8%

Source: http://164.100.47.190/loksabhaquestions/annex/14/AU1385.pdf
As the 12th Five Year Plan (2012-2017) document pointed out: “One hundred and eighty-three million additional income seekers are expected to join the workforce over the next 15 years.” This essentially means that a little over 12 million individuals will keep joining the workforce every year, in the years to come. This works out to around one million a month. And at this rate, the Indian workforce is expected to be larger than that of China by 2030.

And this is India’s demographic dividend. As these individuals enter the workforce, find work, earn money and spend it, the Indian economy is expected to do well. This will put India on the path to faster economic growth, which will eventually pull millions of Indians out of poverty.

The demographic dividend is a period of a few decades in the lifecycle of nation where the working population expands at a faster pace than the overall population. As the working population gets into the workforce, finds a job, starts earning and spends money, all this creates rapid economic growth, which pulls millions of people out of poverty. At least that is how it is supposed to work in theory. In India’s case it isn’t.

How have things been with other countries been in the past? Have countries which were expected to benefit from the demographic dividend benefitted from it?

As Ruchir Sharma writes in his new book The Rise and Fall of Nations—Ten Rules of Change in the Post-Crisis World: “The trick is to avoid falling for the fallacy of the “demographic dividend,” the idea that population growth pays off automatically in rapid economic growth. It pays off only if political leaders create the economic conditions necessary to attract investment and generate jobs.” This has clearly not happened in India, with the investment to GDP ratio constantly falling over the last decade.

Sharma then talks about the Arab world which despite being poised to, did not benefit from a demographic dividend. As Sharma writes: “The Arab world provides a cautionary tale. There between 1985 and 2005 the working age population grew by an average annual rate of more than 3 percent, or nearly twice as face as the rest of the world. But no economic dividend resulted. In the early 2010s many Arab countries suffered from cripplingly high youth unemployment rates; more than 40 percent in Iraq and more than 30 percent in Saudi Arabia, Egypt, and Tunisia, where the violence and chaos of the Arab Spring began.”

So, what is the way out for India? The answer as we have said over and over again in our previous columns, is the export of low-end manufacturing goods. This is something that India has missed out on. As Sharma said in a recent conference: “If you look at the success stories across the world, their key to success was all the same thing which is they all exported their way to prosperity. They exported their way to prosperity by producing low end manufacturing goods. It is low end manufacturing goods where you end up getting a huge amount of employment growth as well.”

Given that India has missed the manufacturing bus, jobs are hard to come by. As Nobel Prize winning economist said in a recent conference: “India’s lack in the manufacturing sector could work against it, as it doesn’t have the jobs essential to sustain the projected growth in demography. You have to find jobs for people.”

All this leaves us with the question, what does the future have for India? Pakodas we guess.

This column originally appeared in Equitymaster on March 19, 2018.

Mr Stiglitz, India’s Obsession with Inflation is Correct

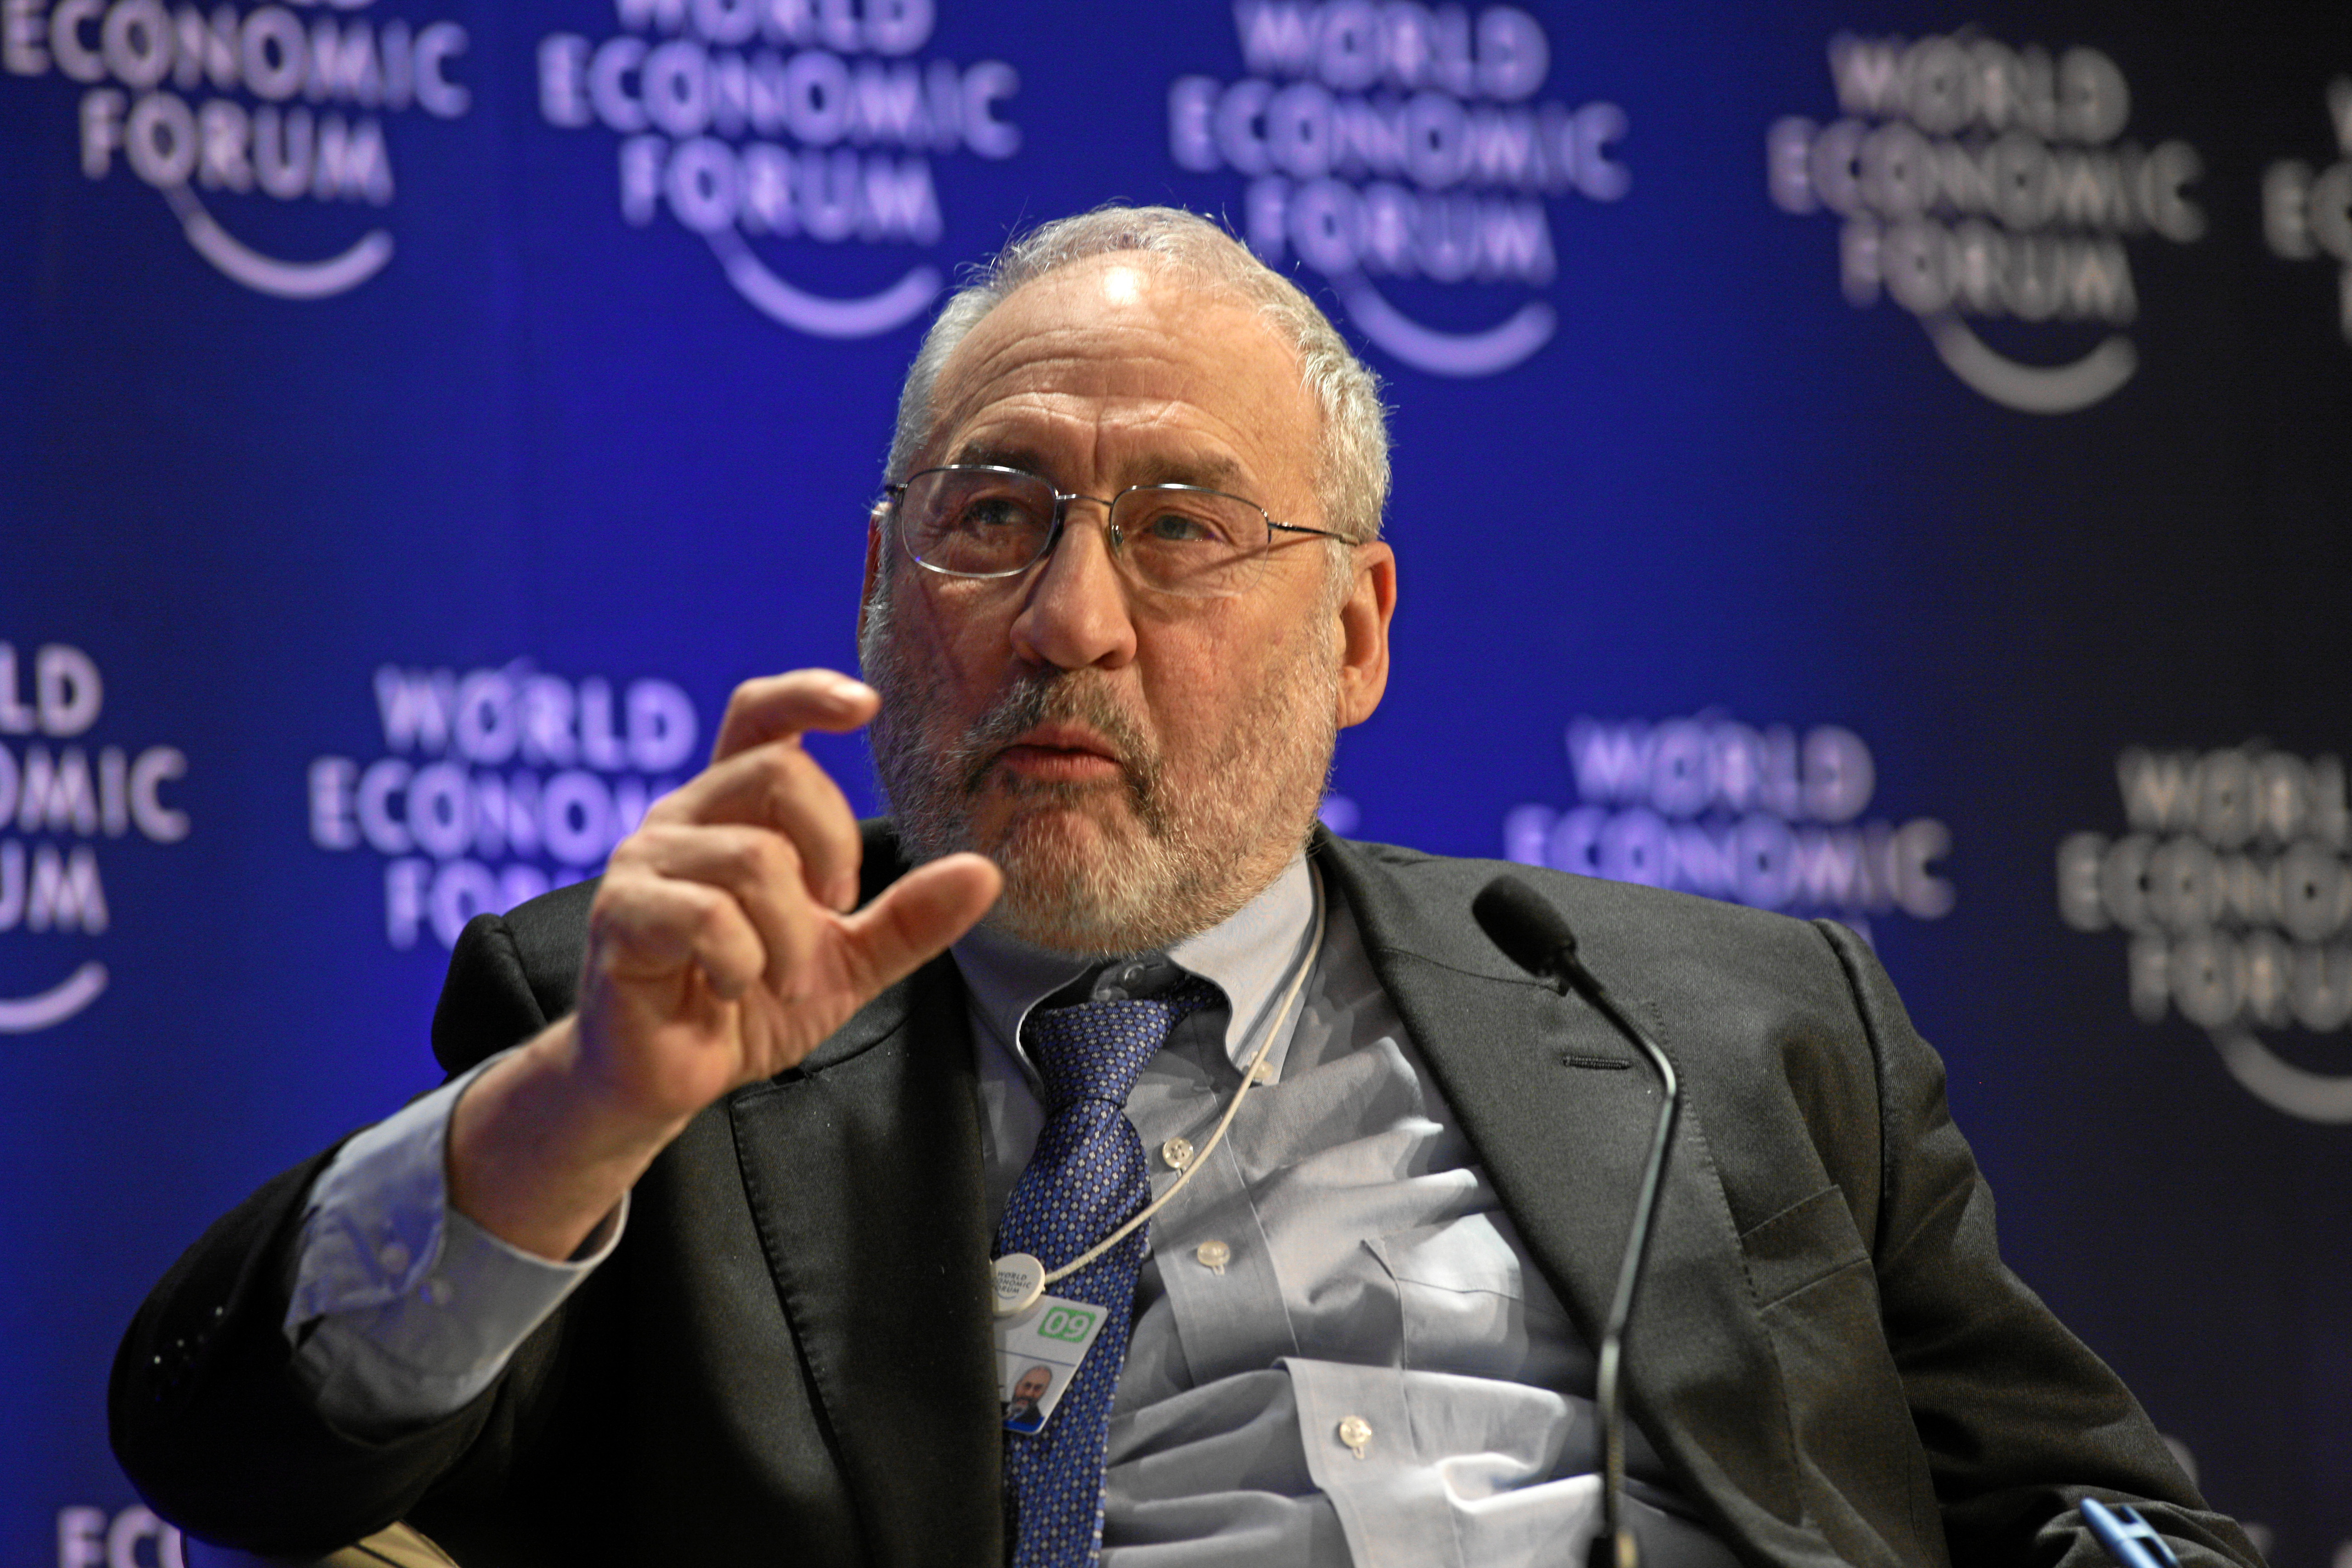
DAVOS-KLOSTERS/SWITZERLAND, 31JAN09 - Joseph E. Stiglitz, Professor, Columbia University, USA, at the Annual Meeting 2009 of the World Economic Forum in Davos, Switzerland, January 31, 2009. Copyright by World Economic Forum swiss-image.ch


Joseph Stiglitz, a Nobel prize winning economist, had some advice for Indian policymakers last week. Speaking in Bangalore, Stiglitz said: “Excessive focus on inflation almost inevitability leads to higher unemployment levels and lower growth and therefore more inequality.”

The point that Stiglitz was making is that the government of India should spend more than it currently plans to. Further, the Reserve Bank of India(RBI) should cut interest rates further and encourage people to borrow and spend more. Of course, all this extra spending will lead to some inflation, with more money chasing the same quantity of goods and services. But that will be a small price to pay for economic growth. This economic growth will lead to lower unemployment and in the process lower inequality.

This is precisely the kind of argument that was made during the Congress led United Progressive Alliance(UPA) regime, to justify the high rate of inflation that prevailed between 2008-2009 and 2013-2014.

The trouble is that there is enough evidence that suggests otherwise. Over the last five to six decades, countries which have grown at a very fast pace, have had very low rates of inflation.

As Ruchir Sharma writes in The Rise and Fall of Nations—Ten Rules of Change in the Post-Crisis World: “The miracle economies like South Korea, Taiwan, Singapore, and China, which saw booms, lasting three decades or more, rarely saw inflation accelerate to a pace faster than the emerging market average. Singapore’s boom lasted from 1961 to 2002, and during that period inflation averaged less than 3 percent.”

The same is the case with China. As Sharma puts it: “In China, the double digit GDP growth of the last thirty years was accompanied by an average inflation of around 5 percent, including an average rate of around 2 percent over the decade ending in 2010. China saw a brief surge in inflation in 2011, and economic growth in the People’s Republic has been slumping steadily since then.

The point is very clear, inflation is not good for economic growth. There is enough evidence going around to show that. The same can be said in the Indian case as well, when the inflation surged between 2008-2009 and 2013-2014. It ultimately led to economic growth collapsing.

YearInflation (in %)Economic Growth (in %)
2007-20086.29.32
2008-20099.16.72
2009-201012.378.59
2010-201110.458.91
2011-20128.396.69
2012-201310.444.47
2013-20149.684.74


In 2007-2008, inflation was at 6.2 per cent and the economic growth came in at 9.32 per cent. In the aftermath of the financial crisis that started in 2008-2009, the union government increased its expenditure in the hope of ensuring that the economic growth did not collapse.

The government expenditure budgeted for 2008-2009 was at Rs 7,50,884 crore. The final expenditure for the year was at Rs 8,83,956 crore, which was around 17.8 per cent higher. The expansive fiscal policy led to inflation, which in turn led to lower economic growth in the years to come.

The increased government spending led to high inflation in the years 2009-2010 and 2010-2011, but at the same time it also ensured that economic growth continued to stay strong in the aftermath of the financial crisis. Nevertheless, high inflation ultimately caught up with economic growth and it fell below 5 per cent during 2012-2013 and 2013-2014.

The point being that extra spending and lower interest rates leading to inflation might help bump up economic growth in the short-term, but over the longer term it clearly does not help. What made the situation even worse was that RBI did not get around to raising interest rates as fast as it should have.

As Vijay Joshi writes in India’s Long Road—The Search for Prosperity: “Since fiscal policy was expansive, the job of demand-side inflation control was left to the RBI. Given the strength of both demand and cost-push forces, monetary policy would have had to be tough to be effective. Put bluntly, the RBI muffed it. It took a softly-softly approach to raising interest rates. While this may perhaps have been understandable because it feared hurting investment and growth, it is surely no surprise that inflation proved to be persistent.”

High inflation also leads to a situation where the household financial savings fall. This is precisely how things played out in India. Between 2005-2006 and 2007-2008, the average rate of household financial savings stood at 11.6 per cent of the GDP. In 2009-2010, it rose to 12 per cent of GDP. By 2011-2012, it had fallen to 7 per cent of the GDP. In 2014-2015, the ratio had improved a little to 7.5 per cent of GDP.


Household financial savings is essentially a term used to refer to the money invested by individuals in fixed deposits, small savings schemes of India Post, mutual funds, shares, insurance, provident and pension funds, etc. A major part of household financial savings in India is held in the form of bank fixed deposits and post office small savings schemes.

A fall in household financial savings happened because the real rate of return on deposits entered negative territory due to high inflation.


This led to a situation where savers have moved their savings away from deposits and into gold and real estate. As RBI governor Raghuram Rajan said in a June 2016 speech: In the last decade, savers have experienced negative real rates over extended periods as CPI has exceeded deposit interest rates. This means that whatever interest they get has been more than wiped out by the erosion in their principal’s purchasing power due to inflation. Savers intuitively understand this, and had been shifting to investing in real assets like gold and real estate, and away from financial assets like deposits.”

If a programme like Make in India has to take off, low household financial savings cannot be possibly a good thing. This hasn’t created much problem in the recent past, simply because bank lending to industry has simply collapsed. Banks (in particular public sector banks) are not interested in lending to industry because industry has been responsible for a major portion of bad loans in the last few years.

But sooner or later, this situation is going to change. And then the low household financial savings ratio, will have a negative impact and push interest rates up. In this scenario, it is important that inflation continues to be under control and the real rates of return on deposits continue to be in positive territory. That is the only way, the household financial savings ratio is likely to go up.

As Joshi puts it: “In today’s world of low inflation, India’s long-run inflation target should certainly be no higher than 4 or 5 per cent a year.” And that is something both the RBI as well as the union government should work towards achieving and maintaining.

The column originally appeared in Vivek Kaul’s Diary on July 12, 2016

Of Venkaiah Naidu, Air India and Privatisation by Malign Neglect

VenkaiahNaidu

Yesterday afternoon something weird happened on Twitter.

An irate flyer sent out four tweets against Air India. No it wasn’t me. Here are the four tweets:

1) I had to travel to Hyderabad by Air India AI544 which is to depart at 1315 Hrs… was told on time…reached airport by 1230 Hrs.

2) was informed at 1315hrs that flight was delayed as d pilot had not yet come.Waited up to 1345 Hrs, boarding didn’t start. returned 2 home.

3) Air India should explain how such things are happening. Transparency and accountability are the need of the hour.

4) Hope Air India understands that we are in the age of competition. Missed an important appointment.

The tweets were sent out by senior BJP politician and the Union Minister for Urban Development, Housing & Urban Poverty Alleviation as well as Parliamentary Affairs, M Venkaiah Naidu. Naidu is a heavy weight in the Modi government. The fact that he took to Twitter to criticise the government owned airline means he must have been extremely irritated by the airline’s failure to depart on time.

Air India replied in true government style saying that the pilot was stuck in a traffic jam and an enquiry had been ordered. (I wonder why pilots of other airlines do not get stuck in traffic jams?)

Minister Naidu got a feel of what happens when people travel Air India. This is a good thing where the politicians and the bureaucrats get a feel of how the system they help build and run, actually works.

As Reserve Bank of India governor Raghuram Rajan, had said in a speech sometime back: “A lot of officials, including myself, learn the difficulties of working in India as an ‘aam aadmi’ only once we leave office, lose the assistant, the assistant to the assistant, and the assistant to the assistant’s assistant. Post retirement, and I have seen this with all the people I know, they realise the system is much harder to deal with.”

It was Naidu’s opportunity yesterday to have that kind of day. The sad part is that those who run Air India still don’t get it. The airline has managed to accumulate huge losses over the years and continues to survive on borrowing as well as equity infusion by the government (i.e. basically the taxpayer).

Anyone in their right mind, stopped traveling Air India a while back. The airline now runs simply because of government employees who when travelling officially have no other option (in most cases) but to travel in the airline and pay the full fare.

The airline now has 14.7 per cent market share. This has been a huge fall from the days when it had 100% of the domestic market share given that no private airlines were allowed to operate. (The domestic airline back then was called Indian Airlines. There was also Vayudoot, another government owned airline, which travelled to smaller locations).

This is nothing but what Ruchir Sharma calls privatization by benign neglect. As he writes in his new book The Rise and Fall of Nations—Ten Rules of Change in the Post-Crisis World: “India…has adopted a de facto policy of what I can only describe as privatization by malign neglect. The political class can’t bring itself to sell off the old state companies, or to reform them either. Instead, it simply watches as private companies slowly drive the state behemoths into irrelevance. Thirty years ago state-owned Air India was basically the only way for Indians to fly, but the rise of agile private airlines including Jet and Indigo, has reduced its share of flights to less than 25 percent.” As mentioned earlier Air India now has 14.7% of the domestic market share.

The business flyer who is willing to pay a premium and for whom time is of utmost importance, has more or less abandoned Air India and moved on to other airlines. Guess, it’s time that minister Naidu also does that, the next time he has to reach on time for any meeting outside Delhi.

Air India is not the only example of the government not being able to withstand competition. Sector after sector has seen the government companies being decimated wherever they have had to face competition. As Sharma writes: “The same goes for telecommunications, where former state monopolies like MTNL and BSNL have been allowed to slowly wither in the face of more nimble private telecom companies, and together they now account for less than 30 million of India’s 900 million telecom subscribers.”

But the government (this government as well as the ones before it) have kept these companies going. Of course, a lot of taxpayer money which could have been better utilised elsewhere has been lost in the process. Air India has lost close to Rs 35,000 crore between 2010-2011 and 2015-2016. Last year it managed to make an operational profit primarily because of lower oil prices.

The point being that it would have been better for the government to have sold off these companies long back. As Sharma writes: “The state would have done a lot better to simply sell of these companies when they were still valuable, but now it is losing money on them hand over fist, and they are worth a pittance. This approach—refusing either to privatize or protect state monopolies—is the worst possible combination for government’s finances.”

And that is precisely what the previous governments did. The Narendra Modi government continues to run on the same principle. One doesn’t expect radical decisions from a government which couldn’t even push through a five basis points interest rate cut on the Employees Provident Fund(EPF). One basis point is one hundredth of a percentage.

The airline business is a very tough and competitive business to be in. Any airline hoping to make a profit needs to be run by a professional who has some experience in the airline business. Air India has never had that luck for a sustained period of time. No such moves have been made by the current government either. This belief that bureaucrats and not specialists, can do everything, has been one of the primary reasons behind the degradation of India.

In fact, Air India has now reached a stage where even if the government were to try selling it, there would be no buyers. As civil aviation minister Ashok Gajapati Raju said sometime back: “Its (Air India) books are so bad. I don’t think that even if it is offered, anybody would come for it.”

The more things change the more they remain the same. The taxpayer will continue paying for this national loot.

The column originally appeared in Vivek Kaul’s Diary on June 29, 2016