Will Chinese Jobs Come to India?

china

One of the themes that I have regularly explored in the Diary is the fact that one million individuals are entering the workforce every month and there aren’t enough jobs going around for them. This basically means that around 12 million or 1.2 crore youth enter the Indian workforce, every year.

And how many jobs are available for them? As a recent newsreport in the Business Word magazine points out: “According to the Labour Bureau of India, only 1.35 lakh jobs were created in 2015 and 4.93 lakh in 2014 across eight sectors.” Hence, there are barely any jobs being created for those entering the workforce.

Given the fact that so many individuals are entering the workforce every year, India needs a large burst of economic activity in labour intensive sectors which can employ India’s largely low-skill, semi-skilled and unskilled workforce. Only then will the country be able to put its so called demographic dividend to good use.

So, which are these labour intensive sectors that have the potential to employ India’s burgeoning workforce? The apparel sector and the leather and footwear sector are two such sectors. As the Economic Survey of 2016-2017 points out: “The data show that the apparel sector is the most labour-intensive, followed by footwear. Apparels are 80-fold more labour-intensive than autos and 240-fold more jobs than steel. The comparable numbers for leather goods are 33 and 100, respectively. Note that these attributes apply to the apparel not the textile sector and to leather goods and footwear not necessarily to tanning.”

Take a look at Figure 1.

Figure 1: Jobs to Investment Ratio for Select Industries

Figure 1 tells us that the apparel sector creates close to 24 jobs per lakh of investment. For a similar investment, the steel sector creates almost no jobs. On the other hand, the leather and footwear sector create around seven jobs per lakh of investment. Hence, these sectors have a great potential to create jobs, given that they don’t need a lot of investment to create jobs. Also, they have a huge potential to create jobs for women.

As mentioned earlier, it is estimated that nearly one million Indians are entering the workforce every month. This number is based on the assumption of a very low female labour participation rate. The men make up for a bulk of the Indian workforce, with women forming a small part.

Nevertheless, the thing is that more and more women are likely to join the workforce in the years to come. And if that turns out to be true, then the estimate of one million Indians entering the workforce every month, will turn out to be an underestimate. In this scenario, if the sectors like apparel and leather and footwear expand, they are likely to create the required jobs.

Over and above this, as the Economic Survey points out: “The opportunity created for women implies that these sectors could be vehicles for social transformation… In Bangladesh, female education, total fertility rates, and women’s labour force participation moved positively due to the expansion of the apparel sector.”

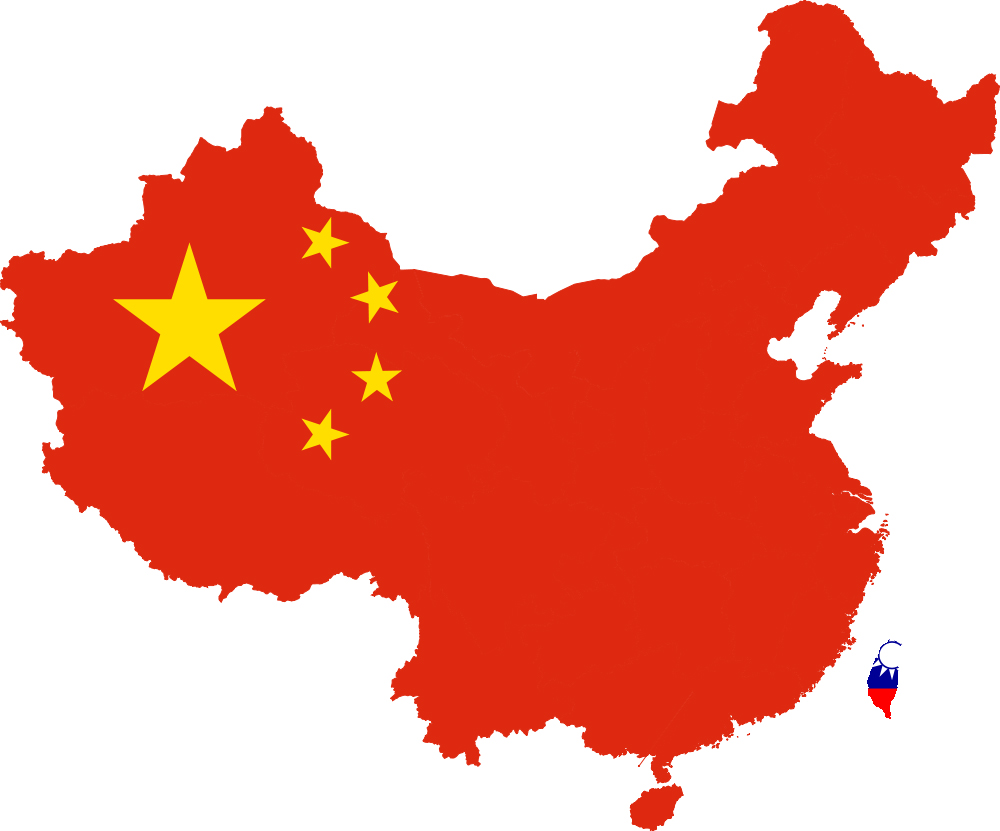
The interesting thing is that there is an immediate opportunity here. In the last two decades, China has seen an explosion of economic growth. In this scenario, the per capita income in the country has gone up many times over. In 1995, the per-capita income had stood at $610 (current US $, World Bank data). By 2015, this had exploded more than 13 times to $8,028.

This tells us that the labour costs in China have gone up. Some of the goods that it used to produce earlier, and on which a lot of economic prosperity was built, it is no longer competitive in. As far as labour cost goes, India is well -positioned to cash in on this. If labour cost was the only concern, businesses which produce apparel, leather and footwear, should have been moving their manufacturing from China to India.

This becomes clear from Figure 2. The minimum wages for semi-skilled labour in most Indian states are lower than Vietnam, China and Indonesia. Despite this, the space being vacated by China is not being taken over by India.

Figure 2: Minimum Wages for semi-skilled workers

As the Economic Survey points out: “The space vacated by China is fast being taken over by Bangladesh and Vietnam in case of apparels; Vietnam and Indonesia in case of leather and footwear. Indian apparel and leather firms are relocating to Bangladesh, Vietnam, Myanmar, and even Ethiopia.”

If India firms are leaving India and setting up apparel and leather firms in other countries, it is not surprising that the space being vacated in China is moving to other countries and not India.

This is a point I make in my new book India’s Big Government-The Intrusive State and How It is Hurting Us: “In fact, if we look at the cost factor, India has the second lowest manufacturing cost (Indonesia is lower) among the top 25 exporting countries in the world. Nevertheless, it is important to realise here that companies set up a manufacturing base in China not just because of the low cost, but also because of the very good infrastructure that was available. And such an infrastructure is clearly not available in India right now. Indeed, almost all countries in East Asia offer an easier working environment than what is available in India.”

Hence, when it comes to capturing the space being vacated by China, two major factors are holding India back, logistics and labour laws. India’s labour laws essentially ensure that Indian firms continue to remain small and in the process they lack economies of scale to compete internationally.

As the Economic Survey points out: “One symptom of labour market problems is that Indian apparel and leather firms are smaller compared to firms in say China, Bangladesh and Vietnam. An estimated 78 per cent of firms in India employ less than 50 workers with 10 per cent employing more than 500. In China, the comparable numbers are about 15 per cent and 28 per cent respectively.”

Take a look at Figure 3. It shows the logistic costs of different countries. India comes right at the bottom. In fact, the logistics cost of India and Vietnam is the same. Nevertheless, it takes lesser time to deliver stuff from Vietnam to the US East Coast, than it takes from India. This works in favour of Vietnam.

Figure 3:To conclude, the window of opportunity to capture the space being vacated by China is narrowing. And India needs to get its act right quickly, if it wants to capture the space being vacated.

The column was originally published on Equitymaster on February 22, 2017

Will Donald Trump Unravel the Global Ponzi Scheme?

donald_trump_by_gage_skidmore_2
In the third volume of the Easy Money trilogy which was published in 2015, I discuss how global trade has degenerated into a Ponzi scheme.

As I write in the book: “The United States is the biggest economy in the world. It accounts for nearly one-fourth of the world’s GDP. By virtue of this, it is also the world’s biggest market, where China, Japan, and countries from South-East Asia could sell their goods and earn dollars in the process. It is also the world’s biggest consumer of oil and consumes nearly a fourth of the global oil production. This meant that oil-rich states like Saudi Arabia could sell oil to it and thus earn dollars in the process.

So, the United States imported, and countries like China, Japan, Saudi Arabia, and other countries in Asia earned dollars in the process. These dollars were then invested in treasury bonds… as well as the private sector. With so much money chasing these American financial securities, the issuers of these securities could in turn offer low rates of interest on them.

This meant that the prevailing interest rate scenario in the United States remained low despite a high budget deficit. This allowed citizens to borrow money at low interest rates and buy homes. It also allowed them to encash the equity in their homes and spend it on consuming other goods. So, the Americans could buy cars from Japan, apparel and electronics from China and so on.

And so the cycle worked. The United States shopped, China earned, China invested back in the United States, the United States borrowed, the United States spent, China earned again and China lent money again. The same was true with Japan, though to a lesser extent.

The way this entire arrangement evolved had the structure of a Ponzi scheme. A Ponzi scheme is essentially a financial fraud wherein the money that is due to older investors is repaid by raising fresh money from newer investors. The scheme keeps running while the money brought in by the new investors is greater than the money that needs to be repaid to the older investors. The moment this reverses, the scheme collapses.

The entire US-China-Japan arrangement was like that. The Chinese invested money in various kinds of American financial securities, which helped keep interest rates low in the United States. This helped Americans to consume more. The money found its way back into China (like a return on a Ponzi scheme) and was invested again in various kinds of American financial securities, again helping keep interest rates low and the consumption going. Like in a Ponzi scheme, the dollars earned by China and other countries kept coming back to the United States. This arrangement… kept interest rates low.”

What the American President Donald Trump proposes to do threatens this global Ponzi scheme. Before we come to the specifics of this, let’s take a look at Figure 1. It shows the trade deficit that the United States has run with China, over the last three decades.

The trade balance is essentially the difference between the imports and the exports of any country. If the trade balance of a country is in negative territory, it is said to run a trade deficit, which the United States does. Specifically, the United States runs a trade deficit with China i.e., it’s imports from China are significantly greater than its exports to China. Also, over the last three decades the trade deficit that United States has run with China has exploded.

Figure 1: 

Take a look at Figure 2. It shows the trade deficit that the United States has run with the world at large, over the last three decades.

Figure 2:The Figure 2 shows that the trade deficit that the United States runs with the world at large has fallen in the aftermath of the financial crisis. This essentially means that the difference between what the United States is importing from the world and what it is exporting to the world, has come down.

Now take a look at Figure 3. It basically combines Figure 1 And Figure 2. What does it tell us?

Figure 3:It tells us that the trade deficit that the United States runs with China, makes up for a greater proportion of the overall trade deficit, than it did before. In 2015, the trade deficit with China made up for 73.4 per cent of the overall trade deficit. In comparison, in 2000, the figure was just at 22.5 per cent.

Given that the United States runs a trade deficit with China as well as the world, countries earn dollars from it. These dollars then find their way back into the United States and get invested in financial securities and in the process help keep interest rates low in the United States.

The new American President Donald Trump, who took over earlier this month, wants to bring down this trade deficit that the United States runs with China in particular and the world in general. As I had discussed in the column dated January 23, 2017, this is one of the plans that Trump has, to make the United States of America great again.

As Peter Navarro, an economist known to be close to Trump, and who served as a policy advisor to the Trump campaign, puts it: “Trump proposes eliminating America’s $500 billion trade deficit through a combination of increased exports and reduced imports.” The trade deficit of the United States in 2015 stood at $500.4 billion.

So how does Trump plan to bring down imports? As his website puts it: “[He plans to direct] the Secretary of Commerce to identify every violation of trade agreements a foreign country is currently using to harm our workers, and also direct all appropriate agencies to use every tool under American and international law to end these abuses.”

Trump also plans to: a) Instruct the Treasury Secretary to label China a currency manipulator. b) Instruct the U.S. Trade Representative to bring trade cases against China, both in this country and at the WTO. China’s unfair subsidy behaviour is prohibited by the terms of its entrance to the WTO. c) Use every lawful presidential power to remedy trade disputes if China does not stop its illegal activities, including its theft of American trade secrets – including the application of tariffs consistent with Section 201 and 301 of the Trade Act of 1974 and Section 232 of the Trade Expansion Act of 1962. (Source: https://www.donaldjtrump.com/policies/trade)

Trump plans to impose import duties (i.e., tariffs) in order to ensure that the cheap Chinese imports into the United States, no longer remain cheap. CNN reported in late December 2016: “President-elect Donald Trump’s transition team is discussing a proposal to impose tariffs as high as 10% on imports, according to multiple sources.”

The question is why does Trump want to do this? I will just come to that.

On a recent visit to Baltimore I had the pleasure of listening to the famous economist Richard Duncan. Duncan’s book The Dollar Crisis has had a tremendous impact on the way I looked at the international financial crisis, in my Easy Money books. As Duncan put it: “President-elect Trump [Duncan was talking before Trump took over as President] believes the US trade deficit has been responsible for the loss of manufacturing jobs in the United States and the downward pressure on US wages that has occurred over the last several decades.”

The question is what will be the repercussions if Trump and his associates do go about doing what they have proposed. My sense is it will lead to the unravelling of the global Ponzi scheme, which I talk about at the beginning of this piece. And in the process, nobody will be better off.

In fact, take a look at Figure 4, which maps America’s imports and exports since 1990.

Figure 4:One look at Figure 4 tells us that the import curve and the export curve closely map each other. What does that tell us? It tells us that the dollars earned by the countries which export goods and services to the United States (essentially imports for the United States), are used to buy goods and services being exported by the United States. As Duncan puts it: “Over the past 35 years, that deficit has become THE driver of global economic growth. In fact, the entire global economy has been constructed around unbalanced trade.” So, what will happen if Trump makes it difficult for the United States to import stuff from China and other parts of the world, as he has promised to do? If the American imports come down, so will its exports primarily because other countries won’t have the dollars required to import stuff from the United States. Also, with both imports as well as exports shrinking, the American trade deficit may not shrink.

Nevertheless, a fall in American imports would mean a fall in global demand and in the process the global economy will shrink. As Duncan puts it: “At this point, the attempt to eliminate the US trade deficit could very easily cause the global economy to collapse into a new Great Depression.” Things could go particularly bad for China. In 2015, the United States ran a trade deficit of $367.2 billion with China. This meant a trade deficit of around a billion dollars per day.

As Duncan puts it: “If the US eliminates its $1 billion a day trade deficit with China, China’s economy could collapse into a depression that would severely impact all of China’s trading partners, and potentially lead to social instability within China and to military conflict between China, its neighbors and the US.”

Further, eliminating imports from low-wage countries would mean that the consumer price inflation will rise in the United States. This will lead to higher interest rates.

We live in a world, where easy money available at low interest rates from the United States, has been invested in financial markets all over the world. And if interest rates start rising in the United States, it won’t be good news for financial markets all over the world.

The column originally appeared on www.equitymaster.com on January 31, 2017.

Why Trump’s Plan to Make America Great Again Will Not Take-off

donald trump

Donald Trump was sworn in as the 45th President of the United States on January 20, 2017. One Trump plan to make America great again is to reduce the American trade deficit.

The trade balance is essentially the difference between the imports and the exports of any country. If the trade balance of a country is in negative territory, it is said to run a trade deficit, which the United States does.

Take a look Figure 1. It plots the American exports and imports from 1960 onwards.

Figure 1:US import and Export Chart 

Up until the early 1980s, the American imports were more or less equal to American exports. But things changed after that and America started running a trade deficit. Take a look at Figure 2. This plots the American imports and exports from 1980 onwards.

Figure 2:US import and Export Chart 

In fact, take a look at Figure 3, which maps America’s imports and exports since 1990.

Figure 3:US import and Export Chart 

One look at Figure 3 tells us that the import curve and the export curve closely map each other. What does that tell us? It tells us that the dollars earned by the countries which export goods and services to the United States (essentially imports for the United States), are used to buy goods and services being exported by the United States.

Hence, there is a clear link between the total imports and the total exports of the United States. So where does that leave Trump’s plan? As Peter Navarro, an economist known to be close to Trump, and who served as a policy advisor to the Trump campaign, puts it: “Trump proposes eliminating America’s $500 billion trade deficit through a combination of increased exports and reduced imports.” The trade deficit of the United States in 2015 stood at $500.4 billion.

So how does Trump plan to bring down imports? As his website puts it: “[He plans to direct] the Secretary of Commerce to identify every violation of trade agreements a foreign country is currently using to harm our workers, and also direct all appropriate agencies to use every tool under American and international law to end these abuses.”

Trump also plans to: a) Instruct the Treasury Secretary to label China a currency manipulator. b) Instruct the U.S. Trade Representative to bring trade cases against China, both in this country and at the WTO. China’s unfair subsidy behaviour is prohibited by the terms of its entrance to the WTO. c) Use every lawful presidential power to remedy trade disputes if China does not stop its illegal activities, including its theft of American trade secrets – including the application of tariffs consistent with Section 201 and 301 of the Trade Act of 1974 and Section 232 of the Trade Expansion Act of 1962. (Source: https://www.donaldjtrump.com/policies/trade)

Trump plans to impose import duties (i.e., tariffs) in order to ensure that the cheap Chinese imports into the United States, no longer remain cheap. CNN reported in late December 2016: “President-elect Donald Trump’s transition team is discussing a proposal to impose tariffs as high as 10% on imports, according to multiple sources.”

This is not going to be so straightforward. If Chinese imports into the United States become expensive, the consumer price inflation in the United States is likely to go up, given that American citizens will have to buy more expensive American products. Also, a clamp down on imports in general and Chinese imports in particular, will lead to countries earning fewer dollars. This means that they will have fewer dollars to imports goods and services from the United States. Hence, a fall in US imports will also lead to a fall in US exports. Hence, the trade deficit may not differ much from its current levels.

Over and above this, if the United States imposes import duties other countries can do the same. This will impact US exports as well. Hence, it is important to understand there is a positive correlation between US imports and US exports. While the US maybe the global bully, China isn’t exactly a pushover.

There is another point that needs to be made here. A huge portion of the dollars earned by countries by exporting goods to the United States and other parts of the world, has made its way back into financial securities issued in the United States. This includes US government bonds. This money has been one of the reasons which has kept interest rates low in the United States.

As of end of November 2016, foreign investors held $5.94 trillion worth of US government bonds (or treasuries as they are better known as). Of this China held close to $1.05 trillion worth of bonds. The point being that if US pushes its luck too far with China, China always has the option of dumping these bonds and pushing up bonds yields and in the process interest rates in the United States. While, it may never come around to doing so, it still has the option. And the United States understands this. Hence, bullying China won’t be easy.

Where does all this leave us? It brings us to that term post-truth. The term post-truth politics has been used quite a lot in the recent past, with the rise of Donald Trump in the United States. It was first used by the blogger David Roberts in 2010.

As Emma Kilheeney writes in Politics e-Review edition for October 2016: “Roberts coined the term to describe a situation in the US Congress where the Republican Party made no attempt to win support for its policy decisions by providing evidence-based arguments. Instead, it opposed all policies put forward by the Democratic Party in order to exploit the emotional responses and loyalties of its followers.”

The Economist defines post-truth as “a reliance on assertions that “feel true” but have no basis in fact.” Hence, the assertion that Trump will decrease US imports and increase US exports may feel to be true, it has no basis in logic and facts.

(The column was originally published on Equitymaster on January 23, 2017)

The Income of the Average Indian is Significantly Lower Than the Average Income of India

ARTS RAJAN

The speeches made by the Reserve Bank of India(RBI) governor, Raghuram Rajan, are always a pleasure to read. In his latest speech made on April 20, 2016, Rajan said: “India is the fastest growing large country in the world, though with manufacturing capacity utilization low at 70% and agricultural growth slow following two bad monsoons, our potential is undoubtedly higher. Growth, however, is just one measure of performance. The level of per capita GDP is also important. We are still one of the poorest large countries in the world on a per capita basis, and have a long way to go before we reasonably address the concerns of each one of our citizens.”

Rajan further said: “We are often compared with China. But the Chinese economy, which was smaller than ours in the 1960s, is now five times our size at market exchange rates. The average Chinese citizen is over four times richer than the average Indian. The sobering thought is we have a long way to go before we can claim we have arrived.”

The point that Rajan was trying to make was that: “As a central banker who has to be pragmatic, I cannot get euphoric if India is the fastest growing large economy…The central and state governments have been creating a platform for strong and sustainable growth, and I am confident the payoffs are on their way, but until we have stayed on this path for some time, I remain cautious.”

This was essentially a retort to politicians who keep tom-tomming India’s dodgy economic growth numbers. While Rajan did not say that he does not believe in the economic growth numbers, he did try and make it clear that if India needs to reach anywhere, it needs strong and sustainable economic growth in the years to come. And achieving that is easier said than done.

Further, Rajan also made a more important point in his speech about India’s low per capita income. What is per capita income? John Lanchester defines per capita income in his book How To Speak Money as: “The total Gross Domestic Product(GDP) of a country divided by the number of people in the country.

As he further writes: “It is a measure of how rich the country’s citizens are on average – though it is a very rough measure of that, since a country’s WEALTH is often very unevenly distributed.”

The phrase to mark in the above paragraph is on average. The question is does an average always represent the right scenario? As Robert H Frank writes in Success and Luck—Good Fortune and the Myth of Meritocracy: “It is of course possible for most people to have a trait the measures higher than the corresponding mean value for the population to which they belong. Since a small number of people have fewer than two legs and no one has more, for instance, the average number of legs in any population is slightly less than two. So most people actually do have “more legs than average”.”

How does the above paragraph apply in the context of the GDP? What it tells us is that the average income of India is not equal to the income of the average Indian. Now what does that actually mean?

Let me explain that through an example. Let’s say on a given day in the city of Mumbai, an Ambani, an Adnani, a Birla and a Tata, walk into a local Udupi restaurant in Matunga. The restaurant is known for its soft idlis and fabulous coffee. And this has attracted the four industrialists to this small place.

The moment these four walk into the restaurant, the average income of the people seated in the restaurant goes up by leaps and bounds. If I may rephrase the last sentence, the per capita income of the restaurant goes up leaps and bounds, when the four industrialists walk into the Udupi restaurant.

But this increase in per capita income of the restaurant will have no impact on the incomes of the other people seated in the restaurant. (This example is essentially an adaptation of an example Charles Wheelan uses in his book Naked Statistics).

As Charles Wheelan writes in Naked Statistics: “The mean, or average, turns out to have some problems in that regard, namely, that it is prone to distortion by “outliers”, which are observations farther from the center.”

So basically, the Ambanis, Adnanis, Birlas and Tatas, of the world, essentially India’s rich, push up the average income of India i.e. the per capita income. As Wheelan writes: “The average income…could be heavily skewed by the megarich.”

In this scenario, the average income does not give us a correct picture. Further, it is safe to say, that the income of the average Indian is lower than the average income of India.

At this point it is important to introduce another term i.e. the median. As Wheelan writes: “The median is the point that divides a distribution in half, meaning that half of the observation lie above the median and half lie below.

Hence, the median income is the income of the average Indian. Given this, the median income is the right representation of the income of the average Indian. This is because the rich outliers (the Ambanis, the Adnanis, the Tatas and the Birlas) are taken into account. Data from World Bank shows that the top 10% of India’s population makes 30% of the total income. And this pushes up the per capita income.

The trouble is that it is not so easy to find median income data in the Indian context. A survey carried out by Gallup in December 2013, put India’s median income at $616. Data from the World Bank shows that India’s per capita income during the same year was $1455.
Hence, the median income was around 58% lower than the average income or the per capita income. And that is not a good sign at all.

This shows the tremendous amount of inequality prevalent in the country. The difference in the income of the average Indian and the average income of India is thus huge. In fact, I had written about this inequality in the column published on April 19.

In 2015-2016, the average income of those not working in agriculture was 4.9 times those working in agriculture (using GDP at current prices). If we were to use GDP at constant prices (at 2011-2012 prices), the ratio comes to 5.5. Constant prices essentially adjust for inflation.

And this is really a big worry!

The column originally appeared on the Vivek Kaul’s Diary on April 25, 2016

The United States is Helping China Buy Gold

gold

In June 2015, China declared having bought 604.34 tonnes of gold. It’s last declaration before this had come in April 2009, when it had declared to having bought 454 tonnes of gold.

It couldn’t have bought such a huge amount of gold all at once given the limited supply of the yellow metal. Between April 2009 and June 2015, China regularly bought gold. It only declared it all at once in June 2015. The country had followed a similar strategy before April 2009, as well. It had last declared having bought 99.5 tonnes of gold in December 2002.

Hence, even though China has been buying gold all along, it has chosen to do so quietly, instead of going public with it. The reason for this was fairly straightforward. Gold is a thinly traded commodity, and hence, it makes sense for China to keep accumulating gold at a slow and regular pace, without making its intentions public and driving up the price.

Having said that since June 2015, there has been a change in strategy. Between July 2015 and February 2016 (the latest data that is available) the country has been making monthly declarations of the purchases it has been making.

These purchases vary from a minimum of 9.95 tonnes in February 2016 to a maximum of 20.84 tonnes in November 2016. Officially, China now has 1,788.4 tonnes of gold. It is the sixth largest gold owner in the world.


Tonnes% of reserves**
1United States8,133.575.3%
2Germany3,381.069.0%
3IMF2,814.0 
4Italy2,451.868.3%
5France2,435.663.2%
6China1,788.42.2%
7Russia1,447.015.1%
8Switzerland1,040.06.8%
9Japan765.22.4%
10Netherlands612.559.4%
11India557.76.2%

Source: www.gold.org

While in absolute terms 1,788.4 tonnes of gold sounds quite a lot, when it comes to gold as a percentage of reserves, the country still needs to catch up with other countries. As can be seen from the above table, China’s gold hoard as a percentage of its reserves is the lowest among the top eleven hoarders of gold.

While officially China may have 1,788.4 tonnes of gold, experts who are in the know of such things, suggest, that China has more gold than it is currently showing.

As James Rickards writes in The New Case for Gold: “The most interesting case is China…We know from various reliable sources including mining production and import statistics that their actual gold stock is close to 4000 tonnes. I’ve spoken to refineries and secure logistics firms—people who actually handle physical gold—in addition to official sources, and included their information in my estimates. On the whole, there is enough credible information available to support this estimate at a minimum. It is also entirely possible that China has considerably more than 4000 tonnes.”

So what this means is that the Chinese government’s real gold hoard is at least 2.2 times its official one.

In fact, Rickards in his book The Death of Money explains how China has gone about accumulating gold over the years. The country buys gold through secret agents based out of London. These agents are known to be very disciplined, and they buy gold whenever the gold price falls significantly. The gold these agents buy is paid for by the State Administration for Foreign Exchange (SAFE), one of China’s sovereign wealth funds.

The gold bought by SAFE is later transferred to the People’s Bank of China, the Chinese central bank. China also buys gold from mines directly. During April to June 2013, when the price of gold had reached a low of $1,200 per ounce, the country bought 600 tonnes of gold directly from Australia’s Perth Mint.

Also, China is now the largest producer of gold in the world. The disadvantage with China’s gold production is that it does not really have any big gold mines and a lot of gold that it produces comes as a by-product in the mining of other base metals. The Chinese government buys gold from the mines within China but does not report these buys. These reasons also explain why China’s gold hoard is actually significantly bigger than what it is telling the world.

In fact, China’s gold hoard maybe more than 4000 tonnes because Rickards seems to have made this estimate in July 2015, when China’s official gold hoard was at 1,658 tonnes. Since then, the number has officially risen to 1,788.4 tonnes.

The question is why is China buying gold? As Rickards explains in The New Case for Gold: “China’s acquisition of more than three thousand tonnes of gold in the past seven years represents almost 10 percent of all the official gold in the world…China is trying to acquire enough gold so that when the international monetary collapse comes and the world has to recut the deal, China will have a prime seat at the table. Countries like Canada, Australia, and the United Kingdom, with small gold-to-GDP ratios will be seated away from the table.”

Currently, the global financial system revolves around the dollar. Given that so much of it has been printed (or rather created digitally) in the last few years, there is the threat of the current financial system collapsing due to high inflation.

When the time for the new financial system comes around, China wants to be in the driver’s seat along with the United States, Germany and Russia, countries which have a significant amount of gold.

It needs to be mentioned here that China owns a significant amount of US treasury securities. These are bonds issued by the US government to finance its fiscal deficit or the difference between what it earns and what it spends. As of end February 2016, China owned $1.25 trillion of the total $6 trillion worth of treasury securities owned by foreign investors.

As I mentioned earlier, the United States has printed a huge amount of dollars over the last few years. This has led to a situation where the chances of a high inflation scenario remain. If something like this were to happen, then the value of the Chinese investment in US treasury securities will fall.

Hence, there is a quid pro quo which is currently at work. As Rickards writes: “The compromise between the Fed’s desire for inflation and China’s desire to protect its reserves is for China to buy cheap gold. That way, if inflation is low, China’s gold won’t go up much, but the value of its paper Treasury reserves is preserved. If the United States gets the inflation it wants, China’s Treasuries will be worth less, yet its gold will be worth much more. Having Treasuries and gold is a hedged position that protects China’s wealth.”

As Ricakrds further points out: “What remains is a strange condominium of interests where the [American] Treasury and China are in agreement that China needs more gold and the price cannot be too high or else China could not easily afford all it needs…The United States is letting China manipulate the market so China can buy gold more cheaply. The Fed occasionally manipulates the market as well so that any price rise isn’t disorderly.”

The question is when will this manipulation end?

The column was published on the Vivek Kaul Diary on April 22, 2016