The Problem With Rs 10 Coin

Indian_ten_rupee_coin_(2008_Reverse)

It costs Rs 60 to cross the Bandra-Worli sealink in Mumbai. If you pay for this using a Rs 100 note, chances are you will get four Rs 10 coins in return, as change. These coins tend to make the wallet a little heavy, hence, whenever I order food, I tend to tip the delivery boy using these coins. At least, I used to do this, until very recently.

Whenever I tipped the delivery boy using Rs 10 coins, I got a weird look back. This happened multiple times, until I came up with an explanation for it. Coins just don’t feel like money earned. They feel more like small change. Paper notes feel more like money. And this I thought led to the weird look from the delivery boys.

Last week I was in Visakhapatnam and was simply roaming around the city, until I saw a paanipuri (also referred to as phuchka, golgappa etc., in different parts of the country) stall. I ordered one plate of paanipuri and handed over a Rs 10 coin to the stall owner. He refused to take it and asked me to give him a Rs 10 note.

While, people had refused to take torn notes before, nobody had ever refused a coin.

This was the first time. I got talking to the stall owner and tried telling him that the coin was issued by the government and there is no reason he should be refusing it.
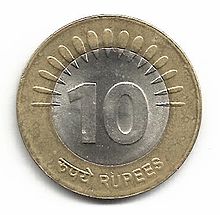
He told me that many Rs 10 coins were nakli (counterfeited) and hence, people don’t take them. Anyway, I handed him a Rs 10 note and walked back to my hotel.

As I was walking back, I wondered, why would anyone in their right mind, take the risk of counterfeiting a Rs 10 coin. Given the risk involved, it just did not make any economic sense. If anyone wanted to counterfeit, it simply made sense to counterfeit the highest denomination note, which happens to be the Rs 2,000 note.

On the social media, I was told that many people believe that Rs 10 coins are counterfeited and hence, they refuse to accept it. It seems, the ministry of finance, which is in charge of minting coins, has introduced Rs 10 coins of different designs. Like there are Rs 10 coins with the rupee symbol as well as without the rupee symbol. This has created the confusion among people.

This also brings us to a more important point regarding fiat money. In an earlier era, money used to have a value on its own. Metals like gold, silver, copper and iron, were money at different points of time in history. So, were agri-commodities like rice, salt and tobacco. In fact, tobacco was money in large parts of United States, longer than gold was.

This started to change around the time of the First World War. Since then the world has gradually moved towards paper money, or a form of money which the government decrees as money, which includes coins as well. A Rs 10 coin has a value of Rs 10 because the government says so. If you were to melt it and sell the metal(s) it is made of, you will not end up recovering Rs 10.

But at the same time, the government decreeing a coin to have a value of Rs 10, is just not enough. People should also be ready to accept it.

As Charles Wheelan writes in Naked Economics—Undressing the Dismal Science: “Rational people refuse legal tender because they believe that it might not be accepted by someone else…The whole bizarre phenomenon underscores the fact that our faith in paper currency [coin in this particular case] is predicated on the faith that others place in the same paper.”

Hence, in order to restore this confidence it is important that the government and the Reserve Bank of India, communicate regularly on this issue, and tell the people that all is well with the Rs 10 coin.

The column originally appeared in the Bangalore Mirror on October 18, 2017.


The Income of the Average Indian is Significantly Lower Than the Average Income of India

ARTS RAJAN

The speeches made by the Reserve Bank of India(RBI) governor, Raghuram Rajan, are always a pleasure to read. In his latest speech made on April 20, 2016, Rajan said: “India is the fastest growing large country in the world, though with manufacturing capacity utilization low at 70% and agricultural growth slow following two bad monsoons, our potential is undoubtedly higher. Growth, however, is just one measure of performance. The level of per capita GDP is also important. We are still one of the poorest large countries in the world on a per capita basis, and have a long way to go before we reasonably address the concerns of each one of our citizens.”

Rajan further said: “We are often compared with China. But the Chinese economy, which was smaller than ours in the 1960s, is now five times our size at market exchange rates. The average Chinese citizen is over four times richer than the average Indian. The sobering thought is we have a long way to go before we can claim we have arrived.”

The point that Rajan was trying to make was that: “As a central banker who has to be pragmatic, I cannot get euphoric if India is the fastest growing large economy…The central and state governments have been creating a platform for strong and sustainable growth, and I am confident the payoffs are on their way, but until we have stayed on this path for some time, I remain cautious.”

This was essentially a retort to politicians who keep tom-tomming India’s dodgy economic growth numbers. While Rajan did not say that he does not believe in the economic growth numbers, he did try and make it clear that if India needs to reach anywhere, it needs strong and sustainable economic growth in the years to come. And achieving that is easier said than done.

Further, Rajan also made a more important point in his speech about India’s low per capita income. What is per capita income? John Lanchester defines per capita income in his book How To Speak Money as: “The total Gross Domestic Product(GDP) of a country divided by the number of people in the country.

As he further writes: “It is a measure of how rich the country’s citizens are on average – though it is a very rough measure of that, since a country’s WEALTH is often very unevenly distributed.”

The phrase to mark in the above paragraph is on average. The question is does an average always represent the right scenario? As Robert H Frank writes in Success and Luck—Good Fortune and the Myth of Meritocracy: “It is of course possible for most people to have a trait the measures higher than the corresponding mean value for the population to which they belong. Since a small number of people have fewer than two legs and no one has more, for instance, the average number of legs in any population is slightly less than two. So most people actually do have “more legs than average”.”

How does the above paragraph apply in the context of the GDP? What it tells us is that the average income of India is not equal to the income of the average Indian. Now what does that actually mean?

Let me explain that through an example. Let’s say on a given day in the city of Mumbai, an Ambani, an Adnani, a Birla and a Tata, walk into a local Udupi restaurant in Matunga. The restaurant is known for its soft idlis and fabulous coffee. And this has attracted the four industrialists to this small place.

The moment these four walk into the restaurant, the average income of the people seated in the restaurant goes up by leaps and bounds. If I may rephrase the last sentence, the per capita income of the restaurant goes up leaps and bounds, when the four industrialists walk into the Udupi restaurant.

But this increase in per capita income of the restaurant will have no impact on the incomes of the other people seated in the restaurant. (This example is essentially an adaptation of an example Charles Wheelan uses in his book Naked Statistics).

As Charles Wheelan writes in Naked Statistics: “The mean, or average, turns out to have some problems in that regard, namely, that it is prone to distortion by “outliers”, which are observations farther from the center.”

So basically, the Ambanis, Adnanis, Birlas and Tatas, of the world, essentially India’s rich, push up the average income of India i.e. the per capita income. As Wheelan writes: “The average income…could be heavily skewed by the megarich.”

In this scenario, the average income does not give us a correct picture. Further, it is safe to say, that the income of the average Indian is lower than the average income of India.

At this point it is important to introduce another term i.e. the median. As Wheelan writes: “The median is the point that divides a distribution in half, meaning that half of the observation lie above the median and half lie below.

Hence, the median income is the income of the average Indian. Given this, the median income is the right representation of the income of the average Indian. This is because the rich outliers (the Ambanis, the Adnanis, the Tatas and the Birlas) are taken into account. Data from World Bank shows that the top 10% of India’s population makes 30% of the total income. And this pushes up the per capita income.

The trouble is that it is not so easy to find median income data in the Indian context. A survey carried out by Gallup in December 2013, put India’s median income at $616. Data from the World Bank shows that India’s per capita income during the same year was $1455.
Hence, the median income was around 58% lower than the average income or the per capita income. And that is not a good sign at all.

This shows the tremendous amount of inequality prevalent in the country. The difference in the income of the average Indian and the average income of India is thus huge. In fact, I had written about this inequality in the column published on April 19.

In 2015-2016, the average income of those not working in agriculture was 4.9 times those working in agriculture (using GDP at current prices). If we were to use GDP at constant prices (at 2011-2012 prices), the ratio comes to 5.5. Constant prices essentially adjust for inflation.

And this is really a big worry!

The column originally appeared on the Vivek Kaul’s Diary on April 25, 2016

What Happens When Bill Gates Walks Into a Bar

Bill_Gates_June_2015

The mathematician John Allen Paulos in his book Beyond Numeracy writes: “The fourth-grader notes that half the adults in the world are men and half are women and concludes therefrom that the average adult has one breast and one testicle.”

This is a rather extreme example of how the concept of mean or average is misused. An average of X numbers is obtained by adding those numbers and dividing it by X.

Here is another example of a situation where the concept of average is misused.  As Charles Wheelan writes in Naked Statistics—Stripping the Dread from the Data: “Imagine that ten guys are sitting on bar stools in a middle-class drinking establishment…each of these guys earns $35,000 a year, which makes the mean annual income for the group $35,000.”

The software billionaire, Bill Gates, walks into this bar. As Wheelan writes: “Let’s assume for the sake of the example that Bill Gates has an annual income of $1 billion. When Bill sits down on the eleventh bar stool, the mean annual income for the bar patrons rises to about $91 million. Obviously none of the original ten drinkers is any richer. If I were to describe the patrons of this bar as having an average annual income of $91 million, the statement would be both statistically correct and grossly misleading.”

The point being that the average or the mean of a given set of numbers can be very misleading. One thing that clearly comes out of this example is that the majority of the numbers that constitute an average can be lower than the average.

As was clear in this example, ten out of 11 men in the bar had a lower income than the average income of $91 million. Here is another interesting example. As Robert Matthews writes in Chancing It—The Laws of Chance and How They Can Work for You: “The world’s men provide an excellent example – in the shape of their penises. Or, to be more precise, size: according research, the average length is 13.24 centimetres, but the median value is 13.00 centimetres.”

And what is median value? As Paulos writes: “The median of a set of numbers is the middle number in the set.” Let’s go back to the bar example for a moment. Let’s say the eleven individuals in the bar are made to sit in the ascending order of their income. The individual setting on the sixth stool will represent the median income of the group.

Now let’s get back to the penis example. The average length of a man’s penis is 13.24 centimetres. But the median value is 13 centimetres. What does this mean? As Matthews writes: “First, it shows that the global distribution of penis sizes is skewed towards smaller values, and second that most men really do have below-average-sized penises.”

This becomes very important when we are discussing issues like per capita income of a country or the average income earned by a citizen of a country.
The economic health of a nation is also judged by the rise in its per capita income. But should that always be the case? Take the Indian case. A survey carried out by Gallup in December 2013, put India’s median income at $616. Data from the World Bank shows that India’s per capita income during the same year was $1455.

Hence, the median income was around 58% lower than the average income or the per capita income. And that is not a good sign at all. The difference is obviously because the rich (Bill Gates in the example) make substantially more than the poor and drive up the average income. Data from World Bank shows that the top 10% of India’s population makes 30% of the total income.

The point being that economic growth as measured by growth in per capita income is not always the correct way of going about things. Is this growth really trickling down? And that can only become clear if the median income is going up. The tragedy is that no regular data is available on this front.

(Vivek Kaul is the author of the Easy Money trilogy. He can be reached at [email protected])

The column originally appeared in the Bangalore Mirror on April 13, 2016

Of salary increments and percentage tricks

discount-10


It is that time of the year when the annual salary increments are due. While one looked forward to the increments between 2002 and 2008, since the start of the financial crisis in September 2008, the annual salary increment has been slow and steady. And this of course has led to a lot of heartburn. Nevertheless, companies cannot increase salaries at a rate which is faster than the rate of increase in their profit. In fact, I have even worked for an organisation where the salary was cut during the course of the year.

Between 2008 and 2013, when the rate of inflation was higher than 10%, the annual increments were lower than that in many cases. Hence, in the strictest sense of the term, the ‘real’ salary was actually going down.

Let’s try and understand this point through an example. Let’s say the rate of inflation is at 10%. Hence, the increment in salary also needs to be 10% in order to ensure that the actually purchasing power of the salary continues to remain the same. Any increment of lower than 10%, actually means that the purchasing power of the salary is actually going down.

If the increment in salary is 8% and the rate of inflation is 10%, then the real salary has actually gone down. This despite the fact that you may have got the best increment within the group that you work in. This is something that most people don’t understand.

When it comes to annual salary increments, an interesting trick that some companies (or divisions of some companies at least) employ these days, is of giving out a sort of an equal increment to everyone. Honestly, I don’t have any research based evidence for this, and at best all my evidence is anecdotal, wherein I have heard about these things from friends as well as family.

While an equal increment to everyone might sound like a very equitable way of going about things, especially when times are tough, it is not. At a very basic level it shows the laziness of the bosses who are meant to decide on such things. How can increments be equal? And at the same time it shows that the bosses are rewarding themselves at the cost of their underlings.

How is that? As Charles Wheelan writes in Naked Statistics—Stripping the Dread from the Data: “Your kindhearted boss might point out that as a matter of fairness, every employee will be getting the same raise this year, 10 percent. What a magnanimous gesture—except that if your boss makes $1 million and you make $50,000, his raise will be $100,000 and yours will be $5,000.”

So what sounds very similar when we use percentages turns out to be very unequitable when we use absolutes. As Wheelan writes: “The statement “everyone will get the same 10 percent raise this year” just sounds so much better than “my raise will be twenty times bigger than yours.””

This is essentially a trick that higher-ups in the organisation employ to ensure that their actual increments in salary are much more, even though on the face of it, it doesn’t seem like that.

There is another point that needs to be made here. As an employee goes up the hierarchy, the absolute increment starts to matter more than the percentage increment. This is another point that people don’t seem to understand. A 10% increment at Rs 30 lakh will mean an absolute increase in salary of Rs 3 lakh. The same increment at Rs 10 lakh, would mean an absolute increase in salary of Rs 1 lakh.

I have met more than a few insecure souls who have been unhappy about someone earning a lower salary getting a higher percentage increment. This does not make any sense, but that is what comparison does to people.

To conclude, these are a few basic points that people need to keep in mind when they get around to analysing their increments in the months to come. And here is hoping that you get a good one.

(Vivek Kaul is the author of the Easy Money trilogy. He can be reached at [email protected])

The column originally appeared in the Bangalore Mirror on April 6, 2016

MONEY LESSONS FROM A TORN NOTE

rupee

Over the last two months I have been carrying a slightly torn one hundred rupee note in my pocket. Nobody wants to accept it.

The note is slightly torn on the upper left hand side but the serial number is still visible. This essentially means that there is nothing wrong with the note and it continues to be a legal tender.

As Charles Wheelan writes in Naked Economics—Undressing the Dismal Science: “Consider a bizarre phenomenon in India. Most Indians involved in commerce—shopkeepers, taxi drivers, etc.—will not accept a torn, crumpled, or overly soiled rupee note.”

This entire act of not accepting torn notes doesn’t make any sense. As Wheelan writes: “The whole process is utterly irrational, since the Indian Central Bank [the Reserve Bank of India] considers any note with serial number—torn, dirty, crumbled, or otherwise to be legal tender. Any bank will exchange torn notes for crisp new ones.”

As the Reserve Bank of India points out: “Soiled notes are those which have become dirty and slightly cut…The cut in such notes, should, however, not have passed through the number panels. All these notes can be exchanged at the counters of any public sector bank branch, any currency chest branch of a private sector bank.”

The exchange facility is also available for mutilated notes or notes “which are in pieces and/or of which the essential portions are missing can also be exchanged.”

Given this, why do people still not accept soiled as well as mutilated notes? As Wheelan writes: “Rational people refuse legal tender because they believe that it might not be accepted by someone else…The whole bizarre phenomenon underscores the fact that our faith in paper currency is predicated on the faith that others place in the same paper.”

This is a very interesting point. At the end of the day, paper is money is just paper with some ink on it. A 100-rupee note is ten times as valuable as a ten rupee note simply because the Reserve Bank of India (or the government) says so. The ink and the paper used in a 100-rupee note is not ten times as valuable as the ink and the paper used in a ten-rupee note.

Paper money essentially works on confidence, which the government by recognising it as official money, helps build.  Further, it continues to have value, typically as long as people using it, continue to accept it. I will accept a payment in paper money only when I am sure that I can use that paper money to make my payments in the future.

As Mervyn King, former governor of Bank of England, writes in his new book The End of Alchemy: “Whatever form money takes, it must satisfy two criteria. The first is that money must be accepted by anyone from whom one might wish to buy ‘stuff’ (the criterion of acceptability). The second is that there is a reasonable degree of predictability as to its value in a future transaction (the criterion of stability).””

As per King’s second point, the confidence in paper money breaks down if it starts lose value at a very rapid rate i.e. when the prevailing inflation touches high levels. People then don’t like the idea of being paid in paper money because it is rapidly losing its purchasing power. In such scenarios people like being paid in the form of gold or silver or some other commodity.

In India, the first condition that King lays out, the criterion of acceptability, breaks down in case of a torn note. The moment a note is torn, it is not accepted as a payment even though it continues to be a legal tender. And it is not accepted as a payment by one person because he knows others won’t accept it.

What seems to be rational at an individual level becomes irrational at the systemic level. Meanwhile, I think I will have to finally make that trip to the bank.

(Vivek Kaul is the author of the Easy Money trilogy. He can be reached at [email protected])

The column originally appeared in the Bangalore Mirror on March 30, 2016