Is Bangladesh’s Per Capita Income “Really” Greater Than That of India?

For a story to go viral on the social media, it needs to be simple and straightforward. In fact, the story should be summarisable in a headline.

The story of Bangladesh’s per capita income overtaking that of India is precisely that kind of story. John Lanchester defines per capita income in his book How To Speak Money as: The total Gross Domestic Product(GDP) of a country divided by the number of people in the country…It is a measure of how rich the country’s citizens are on average.”

In simple terms what this story told us is that the average income of Bangladesh was more than that of India and hence, an average Bangladeshi was richer than an average Indian (Actually, it may not be so. You can understand why I say so here. But that’s what the conclusion drawn was).

No wonder the story got picked up and no wonder it has become viral.

Dear reader, you might be wondering by now if the story is that simple why am I writing about it? The answer will soon become clear.

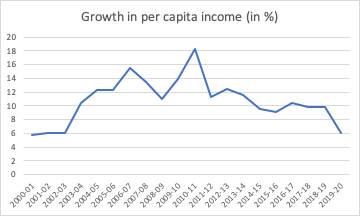
Let’s first take a look at the following chart. It plots the per capita income of India and Bangladesh.

Bangladesh overtakes India?


Source: International Monetary Fund.

A few days back, the International Monetary Fund published the World Economic Outlook (WEO) for October 2020. It also released a lot of data along with it. The above chart is plotted using data from the database which accompanied the release of the WEO.

As per the above chart, India’s per capita income in 2020 will be $ 1,876.53. In comparison, the per capita income of Bangladesh during 2020 will be $1,887.97. This is around 0.6% more than the Indian per capita income. The difference is very small but there is a difference.

All the song and dance about India versus Bangladesh came from this data point. Everyone picked up this data point, the media, the economists, the analysts, the influencers and finally, the politicians as well.

But what no one bothered to elaborate on is that the WEO data also tells us that India’s per capita income will be higher than Bangladesh between 2021 and 2023, and in 2024,  Bangladesh will overtake India again.

The point is that there is a lot of nuance in this data, which the headline of Bangladesh per capita income overtaking India’s, doesn’t really summarise. But who was bothered. It made for a great story and people ran with it. As the old newspaper cliché goes, if it bleeds, it leads.

Nevertheless, there is one thing that I haven’t told you up until now. What is that? The per capita income in the above chart and what we have been discussing until now, is in nominal terms (or current prices). This basically means that it hasn’t been adjusted for inflation. The inflation in Bangladesh since 2014 has been higher than India. The following chart plots that.

Faster price rise in Bangladesh

Source: International Monetary Fund.

A higher inflation reduces the purchasing power of a currency and that needs to be adjusted for. The International Monetary Fund provides data after adjusting for inflation and purchasing power parity (that is how much does a currency really buy), as well.

Take a look at the following chart, it plots the per capita income of India and Bangladesh, adjusted for inflation, in constant terms.

India is ahead of Bangladesh

Source: International Monetary Fund. Purchasing power parity; 2017 international dollar.

Once we adjust for inflation and purchasing power, the Indian per capita income is higher than that of Bangladesh. The trouble is that by now this story has become too complicated to go viral.

It’s no longer as simple as Bangladesh’s per capita income overtaking India. And India’s per capita income continuing to be higher than that of Bangladesh is not much of a story. I mean after all we are competing with China and not with a puny Bangladesh. (I am saying all this to explain why a certain kind of story in economics tends to go viral on the social media. We all want simple binary explanations that do not tax our minds much).

The story doesn’t end here. There is more to come. While Bangladesh’s per capita income continues to be lower than that of India, it is rapidly catching up. Let’s take a look at the following chart. It plots the ratio of the Indian per capita income to the Bangladeshi per capita income, using data used in the previous chart which has been adjusted for inflation and purchasing power parity.

Bangladesh is catching up


Source: Author calculations on IMF data.

As per this chart, India’s per capita income was 43% more than that of Bangladesh in 2016. The difference has been falling ever since. In 2021, the difference will fall to 20%. This basically means that Bangladesh is rapidly catching up on India.

Bangladesh has been doing better than India on a whole host of non-income indicators.

1) As per the Human Development Index, India’s life expectancy at birth in 2018 was 69.4 years. That of Bangladesh was 72.3.

2) This is primarily because India has a higher mortality rate of children under 5 years. In the Indian case, the mortality rate is 39.4 per 1,000 live births. In Bangladesh it is at 32.4. This means that fewer children die in Bangladesh before achieving the age of five. This explains why average life expectancy in Bangladesh is higher.

3) The child malnutrition rate in Bangladesh (% of children under 5) in Bangladesh is 36.2%. In India it is at 37.9%. A greater proportion of Indian children under the age of 5 are malnourished. Of course, the absolute numbers are much much more in the Indian case.

4) Bangladesh has much higher immunisation rates for diseases like DPT and measles than India. The rate of malaria incidence is higher in India, with 7.7 per 1,000 people being at risk. In case of Bangladesh, 1.9 per 1,000 people are at risk. The rate of tuberculosis incidence is higher in Bangladesh.

5) Interestingly, the current health expenditure in case of Bangladesh is at 2.4% of its GDP. India spends 3.7% of its GDP. But clearly the money is being much better spent in Bangladesh.

6) Bangladesh also does a lot better on a whole host of work and employment indicators. The employment to population ratio in case of Bangladesh is 56.2%. In case of India it is 50.6%. Clearly a greater proportion of Bangladeshi population is employed.

7) This is reflected in the higher labour force participation rate (people of the age of 15 and above it, who are a part of the labour force) of 58.7% in case of Bangladesh. In case of India it is at 51.9%. More interestingly, the labour force participation rate in case of Bangladeshi women is at a much higher 36% against 23.6% in India.

8) 55.5% of the employment in Bangladesh can be categorised as vulnerable employment. In case of India it is at 76.7%. A higher proportion of Indian jobs are at the risk of being lost.

9) 33.4% of the statutory age pension population in Bangladesh gets pension. In India, it is at 25.2%. On the flip side, a higher proportion of non-agricultural employment in Bangladesh is informal (at 91.3% against India’s 74.8%).

10)  43.9% of India’s labour force is employed in agriculture against Bangladesh’s 40.2%. Clearly, Bangladesh has been able to move people away from agriculture into other ways of earning money faster than India. 39.4% of the country’s employment is in the services sector against India’s 31.5%.

11) The sex ratio in Bangladesh (male to female ratio) at 1.05 is better than India’s 1.10. In India there are 100 females per 110 males on an average. In Bangladesh there are 100 females per 105 males on an average.

12) 97.3% of the population in Bangladesh has mobile phone subscriptions. In India it is at 86.9%. Having said that, India’s internet penetration at 34.5% of the population is higher than Bangladesh’s 15%.

13) The Gini coefficient, a measure of income inequality within a country, is lower in case of Bangladesh at 32.4 against India’s 35.7.

14) When it comes to schooling, the expected years of schooling in India stands at 12.3 years. In case of Bangladesh it is slightly lower at 11.2 years. Having said that, the rate of literacy among adults (15 years and older) in Bangladesh is at 72.9% against India’s 69.3%. This, despite the fact that the government expenditure on education in India amounts to 3.8% of the GDP, against Bangladesh’s 1.5% of the GDP. One possible explanation for this lies in the fact that India spends much more on higher education than Bangladesh.

15) The mean years of schooling for females in Bangladesh is at 5.3 years against India’s 4.7 years. On the flip side, the primary school dropout rate in Bangladesh is much higher at 33.8% against 12.3% in India’s case.

16) All the above data has been taken from the Human Development Index. With a score of 0.647 India ranks 129th on the index. Bangladesh on the other hand has a score of 0.614 and ranks 135th on the index. But there is a simple explanation for this. As Swati Narayan wrote in The Indian Express, in February this year: “While, technically, on the Human Development Index, Bangladesh scores marginally less, this is largely because the index merges income and non-income parameters.”

On many non-income indicators (as we have seen above) Bangladesh comes out better than India. Take the case of the Global Hunger Index. India ranked 94th among 107 countries. Bangladesh was at the 88th spot. Both countries have a level of hunger that is serious. But in case of Bangladesh, the situation is a little better. Even the World Happiness Report reported Bangladesh to be a much happier country than India.

17) India’s exports are much more than that of Bangladesh. But when it comes to exporting readymade garments (something that can create a huge number of jobs), Bangladesh has been doing much better than India for a while now. Take a look at the following chart, which compares India and Bangladesh’s garment exports.

Bangladesh beats India

Source: Bangladesh Garment Manufacturers and Exporters Association, Centre for Monitoring Indian Economy and the Dhaka Tribune.

The reasons for this success are explained in this piece I wrote for Mint.

Not for a moment am I suggesting that India is doing worse than Bangladesh on all parameters. It is not. But over the last two decades Bangladesh has managed to narrow the gap on many parameters especially those on the social, health, gender and work front.

If this continues, in the years to come it won’t be difficult for Bangladesh to overtake India’s per capita income, especially if we continue with what has now become the all-encompassing nothing is wrong and all is well rhetoric.

Of course, meanwhile both sides will continue to spin data in ways that are useful to them. The chances that you will see spin with data are more these days than the chance of a ball spinning on a cricket pitch.

Why India is Not Buying as Many Cars as Carmakers Want

Yesterday morning, there was a news flash that the carmaker Toyota does not want to expand any further in India.

Shekar Viswanathan, vice chairman of Toyota’s Indian unit, Toyota Kirloskar Motor, told the news-agency Bloomberg: “The government keeps taxes on cars and motorbikes so high that companies find it hard to build scale.”

The company later released a statement saying: “Toyota Kirloskar Motor would like to state that we continue to be committed to the Indian market and our operations in the country is an integral part of our global strategy.” General Motors quit India in 2017.

In 2019, Ford Motor Company agreed to move a bulk of its assets into a joint venture with Mahindra and Mahindra. Whether Toyota wants to expand in India or not remains to be seen, but this sort of prompted me to look at car sales data over the years and it makes for a very interesting read.

Motown Slowdown

Source: Centre for Monitoring Indian Economy.

The car sales data is available from 1991-92 onwards, a year in which around 1.5 lakh units were sold. The actual jump in car sales came in the decade between 2001-02 and 2011-12, when the car sales jumped from 5.09 lakh units to 20.31 lakh units, an increase of 14.8% per year on an average.

The car sales in 2019-20 were at 16.95 lakh units and lower than the sales in 2011-12. Of course, some of this was on account of the spread of the covid-pandemic. But car sales had been slow even before covid struck. Let’s ignore the car sales for 2019-20 and look at car sales for 2018-19, which were at 22.18 lakh units.

The car sales between 2011-12 and 2018-19 grew at the rate of 1.3% per year, which basically means that they were largely flat.

If one looks at the increase in car sales over the decade between 2008-09 and 2018-19, when the sales jumped from 12.2 lakh units to 22.2 lakh units, it works out to an increase of 6.2% per year.

Irrespective of whether Toyota is leaving India or not it is safe to say that car sales haven’t been going up much in the last ten years or more. In fact, if we look at data a little more minutely, things get more interesting.

A bulk of the cars being sold are essentially mini and compact cars (3201mm to 3600mm and 3601mm to 4000mm). Data for this is available from 2001-02 onwards. Take a look at the following chart, which plots the number of mini and compact cars sold as a proportion of total cars sold.

Value for Money?


Source: Author calculations on Centre for Monitoring Indian Economy data.

In 2001-02, mini and compact cars formed 82.4% of cars sold. It fell to a low of 72.9% in 2012-13. It has largely risen since and in 2019-20 reached a high of 93.7%. The point being that over the years a greater proportion of car buyers have bought value for money cars, making it difficult for many foreign car companies, given that this end of the market is dominated by Maruti Suzuki and Hyundai.

In the last five years, the sales of cars of up to 4,000 mm in length has simply gone through the roof. This is a function of the fact that the economic growth and the income growth have both stagnated in comparison to the past. Take a look at the following chart, which plots the increase in per capita income over the years in nominal terms.

Show Me the Money


Source: Centre for Monitoring Indian Economy.

The per capita income growth has fallen over the years and that is reflected in the kind of cars people buy. There is a straightforward connect between the second chart and the third chart. Car sales have gone up at a fast pace whenever there has been a consistent double-digit growth in income. Between 2014-15 and 2019-20, the per capita income has consistently grown in single digits, except in 2016-17, when it grew at 10.4%. This reflects in the car sales as well.

This slowdown in income growth indicates an economy which has slowed down majorly over the last few years. And this shows in the slow growth in car sales.

Of course, this is not the only reason for slow growth in car sales. There is also the problem of higher taxes. And Viswanathan of Toyota is not the only one who thinks so.

As RC Bhargava, the current chairman of Maruti Suzuki, India’s largest carmaker, and the grand old man of India’s car industry, puts it in his new book Getting Competitive—A Practitioner’s Guide for India:

“In India cars have always been considered a luxury product and taxed accordingly till the present… [this] despite being one of the few globally competitive industries. Both the Central and state governments levy taxes and the total is 2–3 times the tax in the developed countries.”

Of course, these taxes make cars expensive and that leads to lower sales growth. The car industry has tremendous multiplier effect on the overall economy. As Bhargava puts it:

“It generates high volumes of employment and leads to the development of many technologies and industries whose products are used in the manufacture of cars. These include steel, aluminium, copper, glass, fabrics, electronics and electricals, rubber and plastics.”

Essentially, high taxes on cars have ensured a slow growth of the industry. Slow growth of this industry has contributed to the overall slow growth of the economy. And the overall slow growth of the economy and incomes have contributed to the slow growth of the car industry. This is how it links up.

Hence, lowering taxes on the automobile sector in particular (something I have written about in the past) and on cars in particular, will work well for the economy. It might lead to lower per unit tax collections for the government, but the increase in sales volume should gradually make up for this.

Also, as I explain here, an expansion in manufacturing creates many services jobs as well. But for all that to happen taxes need to come down. Nevertheless, as Viswanathan told Bloomberg: “You’d think the auto sector is making drugs or liquor.”

What do higher household financial savings tell us about the economy?

The household financial savings, which form a bulk of the overall savings in the Indian economy, went up in 2019-20. This after they had fallen in 2018-19. The question is how did this happen and what does this mean for the Indian economy in the post-covid world? Mint takes a look.

What was household financial savings rate in 2019-20?

Household financial savings essentially refers to the savings of households in the form of currency, bank deposits, debt securities, mutual funds, insurance, pension funds and investments in small savings schemes. The total of these savings is referred to as gross household financial savings. Once the financial liabilities, that is, loans from banks, non-banking finance companies and housing finance companies, are subtracted from the gross savings, what remains is referred to as net household financial savings. The net household financial savings in 2019-20 rose to 7.7% of the GDP from 7.2% in 2018-19. This primarily happened because the liabilities fell from 3.9% of the GDP in 2018-19 to 2.9% in 2019-20.

What explains this uptick in household financial savings?

The gross financial savings of households in 2019-20 stood at Rs 21.63 lakh crore, marginally better than the gross savings in 2018-19 which was at Rs 21.23 lakh crore. Nevertheless, the net financial savings jumped to Rs 15.62 lakh crore in 2019-20 from Rs 13.73 lakh crore, a year earlier. This was primarily because the financial liabilities reduced from Rs 7.5 lakh crore to Rs 6.01 lakh crore. This pushed up net financial savings. Why did this happen? This happened primarily because the Indian economy has been slowing down from start of 2019. The per capita income in 2019-20 grew by just 6.1% (nominal terms, not adjusted for inflation), the slowest since 2002-03, when it had grown by 6.03%.

How did slow growth in per capita income impact savings?

A double digit growth in per capita income has happened only once since 2013-2014. In 2016-17, the per-capita income grew by 10.39%. Over the last few years, income growth has slowed down, and in 2019-20, it slowed down dramatically to 6.1%. This has led to a slowdown in lending growth. The non-food credit growth of banks in 2019-20 was at 6.7%, the slowest in more than a decade.

What does this tell about the overall state of the economy?

A slowdown in income growth has led to a slowdown in consumption as well as a slowdown in loan growth. What hasn’t helped is the weak financial state of non-banking finance companies, which has added to the lending slowdown. Also, this means that people were looking at their economic future bleakly, even before covid-19 had struck. At an individual level, the good part for them is that they tried to go slow on their borrowing in comparison to the past. But at the societal level, this hurt the economy because it led to a consumption slowdown.

Where will the household financial savings settle in 2020-21?

The period between April and June will lead to higher savings. As a recent RBI research paper states, a spike in household financial savings “is likely in the first quarter of 2020-21 on account of a sharp drop in lockdown induced consumption.” In fact, this explains why bank deposit rates have fallen in the recent past. The money deposited with banks has gone up, while the banks are unable to lend. But this spike in savings is likely to taper in the months to come simply because of “lags in the pickup of economic activity”.

A slightly different version of the piece appeared in the Mint on June 15, 2020.

The Income of the Average Indian is Significantly Lower Than the Average Income of India

ARTS RAJAN

The speeches made by the Reserve Bank of India(RBI) governor, Raghuram Rajan, are always a pleasure to read. In his latest speech made on April 20, 2016, Rajan said: “India is the fastest growing large country in the world, though with manufacturing capacity utilization low at 70% and agricultural growth slow following two bad monsoons, our potential is undoubtedly higher. Growth, however, is just one measure of performance. The level of per capita GDP is also important. We are still one of the poorest large countries in the world on a per capita basis, and have a long way to go before we reasonably address the concerns of each one of our citizens.”

Rajan further said: “We are often compared with China. But the Chinese economy, which was smaller than ours in the 1960s, is now five times our size at market exchange rates. The average Chinese citizen is over four times richer than the average Indian. The sobering thought is we have a long way to go before we can claim we have arrived.”

The point that Rajan was trying to make was that: “As a central banker who has to be pragmatic, I cannot get euphoric if India is the fastest growing large economy…The central and state governments have been creating a platform for strong and sustainable growth, and I am confident the payoffs are on their way, but until we have stayed on this path for some time, I remain cautious.”

This was essentially a retort to politicians who keep tom-tomming India’s dodgy economic growth numbers. While Rajan did not say that he does not believe in the economic growth numbers, he did try and make it clear that if India needs to reach anywhere, it needs strong and sustainable economic growth in the years to come. And achieving that is easier said than done.

Further, Rajan also made a more important point in his speech about India’s low per capita income. What is per capita income? John Lanchester defines per capita income in his book How To Speak Money as: “The total Gross Domestic Product(GDP) of a country divided by the number of people in the country.

As he further writes: “It is a measure of how rich the country’s citizens are on average – though it is a very rough measure of that, since a country’s WEALTH is often very unevenly distributed.”

The phrase to mark in the above paragraph is on average. The question is does an average always represent the right scenario? As Robert H Frank writes in Success and Luck—Good Fortune and the Myth of Meritocracy: “It is of course possible for most people to have a trait the measures higher than the corresponding mean value for the population to which they belong. Since a small number of people have fewer than two legs and no one has more, for instance, the average number of legs in any population is slightly less than two. So most people actually do have “more legs than average”.”

How does the above paragraph apply in the context of the GDP? What it tells us is that the average income of India is not equal to the income of the average Indian. Now what does that actually mean?

Let me explain that through an example. Let’s say on a given day in the city of Mumbai, an Ambani, an Adnani, a Birla and a Tata, walk into a local Udupi restaurant in Matunga. The restaurant is known for its soft idlis and fabulous coffee. And this has attracted the four industrialists to this small place.

The moment these four walk into the restaurant, the average income of the people seated in the restaurant goes up by leaps and bounds. If I may rephrase the last sentence, the per capita income of the restaurant goes up leaps and bounds, when the four industrialists walk into the Udupi restaurant.

But this increase in per capita income of the restaurant will have no impact on the incomes of the other people seated in the restaurant. (This example is essentially an adaptation of an example Charles Wheelan uses in his book Naked Statistics).

As Charles Wheelan writes in Naked Statistics: “The mean, or average, turns out to have some problems in that regard, namely, that it is prone to distortion by “outliers”, which are observations farther from the center.”

So basically, the Ambanis, Adnanis, Birlas and Tatas, of the world, essentially India’s rich, push up the average income of India i.e. the per capita income. As Wheelan writes: “The average income…could be heavily skewed by the megarich.”

In this scenario, the average income does not give us a correct picture. Further, it is safe to say, that the income of the average Indian is lower than the average income of India.

At this point it is important to introduce another term i.e. the median. As Wheelan writes: “The median is the point that divides a distribution in half, meaning that half of the observation lie above the median and half lie below.

Hence, the median income is the income of the average Indian. Given this, the median income is the right representation of the income of the average Indian. This is because the rich outliers (the Ambanis, the Adnanis, the Tatas and the Birlas) are taken into account. Data from World Bank shows that the top 10% of India’s population makes 30% of the total income. And this pushes up the per capita income.

The trouble is that it is not so easy to find median income data in the Indian context. A survey carried out by Gallup in December 2013, put India’s median income at $616. Data from the World Bank shows that India’s per capita income during the same year was $1455.
Hence, the median income was around 58% lower than the average income or the per capita income. And that is not a good sign at all.

This shows the tremendous amount of inequality prevalent in the country. The difference in the income of the average Indian and the average income of India is thus huge. In fact, I had written about this inequality in the column published on April 19.

In 2015-2016, the average income of those not working in agriculture was 4.9 times those working in agriculture (using GDP at current prices). If we were to use GDP at constant prices (at 2011-2012 prices), the ratio comes to 5.5. Constant prices essentially adjust for inflation.

And this is really a big worry!

The column originally appeared on the Vivek Kaul’s Diary on April 25, 2016

Why Monsoon Still Matters So Much

monsoon

The stock market wallahs have been excited since April 12, 2016. On that day, the India Meteorological Department(IMD) came up with the forecast for the monsoon season rainfall for 2016. The forecast this time is that the monsoon rainfall during the period July to September 2016 will be 106% of the long period average (LPA), averaged over the country, with a model error of ± 5%. At 106%, this will be an above average monsoon.

The long period average over the country as a whole for the period 1951-2000 is 89 cm. So the question is how good have the IMD’s forecasts been over the last few years? The short answer is—not good.

In 2015, the IMD had forecast a rainfall of 93% of the long period average. The actual rainfall was 86% of the long period average. The actual result was outside the ± 5% model error that IMD works with. When the IMD forecast a rainfall of 93% of long period average, it was essentially forecasting a rainfall of anywhere between 88% and 98% of the long period average.

In 2014, the IMD had forecast a rainfall of 95% of the long term average. The actual rainfall was 88% of the long period average. This was also outside the model error of ± 5%. In 2013, the actual rain was 106% of the long term average, in comparison to a prediction of 98%. This was also outside the model error of ± 5%.

In 2012, the actual rain and the predicted rain were at 92% and 99% of the long period average. This prediction was also outside the model error of ± 5%.

In 2011, the actual rain and the predicted train were at 101% and 98%. This was within the model error of ± 5%. Hence, in the last five years, the IMD has got only one prediction right. This makes one wonder if the stock market wallahs have taken this bad record of IMD at predicting monsoons into account or not. Between April 11, 2016 and April 18, 2016, the BSE Sensex has gone up by around 3.2% in four trading sessions.

The tragic thing is that nearly 70 years after independence from the British in 1947, the country is still so highly dependent on the monsoon season. As Raghuram Rajan, the governor of the Reserve Bank of India, told the Wall Street Journal in a recent interview: “We’re looking for signs of a good monsoon. Unfortunately, India is still somewhat sensitive to monsoons.”

So why is India so dependent on the monsoon season? Data from World Bank suggests that in 2012, only 36.3% of India’s total agricultural land had access to irrigation. This number would have improved since then. Nevertheless, nearly 60% of India’s agricultural land still does not have access to irrigation.

Hence, for water, Indian agriculture is majorly dependent on the monsoon rains. In this scenario, it is important that monsoon rains arrive on time, are well spread over the season and across different parts of the country, which do not have access to irrigation systems.

Once there are adequate rains, the farmers will be able to grow a good crop and then sell it at a good price. (Of course, a good crop does not mean a good price, there are other issues at play as well. But we will leave that for some other day).

The money that they thus earn will be spent on consumer goods, two-wheelers and so on. This will benefit the companies that manufacture these things, along with those who supply the inputs to these companies and so the multiplier effect will work. For example, more two-wheeler sales mean more sales for tyre companies. More tyre sales mean more demand for rubber and so on. The same logic applies to other inputs that go into making a two-wheeler.

At least this is how the stock market wallahs are thinking. But there are a few caveats that need to be made here. First and foremost, as I said earlier in this column, IMD forecasts more often than not have turned out to be wrong in the last few years. But given that they have made a forecast of 106%, unless they go majorly wrong, the rains this year will be better than the last two years. Second, a good crop need not necessarily mean a good price for the farmer. The agricultural markets around the country still don’t function like they should and benefit the trader community more than the farmers.

Third, the agricultural crop that will benefit from the monsoon rains (i.e. the kharif crop) will start hitting the market only in October 2016. Hence, the fillip to consumption (if any) will start happening only around then i.e. in the second half of this financial year.

Over and above this, there is another important point that needs to be made here. Data from the World Bank tells us that in 2014, India’s population was 129.5 crore. The population growth rate in 2014 was at 1.2%. Assuming that the population in 2015 grew at the same rate, the population for 2015 comes in at around 131 crore.

Data from World Bank shows that 50% of India’s population depends on agriculture. Hence around 65.5 crore out of the 131 crore are still dependent on agriculture. Data from the Central Statistics Office(CSO) shows that in 2015-2016, the total contribution of agriculture, forest and fishing to the gross domestic product (at current prices) was Rs 2,082,692 crore.

Hence, the per capita income of every individual dependent on agriculture, forest and fishing, works out to around Rs 31,797 (Rs 2,082,692 crore divided by 65.5 crore).

Now how do things look for the other half which is not dependent on agriculture? Their total contribution to GDP was Rs 101,69,614 crore. Hence, their per capita income works out to Rs 1,55,261 (Rs 101,69,614 crore divided by 65.5 crore).

What these calculations tell us is that in 2015-2016, those not working in agriculture earned nearly 4.9 times those working in agriculture. If we were to use GDP at constant prices (at 2011-2012 prices), the ratio comes to 5.5. Constant prices essentially adjust for inflation.

And this huge differential in per capita income between those who work in agriculture and those who don’t, is India’s single biggest problem. (Of course since I am using averages here, a lot of other issues are getting side-lined, but the broader point remains valid nonetheless).

This also shows the tremendous amount of inequality present in the country between the haves and the have-nots.

Agriculture no longer yields enough to feed the number of people dependent on it. The only solution to this is to improve crop yields (i.e. more production per hectare), ensure that the farmers are able to sell this increased production through a proper market which works and finally, people need to be gradually moved out of agriculture into doing other things.

This is going to be a slow process because people dependent on agriculture simply do not have the required skillset to be moved to do other things, in most cases. Until then we will simply be dependent on monsoon rains.

The column originally appeared in Vivek Kaul’s Diary on April 19, 2016