This is the third and the final column in the series, where I explain that Donald Trump’s idea of making America great again, by imposing tariffs, is not going to work.
Dear Reader, before you start reading this column, it perhaps makes sense to read the two columns published before this, in order to get a complete perspective on the topic. (You can read the columns here and here).
In today’s column we will take a look at how Trump’s entire idea of driving up exports while driving down imports, is contradictory to say the least. Let’s start by looking at Figure 1, which basically plots the trade deficit of the United States over the years.
Figure 1: US trade deficit (in $ million)
Trade deficit is a situation where the imports of a country are more than its exports. We can see that the United States has run a trade deficit with the rest of the world over the last four decades. The trade deficit peaked between 2004 and 2008, fell for a few years after that, and started going up again.
The American trade deficit came down in the years 2009 and 2010, and these were years when the American economy and the global economy, were both not doing well. Now let’s take a look at Figure 2, which basically plots the exports and imports of the United States over the last four decades.
Figure 2:
Figure 2 makes for a very interesting reading. The exports and the imports curves of the United States, move more or less in the same way. This basically means that when imports go up, exports also go up and vice versa. Why is that the case? The reason for this is very straightforward. The United States is the largest market in the world. When it imports stuff, it pays dollars to other countries, which are exporting stuff to the United States. These countries can then use these dollars to pay for American exports.
Hence, if Trump keeps going ahead with imposing more tariffs on imports into the US, as he has suggested for a while, he will deny other countries an opportunity to earn “enough” dollars through which they can pay for their imports from the US, which are basically the exports for the US. The larger point being that it is not possible to increase American exports and decrease American imports at the same time. This is the simplistic plan that Trump has to make America great again and there is a basic disconnect at the heart of it. Also, any such plan will have a negative international impact.
Now let’s take a look at Figure 3, which basically plots the American trade deficit with one country, and that is China.
Figure 3:
Figure 3 clearly shows that the American trade deficit with China has gone up dramatically over the years. The Chinese imports help keep inflation low in the United States. They also help keep interest rates low, as the dollars earned by the Chinese, have over the years found their way back into the United States and are invested in American treasury securities and other debt securities. This foreign demand for American financial securities has helped keep interest rates low in the US. Over and above this, there is another major point that arises here. Take a look Figure 4. It plots the overall trade deficit of the United States, along with the trade deficit that the country runs with China.
Figure 4:
Figure 4 tells us very clearly that over the years, the trade deficit with China has formed a greater proportion of the overall trade deficit run by the United States. In 2017, the trade deficit with China formed nearly 66% of the overall trade deficit.
Much has been said about the fact that Trump is basically not thinking about the long-term, but is trying to beat down American trading partners into giving American companies better terms. The trouble is that the bulk of the American trade deficit is with China and unless Trump takes on China, the gains of his so called policy are going to be very low.
Of course, it is not easy to bully China, given that other than helping maintain a low inflation and low interest rates in the US, the Chinese also own more than a trillion dollars of American government treasury securities and if push comes to the shove, it can use these treasury securities, as a bargaining tool.
Also, the current Chinese regime is turning more and more authoritarian and is unlikely to take to any bullying by the US, lightly. The only way America can become great again on the industrial front is, if it is able to compete with the products being produced internationally, both on the price as well as the quality front.
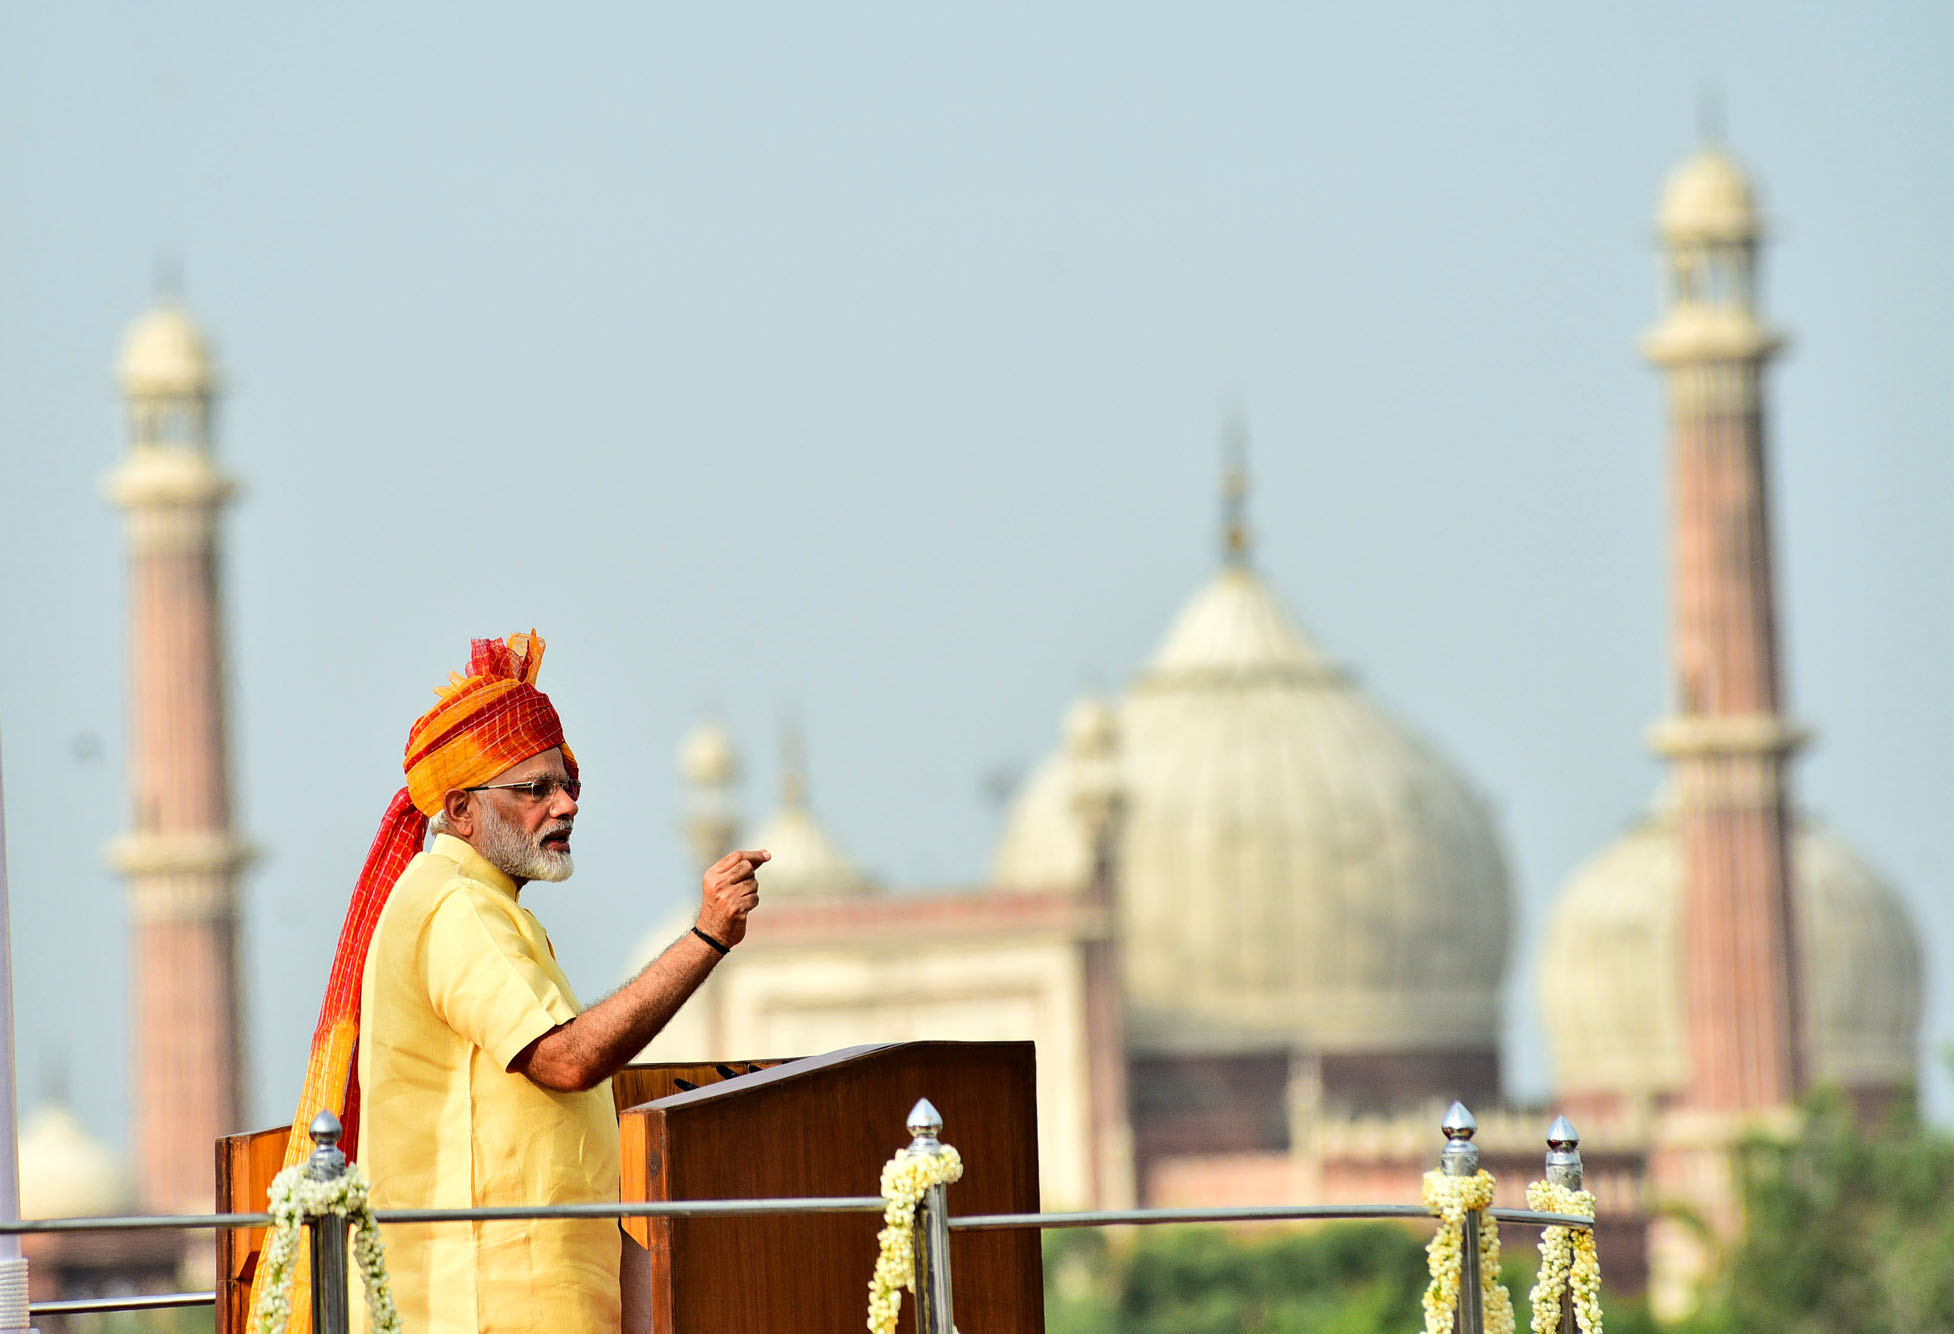
The Prime Minister, Shri Narendra Modi addressing the Nation on the occasion of 71st Independence Day from the ramparts of Red Fort, in Delhi on August 15, 2017.
In a speech last week, Prime Minister Narendra Modi, offered several data points to tell his fellow countrymen, that all is well with the Indian economy. And those who didn’t think so were essentially being needlessly pessimistic, he suggested.
Now only if he had bothered to look at data points beyond those he chose to offer, a totally different situation would have emerged. In this piece, I offer many data points to show that all is not well with the Indian economy.
1) Let’s start with the loans disbursed by banks during the course of this year. Let’s look at non-food credit to start with. These are the loans given out by banks after we have adjusted for food credit or loans given to the Food Corporation of India and other state procurement agencies, for buying rice and wheat directly from farmers at the minimum support price (MSP) for the public distribution system. Take a look at Figure 1.
Figure 1:
The Figure 1 clearly shows that the total amount of non-food credit given by banks during the course of this year has been in negative territory. This basically means that on the whole banks haven’t given a single rupee of a loan. The situation is the worse it has been in five years. Non-food credit consists of loans given to agriculture, industry, services and retail sectors, respectively.
Let’s take a look at each of these sectors.
2) Let’s take a look at Figure 2, which plots the loans given by banks to agriculture and allied activities.
Figure 2:
Loans given to agriculture and allied activities are in negative territory during the course of this year. Again, this basically means that on the whole banks haven’t given a single rupee of a loan to agriculture. In technical terms, their loan book to agriculture has shrunk. Is this possibly because of farm loans being waived off by state governments, that only time will tell.
3) Let’s take a look at Figure 3, which plots the loans given banks to industry.
Figure 3:
Figure 3 makes it clear that loans given to industry by banks continue to shrink. This isn’t surprising given the huge amount of bad loans accumulated by banks on lending to industry. Banks still don’t trust the industry.
4) Let’s take a look at Figure 4, which plots the loans given by banks to the services sector.
Figure 4:
This comes in as a major surprise, loans given to services have shrunk majorly during this financial year. Services constitute half of the Indian economy. If the firms operating in this sector are not interested in borrowing, then how can the Indian economy possibly be doing well?
5) Let’s take a look at Figure 5, which plots the retail loans given by banks during this financial year.
Figure 5:
Retail loans are the only loans which have been in positive territory during the course of this year. Nevertheless, they have been more or less at the same level over the last few years.
This, despite the fact that interest rates have come down dramatically. If people are not willing to borrow more even at lower interest rates, how can things be alright with the Indian economy, is a question well worth asking.
Sadly, Prime Minister Modi, did not include any of these data points in his speech and presentation.
6) The latest Consumer Confidence Survey of the Reserve Bank of India (RBI) for September 2017, states: “Households’ current perceptions on the general economic situation remained in the pessimistic zone for four successive quarters, with the outlook worsening… The employment situation has been the biggest cause of worry for respondents, with sentiment plunging further into the pessimistic zone; the outlook on employment has also weakened.”
7) Take a look at Figure 6, which plots the cement production over the years.
Figure 6:
Cement production is down this year, in comparison to the previous year. This tells us clearly that the construction and the real estate industry continue to be in trouble. These industries are huge employers of people, especially those who have low-skills.
8) The commissioning of new projects has slowed down. As Centre for Monitoring Indian Economy, which tracks this data, points out: “Projects worth Rs 512 billion were commissioned during the quarter ended September 2017. In the coming weeks this estimate is expected to rise. It could reach about Rs 700 billion. Even if this happens, this would be the lowest commissioning of projects during the Modi government’s tenure so far.”
9) There has been a fall in new investment proposals. As Centre for Monitoring Indian Economy, which tracks this data, points out: “Projects worth Rs.845 billion were proposed during the quarter ended September 2017. This is the lowest level of intentions to invest seen in a quarter during the tenure of the Modi government.”
10) There has been a huge fall in the profit of companies. As Centre for Monitoring Indian Economy points out: “We infer this and other related nuggets of information from the financial statements of 1,127 listed companies… Profit before taxes of these companies fell by 27.9 per cent over their level a year ago.”
11) Take a look at Figure 7, which plots the trade deficit or the difference between exports and imports.
Figure 7:
The trade deficit has jumped up majorly during the course of this financial year. This as I have explained beforehas primarily been on account of a jump in non-oil non gold non silver imports, in the aftermath of demonetisation. The unseen negative effects of demonetisation continue to impact the economy.
12) The growth in private consumption expenditure is at a six-quarter low. As the RBI Monetary Policy Statement pointed out: “Of the constituents of aggregate demand, growth in private consumption expenditure was at a six-quarter low in Q1 of 2017-18 [April to June 2017].”
13) As the RBI Monetary Policy Statement further pointed out: “India’s export growth continued to be lower than that of other emerging economies such as Brazil, Indonesia, South Korea, Turkey and Vietnam, some of which have benefited from the global commodity price rebound.”
14) Take a look at Figure 8 which plots the investment to GDP ratio.
Figure 8:
The investment to GDP ratio has improved a little in the period of three months ending June 2017, but it continues to remain very low. As the RBI Monetary Policy Statement pointed out: “The implementation of the GST so far also appears to have had an adverse impact, rendering prospects for the manufacturing sector uncertain in the short term. This may further delay the revival of investment activity, which is already hampered by stressed balance sheets of banks and corporates.”
15) Now let’s take a look at Figure 9, which plots the growth of the non-government part of the GDP.
Figure 9:
Figure 9 basically plots the growth of the non-government part of the economy, which typically constitutes 87 to 92 per cent of the economy. The growth of the non-government part of the economy has fallen to around a little over 4 per cent. This extremely important detail did not find a place anywhere in Prime Minister Modi’s speech.
16) The situation becomes even more worrisome if we look at Figure 10.
Figure 10:
As is clear from Figure 10, the growth rate of industry in general and manufacturing and construction in particular is at a five-year low. The manufacturing part of industry grew at 1.17 per cent during April to June 2017, whereas construction grew by 2 per cent during the same period.
This is a big reason to worry simply because manufacturing and construction have the potential to create new jobs. An estimate made by Crisil Research suggests that in construction 12 workers are typically required to create Rs 10 lakh worth of output. In case of manufacturing it is seven workers.
17) Take a look at Figure 11, which basically shows that labour intensive sectors have slowed down between January to June 2017.
Figure 11:
As Crisil Research points out in a recent research note: “In the past two quarters, three sectors have grown much faster than GDP: 1) Trade, hotels, transport, communication and services related to broadcasting; 2) Electricity, gas, water supply and other utilities, and 3) Public administration, defence and other services. Of these, only the trade, hotels and restaurants sub-sector is labour intensive, requiring about 6 workers to produce Rs 10 lakh worth of output. But the share of this sub-sector in total output is low at ~12%. In contrast, a fast growing sector like public administration, defence and other personal services, despite having a larger share in output, has low labour intensity of only 3. And sectors with higher labour intensity – such as construction (12) and manufacturing (7) – have been undershooting overall GDP growth.”
It needs to be said here that public administration, defence and other personal services sector is basically a proxy for the government. And the government has stopped creating jobs.
18) Take a look at Figure 12.
Figure 12:
Figure 12 plots the index of industrial production (IIP), a measure of the industrial activity in the country. It also plots manufacturing, which forms more than three-fourths of IIP. The growth of both these measures has been in low single digits for a while now and is clearly a reason to worry.
19) Take a look at Figure 13, which basically plots the consumption of petroleum products, over the years.
Figure 13:
The consumption of petroleum products has more or less been flat in comparison to the last financial year. This is another good indicator of slowing economic growth.
20) Take a look at Figure 14, which plots the sale of commercial vehicles during the course of this financial year.
Figure 14:
Commercial vehicle sales, which are a very good indicator of a pick-up in the industrial part of the economy. Commercial vehicle sales this year were lower than they were last year.
21) Take a look at Figure 15. It plots the fiscal deficit ratio of the government over the years.
Figure 15:
As can be seen from Figure 15, in the first five months of the current financial year, 96 per cent of the annual fiscal deficit has already been crossed. Fiscal deficit is the difference between what a government earns and what it spends. Why is the fiscal deficit during the first five months of the year at such a high level? The answer lies in the fact that the economic growth is slowing down and the government is trying to drive up growth, by spending more.
22) Take a look at Figure 16.
Figure 16:
It tells us that the increase in government expenditure has been a greater part of the increase in GDP over the last two years. For the period April to June 2015, the increase in government expenditure made up for around 1.3 per cent of the increase in GDP during that period. Since then it has jumped to 39.2 per cent between January to March 2017 and 34.1 per cent between April to June 2017.
So, the government is spending more and more in order to drive economic growth. This again shows that the government in its actions does believe that the economic growth is slowing down, but PM Modi won’t say so in his public posturing.
23) Take a look at Figure 17, it plots the bad loans ratio of public sector banks.
Figure 17:
Figure 17, basically plots the gross non-performing advances ratio or simply put. the bad loans ratio of public sector banks, over the years. Bad loans are essentially loans in which the repayment from a borrower has been due for 90 days or more. There has been a huge jump in bad loans of public sector banks over the last two years.
On October 7, the Reserve Bank of India imposed restrictions on the banking activities of Oriental Bank of Commerce (OBC). OBC was the seventh public sector bank on which restrictions have been placed. Now, one-third of public sector banks have restrictions in place. And all is well with the Indian economy?
24) Take a look at Table 1.
Table 1:
Gross NPAs (in Rs Crore)
Gross Advances
Gross non-performing advances ratio
Indian Overseas Bank
35,098
1,40,459
24.99%
IDBI Ltd.
44,753
1,90,826
23.45%
Central Bank of India
27,251
1,39,399
19.55%
UCO Bank
22,541
1,19,724
18.83%
Bank of Maharashtra
17,189
95,515
18.00%
Dena Bank
12,619
72,575
17.39%
United Bank of India
10,952
66,139
16.56%
Oriental Bank of Commerce
22,859
1,57,706
14.49%
Bank of India
52,045
3,66,482
14.20%
Allahabad Bank
20,688
1,50,753
13.72%
Punjab National Bank
55,370
4,19,493
13.20%
Andhra Bank
17,670
1,36,846
12.91%
Corporation Bank
17,045
1,40,357
12.14%
Union Bank of India
33,712
2,86,467
11.77%
Bank of Baroda
42,719
3,83,259
11.15%
Punjab & Sind Bank
6,298
58335
10.80%
Canara Bank
34,202
3,42,009
10.00%
Source: Author calculations on Indian Banks’ Association data.(The table does not include the associate banks of the State Bank of India which were merged into it).
What does Table 1 tell us? It tells us that many public sector banks are in a big mess on the bad loans front. Banks like Indian Overseas Bank and IDBI with bad loans ratio of 24.99 per cent and 23.45 per cent, will pull down the performance of any big bank they are merged with.
Even the big banks like Union Bank of India, Bank of Baroda, Punjab National Bank and Canara Bank, have a bad loans ratio of 10 per cent or more. If and when weaker banks are merged with these banks, their performance will only deteriorate. The question to ask is, why are many of these banks still being allowed to operate?
25) The capacity utilisation of 805 manufacturing companies tracked by the RBI OBICUS survey fell to 71.2 per cent during the period April to June 2017. This is the lowest in seven quarters.
I guess I will stop at this. There are many other economic indicators which can be used to point out that all is not well with the Indian economy. (For more details on how PM Modi cherry picked data to build a positive economic narrative, you can click here and here). Of course, this is not to say that there are no positive economic indicators right now. But the negative indicators far outnumber the positive ones.
As I keep saying, the first step towards solving a problem is recognising that it exists. But that doesn’t seem to be the case with PM Modi. In his world, all is well.
As I write in the book: “The United States is the biggest economy in the world. It accounts for nearly one-fourth of the world’s GDP. By virtue of this, it is also the world’s biggest market, where China, Japan, and countries from South-East Asia could sell their goods and earn dollars in the process. It is also the world’s biggest consumer of oil and consumes nearly a fourth of the global oil production. This meant that oil-rich states like Saudi Arabia could sell oil to it and thus earn dollars in the process.
So, the United States imported, and countries like China, Japan, Saudi Arabia, and other countries in Asia earned dollars in the process. These dollars were then invested in treasury bonds… as well as the private sector. With so much money chasing these American financial securities, the issuers of these securities could in turn offer low rates of interest on them.
This meant that the prevailing interest rate scenario in the United States remained low despite a high budget deficit. This allowed citizens to borrow money at low interest rates and buy homes. It also allowed them to encash the equity in their homes and spend it on consuming other goods. So, the Americans could buy cars from Japan, apparel and electronics from China and so on.
And so the cycle worked. The United States shopped, China earned, China invested back in the United States, the United States borrowed, the United States spent, China earned again and China lent money again. The same was true with Japan, though to a lesser extent.
The way this entire arrangement evolved had the structure of a Ponzi scheme. A Ponzi scheme is essentially a financial fraud wherein the money that is due to older investors is repaid by raising fresh money from newer investors. The scheme keeps running while the money brought in by the new investors is greater than the money that needs to be repaid to the older investors. The moment this reverses, the scheme collapses.
The entire US-China-Japan arrangement was like that. The Chinese invested money in various kinds of American financial securities, which helped keep interest rates low in the United States. This helped Americans to consume more. The money found its way back into China (like a return on a Ponzi scheme) and was invested again in various kinds of American financial securities, again helping keep interest rates low and the consumption going. Like in a Ponzi scheme, the dollars earned by China and other countries kept coming back to the United States. This arrangement… kept interest rates low.”
What the American President Donald Trump proposes to do threatens this global Ponzi scheme. Before we come to the specifics of this, let’s take a look at Figure 1. It shows the trade deficit that the United States has run with China, over the last three decades.
The trade balance is essentially the difference between the imports and the exports of any country. If the trade balance of a country is in negative territory, it is said to run a trade deficit, which the United States does. Specifically, the United States runs a trade deficit with China i.e., it’s imports from China are significantly greater than its exports to China. Also, over the last three decades the trade deficit that United States has run with China has exploded.
Figure 1:
Take a look at Figure 2. It shows the trade deficit that the United States has run with the world at large, over the last three decades.
Figure 2:The Figure 2 shows that the trade deficit that the United States runs with the world at large has fallen in the aftermath of the financial crisis. This essentially means that the difference between what the United States is importing from the world and what it is exporting to the world, has come down.
Now take a look at Figure 3. It basically combines Figure 1 And Figure 2. What does it tell us?
Figure 3:It tells us that the trade deficit that the United States runs with China, makes up for a greater proportion of the overall trade deficit, than it did before. In 2015, the trade deficit with China made up for 73.4 per cent of the overall trade deficit. In comparison, in 2000, the figure was just at 22.5 per cent.
Given that the United States runs a trade deficit with China as well as the world, countries earn dollars from it. These dollars then find their way back into the United States and get invested in financial securities and in the process help keep interest rates low in the United States.
The new American President Donald Trump, who took over earlier this month, wants to bring down this trade deficit that the United States runs with China in particular and the world in general. As I had discussed in the column dated January 23, 2017, this is one of the plans that Trump has, to make the United States of America great again.
As Peter Navarro, an economist known to be close to Trump, and who served as a policy advisor to the Trump campaign, puts it: “Trump proposes eliminating America’s $500 billion trade deficit through a combination of increased exports and reduced imports.” The trade deficit of the United States in 2015 stood at $500.4 billion.
So how does Trump plan to bring down imports? As his website puts it: “[He plans to direct] the Secretary of Commerce to identify every violation of trade agreements a foreign country is currently using to harm our workers, and also direct all appropriate agencies to use every tool under American and international law to end these abuses.”
Trump also plans to: a) Instruct the Treasury Secretary to label China a currency manipulator. b) Instruct the U.S. Trade Representative to bring trade cases against China, both in this country and at the WTO. China’s unfair subsidy behaviour is prohibited by the terms of its entrance to the WTO. c) Use every lawful presidential power to remedy trade disputes if China does not stop its illegal activities, including its theft of American trade secrets – including the application of tariffs consistent with Section 201 and 301 of the Trade Act of 1974 and Section 232 of the Trade Expansion Act of 1962. (Source: https://www.donaldjtrump.com/policies/trade)
Trump plans to impose import duties (i.e., tariffs) in order to ensure that the cheap Chinese imports into the United States, no longer remain cheap. CNN reported in late December 2016: “President-elect Donald Trump’s transition team is discussing a proposal to impose tariffs as high as 10% on imports, according to multiple sources.”
The question is why does Trump want to do this? I will just come to that.
On a recent visit to Baltimore I had the pleasure of listening to the famous economist Richard Duncan. Duncan’s book The Dollar Crisis has had a tremendous impact on the way I looked at the international financial crisis, in my Easy Money books. As Duncan put it: “President-elect Trump [Duncan was talking before Trump took over as President] believes the US trade deficit has been responsible for the loss of manufacturing jobs in the United States and the downward pressure on US wages that has occurred over the last several decades.”
The question is what will be the repercussions if Trump and his associates do go about doing what they have proposed. My sense is it will lead to the unravelling of the global Ponzi scheme, which I talk about at the beginning of this piece. And in the process, nobody will be better off.
In fact, take a look at Figure 4, which maps America’s imports and exports since 1990.
Figure 4:One look at Figure 4 tells us that the import curve and the export curve closely map each other. What does that tell us? It tells us that the dollars earned by the countries which export goods and services to the United States (essentially imports for the United States), are used to buy goods and services being exported by the United States. As Duncan puts it: “Over the past 35 years, that deficit has become THE driver of global economic growth. In fact, the entire global economy has been constructed around unbalanced trade.” So, what will happen if Trump makes it difficult for the United States to import stuff from China and other parts of the world, as he has promised to do? If the American imports come down, so will its exports primarily because other countries won’t have the dollars required to import stuff from the United States. Also, with both imports as well as exports shrinking, the American trade deficit may not shrink.
Nevertheless, a fall in American imports would mean a fall in global demand and in the process the global economy will shrink. As Duncan puts it: “At this point, the attempt to eliminate the US trade deficit could very easily cause the global economy to collapse into a new Great Depression.” Things could go particularly bad for China. In 2015, the United States ran a trade deficit of $367.2 billion with China. This meant a trade deficit of around a billion dollars per day.
As Duncan puts it: “If the US eliminates its $1 billion a day trade deficit with China, China’s economy could collapse into a depression that would severely impact all of China’s trading partners, and potentially lead to social instability within China and to military conflict between China, its neighbors and the US.”
Further, eliminating imports from low-wage countries would mean that the consumer price inflation will rise in the United States. This will lead to higher interest rates.
We live in a world, where easy money available at low interest rates from the United States, has been invested in financial markets all over the world. And if interest rates start rising in the United States, it won’t be good news for financial markets all over the world.
Donald Trump was sworn in as the 45th President of the United States on January 20, 2017. One Trump plan to make America great again is to reduce the American trade deficit.
The trade balance is essentially the difference between the imports and the exports of any country. If the trade balance of a country is in negative territory, it is said to run a trade deficit, which the United States does.
Take a look Figure 1. It plots the American exports and imports from 1960 onwards.
Figure 1:
Up until the early 1980s, the American imports were more or less equal to American exports. But things changed after that and America started running a trade deficit. Take a look at Figure 2. This plots the American imports and exports from 1980 onwards.
Figure 2:
In fact, take a look at Figure 3, which maps America’s imports and exports since 1990.
Figure 3:
One look at Figure 3 tells us that the import curve and the export curve closely map each other. What does that tell us? It tells us that the dollars earned by the countries which export goods and services to the United States (essentially imports for the United States), are used to buy goods and services being exported by the United States.
Hence, there is a clear link between the total imports and the total exports of the United States. So where does that leave Trump’s plan? As Peter Navarro, an economist known to be close to Trump, and who served as a policy advisor to the Trump campaign, puts it: “Trump proposes eliminating America’s $500 billion trade deficit through a combination of increased exports and reduced imports.” The trade deficit of the United States in 2015 stood at $500.4 billion.
So how does Trump plan to bring down imports? As his website puts it: “[He plans to direct] the Secretary of Commerce to identify every violation of trade agreements a foreign country is currently using to harm our workers, and also direct all appropriate agencies to use every tool under American and international law to end these abuses.”
Trump also plans to: a) Instruct the Treasury Secretary to label China a currency manipulator. b) Instruct the U.S. Trade Representative to bring trade cases against China, both in this country and at the WTO. China’s unfair subsidy behaviour is prohibited by the terms of its entrance to the WTO. c) Use every lawful presidential power to remedy trade disputes if China does not stop its illegal activities, including its theft of American trade secrets – including the application of tariffs consistent with Section 201 and 301 of the Trade Act of 1974 and Section 232 of the Trade Expansion Act of 1962. (Source: https://www.donaldjtrump.com/policies/trade)
Trump plans to impose import duties (i.e., tariffs) in order to ensure that the cheap Chinese imports into the United States, no longer remain cheap. CNN reported in late December 2016: “President-elect Donald Trump’s transition team is discussing a proposal to impose tariffs as high as 10% on imports, according to multiple sources.”
This is not going to be so straightforward. If Chinese imports into the United States become expensive, the consumer price inflation in the United States is likely to go up, given that American citizens will have to buy more expensive American products. Also, a clamp down on imports in general and Chinese imports in particular, will lead to countries earning fewer dollars. This means that they will have fewer dollars to imports goods and services from the United States. Hence, a fall in US imports will also lead to a fall in US exports. Hence, the trade deficit may not differ much from its current levels.
Over and above this, if the United States imposes import duties other countries can do the same. This will impact US exports as well. Hence, it is important to understand there is a positive correlation between US imports and US exports. While the US maybe the global bully, China isn’t exactly a pushover.
There is another point that needs to be made here. A huge portion of the dollars earned by countries by exporting goods to the United States and other parts of the world, has made its way back into financial securities issued in the United States. This includes US government bonds. This money has been one of the reasons which has kept interest rates low in the United States.
As of end of November 2016, foreign investors held $5.94 trillion worth of US government bonds (or treasuries as they are better known as). Of this China held close to $1.05 trillion worth of bonds. The point being that if US pushes its luck too far with China, China always has the option of dumping these bonds and pushing up bonds yields and in the process interest rates in the United States. While, it may never come around to doing so, it still has the option. And the United States understands this. Hence, bullying China won’t be easy.
Where does all this leave us? It brings us to that term post-truth. The term post-truth politics has been used quite a lot in the recent past, with the rise of Donald Trump in the United States. It was first used by the blogger David Roberts in 2010.
As Emma Kilheeney writes in Politics e-Review edition for October 2016: “Roberts coined the term to describe a situation in the US Congress where the Republican Party made no attempt to win support for its policy decisions by providing evidence-based arguments. Instead, it opposed all policies put forward by the Democratic Party in order to exploit the emotional responses and loyalties of its followers.”
The Economist defines post-truth as “a reliance on assertions that “feel true” but have no basis in fact.” Hence, the assertion that Trump will decrease US imports and increase US exports may feel to be true, it has no basis in logic and facts.
Oil prices have been falling for a while now. The price of the Indian basket of crude oil as on December 10, 2014, stood at $63.16 per barrel. At the beginning of this financial year, as on April 1, 2014, the price had stood at $104.56 per barrel. Hence, prices have fallen by close to 40% since then. Analysts expect that oil prices will continue to remain low in 2015. In a report titled 2015: It Likely Gets Worse Before It Gets Better analysts at Morgan Stanley give three possible scenarios for the price of oil. In the worst possible scenario they expect the price of oil to touch $43 per barrel in the second quarter of 2015 (i.e. the period between April and June 2015). As the Morgan Stanley analysts write: “ With OPEC on the sidelines, oil prices face their greatest threat since 2009…Without intervention, physical markets and prices will face serious pressure, with 2Q15[April to June 2015] likely marking the peak period of dislocation.” As I have explained on previous occasions the Saudi Arabia led Organization of the Petroleum Exporting Countries(OPEC) is interested in driving down the price of oil to ensure that shale oil firms operating in the United States and Canada become unviable. This is why OPEC hasn’t cut oil production majorly in recent months, even though oil prices have fallen dramatically. The conventional thinking is that a fall in oil prices will benefit India tremendously. A major reason for the same is that India imports nearly four fifths of the oil that it consumes. Hence, a fall in oil prices will mean that there will be lower oil imports and this will mean a lower trade deficit (i.e. the difference between imports and exports). Further, lower oil prices will also mean lower inflation and a lower fiscal deficit for the government. Fiscal deficit is the difference between what a government earns and what it spends. In the years gone by, the government did not allow the oil marketing companies to sell diesel, cooking gas and kerosene oil, at a price that was viable for them. The government compensated these companies for a part of the under-recoveries. This led to the government expenditure shooting up which pushed up the fiscal deficit. While this sounds good in theory, things are not as straightforward as they are made out to be. Neelkanth Mishra and Ravi Shankar of Credit Suisse discredit this argument in their recent research report titled 2015 Outlook: Growth at any price? Let’s look at these points one by one. The government had budged Rs 63,426.95 crore as oil subsidy for this financial year. This as always has been the case in the past was a very optimistic assumption, given that a significant part of the oil subsidies for the last financial year were unpaid. The oil subsidies that had not been paid for during the course of the last financial year amounted to Rs 35,000 crore. This has been paid from this year’s budget. Given this, despite a dramatic fall in oil prices there isn’t going to be a huge impact on the fiscal deficit. If oil prices continue to remain low during the course of the next financial year (April 2015 to March 2016) it will benefit the government on the fiscal deficit front, feel the Credit Suisse analysts. What about inflation? Petrol and diesel together make up for around 2% of the consumer price index. Over and above this, the government has raised the excise duty on petrol and diesel twice in the recent past. This has reduced the “passthrough to consumer prices”. Hence, consumers haven’t benefited as much as they should have. Further, “LPG[domestic cooking gas] and kerosene, which have higher weights[in the consumer price index],are still subsidised, so the fall in crude will not directly impact retail prices,” write Mishra and Shankar. Now let’s look at the trade deficit or the difference between imports and exports. Oil imports in the month of October 2014 fell by 19% to $15.2 billion in comparison to the same period last year. Despite this, the overall trade deficit for the month rose to $13.3 billion from $10.6 billion a year ago. Why is that the case? With global growth slowing down, exports slowed down by 5% to $26 billion. Further, India seems to have rediscovered its appetite for gold with gold imports rising by 280% to $4.17 billion from $1.09 billion in October 2013. So, despite falling oil prices India may not gain much immediately. Also, falling oil prices mean lower incomes for oil exporting countries and this will slow down their consumer demand, which will have an impact on Indian exports. Professor Eswar Prasad of Cornell University explained this in an interview to CNBC. As he said: “Right now if oil goes to USD 65 or even slightly lower it is not a big negative but it does imply that there is going to be a lot of weakness in external demand and countries in Latin America like Venezuela which already have a very difficult situation, emerging markets like Russia and of course the Middle Eastern countries plus some of the European economies like the UK and Norway that rely on oil exports to a significant extent are going to be facing fairly difficult situations. This will affect their budgets and their current account balances which in turn will affect their consumption demand. So, softness in consumption demand is ultimately not good for anybody in the world including India.” Neelkanth Mishra of Credit Suisse also made a similar point in an interview to The Economic Times. Mishra’s argument was that if oil exporting countries earn lower, their sovereign wealth funds will invest a lower amount of money in other countries, including India. As he said: “Further, capital flows get impacted, too — if you look at the sources of funds that invest in India, it’s primarily the sovereign wealth funds (SWFs), the pension funds and the insurance funds. If Norway, Saudi Arabia, Abu Dhabi, Qatar, or Kuwait are not going to see the kind of surpluses that they used to then they will have less capital to send out, which will mean that capital flows into India will not be as strong as they were.” Norway, Abu Dhabi and Saudi Arabia run the three biggest sovereign wealth funds in the world. To conclude, what these points clearly tell us is that a fall in oil prices will not benefit India as much as it is being made out to be.
 This is the third and the final column in the series, where I explain that Donald Trump’s idea of making America great again, by imposing tariffs, is not going to work.


 The Figure 2 shows that the trade deficit that the United States runs with the world at large has fallen in the aftermath of the financial crisis. This essentially means that the difference between what the United States is importing from the world and what it is exporting to the world, has come down.
 It tells us that the trade deficit that the United States runs with China, makes up for a greater proportion of the overall trade deficit, than it did before. In 2015, the trade deficit with China made up for 73.4 per cent of the overall trade deficit. In comparison, in 2000, the figure was just at 22.5 per cent.
 One look at Figure 4 tells us that the import curve and the export curve closely map each other. What does that tell us? It tells us that the dollars earned by the countries which export goods and services to the United States (essentially imports for the United States), are used to buy goods and services being exported by the United States. As Duncan puts it: “Over the past 35 years, that deficit has become THE driver of global economic growth. In fact, the entire global economy has been constructed around unbalanced trade.” So, what will happen if Trump makes it difficult for the United States to import stuff from