IMF Says India Will Be Fastest Growing Economy in 2021, And That’s Good News, But…

The International Monetary Fund (IMF) in the World Economic Outlook update for January 2021, has forecast that the Indian economy will grow by 11.5% in 2021.

If this happens, it will be the fastest that the Indian economy has ever grown. It will also be the first time that the Indian economy will grow in double digits. (Actually, the country did grow by greater than 10% in 2010-11, but that was later revised by the Modi government, once a new set of gross domestic product (GDP) data was published).

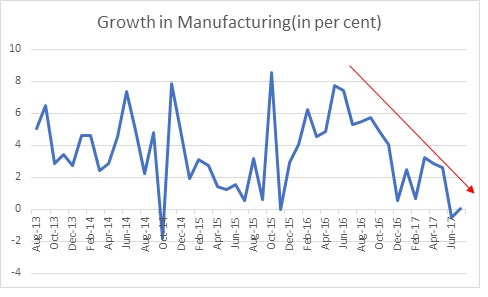
The following chart plots the GDP growth over the years. The GDP is the measure of an economic size of a country.

Source: Centre for Monitoring Indian Economy.

It is interesting that the Indian GDP has grown by more than 9% only twice previously, and both these occasions were before the 1991 economic reforms. The economy grew by 9.15% in 1975-76 (post the first oil shock) and 9.63% in 1988-89. Post 1991, the country grew the fastest in 1999-00 when it had grown by 8.85% (after the American sanctions).

Also, among the selected economies for which IMF published data, India will be the fastest growing economy in the world in 2021. China comes in second at 8.1%.


Source: International Monetary Fund.

India growing by 11.5% in 2021 is indeed a big deal, there is no denying that. But there are a few factors that need to be kept in mind here.

First and foremost is the base effect. Before I go into highlighting the base effect in this context, let’s first understand what it means.

Let’s say the price of a stock in 2019 was Rs 100. In 2020, it falls by 50% to Rs 50. In 2021, it is expected to rise to Rs 75. This means a gain of Rs 25 or 50% per share. If we just look at prices of 2020 and 2021, the stock has done fantastically well and gained 50%.

But what we also need to keep in mind is the stock price in 2019, when it was at Rs 100. It then fell massively by 50% to Rs 50 and rose from there. Hence, the stock price rose from a much lower-base. And this lower base was responsible for a gain of 50%. Further, in 2021, the stock continued to be lower than its 2019 price. This is base effect at play.

One way to look at base effect is to look at the GDP growth/contraction forecast by IMF for 2020.

Source: International Monetary Fund.

As can be seen from the above chart, the IMF expects the Indian GDP to have contracted by 8% in 2020. Hence, in 2020, the Indian economy will be among the worst performing economies in the world. Given this, a 11.5% growth in 2021, will come on a massively contracted GDP in 2020. This is a point that needs to be kept in mind.

Also, all the countries which have done worse than India have a per capita income larger than that of India. In that sense they are economically much more developed than India is and their pain of contraction is much lesser than that of India, given that these countries already have access to the most basic economic necessities in life, which many Indians still don’t.

Let’s go into a little more detail on this point. While the IMF publishes real GDP growth data (which we have been discussing up until now), it doesn’t publish constant price GDP, which adjusts for inflation, in a common currency like the US dollar.

To get around this problem, let’s use the constant price GDP data published by the World Bank. On this we apply, the  GDP contraction/growth rates as forecast by the IMF. As per the World Bank, the Indian GDP in 2019 (in constant 2010 $) was $2.94 trillion. In 2020. A contraction of 8% in 2020 would mean a GDP of $2.70 trillion in 2020. A 11.5% rise on this would mean that the Indian GDP is expected to touch $3.01 trillion in 2021, which is around 2.4% better than the GDP in 2019.

Hence, in that sense, the slowing Indian economic growth for the last few years, followed by the covid contraction, has put the Indian economy back by two years. Of course, it can be argued that every country has gone through this. Indeed, that’s true, but that doesn’t make our pain any better.

Also, before saying stuff like India will grow faster than China in 2021, please keep in mind the fact that the Chinese GDP in 2019 was $11.54 trillion (World Bank data), which is much more than that of the India’s GDP.

In 2020, the Chinese economy was expected to grow by 2.3%. This means that the Chinese GDP in 2020 would have grown to $11.81 trillion. In 2021, the Chinese GDP is expected to grow by 8.1% to $12.76 trillion. This means an increase in GDP of $0.95 trillion in just one year. If we compare this increase with the expected Indian GDP of $3.01 trillion in 2021, what it means is that China will end up adding 31.6% of the India’s economy in just one year. Or to put it simply, China will add a third of India’s economy in just one year.

It also means that between 2019 and 2021, the Chinese economy is expected to grow by $1.22 trillion ($12.76 minus $11.54 trillion). During the same period, the Indian economy is expected to grow by $ 0.07 trillion ($3.01 trillion minus $2.94 trillion). Please keep these facts in mind before saying that in 2021 India will grow faster than China.

Between 2019 and 2021, the gap between India and China has grown even bigger and that is a fact that needs to be kept in mind. All numbers and figures need some context, otherwise they are useless and as good as propaganda, which I think will happen quite a lot during the course of the day today.

If you have already read the newspapers and the websites on this issue, you might have seen that almost all of them say that India will grow faster than China in 2021. But almost  no one bothers to mention the fact that China grew faster than India both in 2019 and 2020. Or the fact that China is growing on a significantly larger base (the most important point when we are talking percentages).

At the risk of repetition, you won’t see any such analysis appearing in the mainstream media. So, kindly continue supporting my work. Even small amounts make a huge difference.

What a Mumbai Real Estate Agent Can Tell You About Indian Economy Contracting

Koi yahan aaha naache naache,
Koi wahan aahe naache naache.

— Usha Uthup, Faruk Kaiser, Bappi Lahiri and Babbar Subhash (better known as B Subhash), in the Disco Dancer

The gross domestic product (GDP) figures for the period July to September 2020 were published yesterday. The GDP is a measure of the economic size of a country during a particular period. The Indian GDP or the economic size of the country during the period contracted by 7.54%  against the same period last year.

This looks very good in comparison to the contraction of 23.92% that the economy had seen during the period April to June 2020 and has led to the uncorking of the bubbly among a certain set of politicians, economists, analysts, journalists, stock market wallahs and Twitter warriors.

Of course, there is no denying that a contraction of 7.54% is a lot better than a contraction of 23.92%, one would be a fool to deny that. But has the time to uncork the bubbly come? Or, if you are not the drinking type, should we be high-fiving on this one?

Let’s take a look at this pointwise.

1) For much of the period between April to June, the economy was under a lockdown. Once the economy was opened up, things were bound to improve. Hence, a better performance in July to September should not come as a surprise. Second, the period benefitted because of a lot of pent up demand. People who could not buy the stuff they wanted to during April to June, ended up buying it between July to September. These points need to be kept in mind.

2) The economists were expecting a contraction of 8.5-9% during the quarter. Against that a contraction of 7.54% looks just about a little better. Having said that, India has a large unorganised sector. Measuring the value added by the unorganised sector is never easy. Hence, when releasing GDP data for a period of three months for the first time, the National Statistical Office (NSO) essentially proxies the value added by the informal sector using formal sector data. This is set right as data streams in over a period of time.

Over and above this, we are in midst of a pandemic and hence, collection of data isn’t easy. As the NSO points in its release: “Some other data sources such as GST, interactions with professional bodies etc. were also referred to for corroborative evidence and these were clearly limited.”

What this means is that the GDP data presents a picture which is rosier than the actual picture.

3) There is another important point that needs to be made here. India has been publishing quarterly GDP for close to 24 years now. This is only the second time in all these years that the GDP during a particular period of three months has contracted. Only twice in 94 quarters has the economy contracted. And given that GDP has contracted in two consecutive quarters, India is in a midst of what economists call a technical recession. If the economy continues to contract in the months to come, it will enter a recession. That’s the difference between a recession and a technical recession.

Source: Centre for Monitoring Indian Economy.

4) In the period April to June with a contraction of 23.92%, India was the worst performing economy among the major economies in the world. From the data that is currently available on the OECD website, India is no longer the worst performing economy in the world, nonetheless, it continues to be among the worst performing economies in the world.

Source:  https://stats.oecd.org/index.aspx?queryid=350

5) A major surprise in the GDP data has been the recovery of the manufacturing sector. The sector grew by 0.62%, after contracting (or degrowing as analysts like to say) by 39.30% between April to June. While this is good news, it goes against the fact that index of industrial production contracted by 6.09% during July to September. If the production has contracted how has the growth come about? The growth has come primarily from the fact that companies in the listed space have been able to increase their profit margins primarily because of controlling costs, this includes firing employees and slashing their salaries.
As economist Mahesh Vyas recently wrote in a column: “In the September 2020 quarter, while sales fell again by 9.7 per cent, profits sprang a surprise by scaling up by a handsome 17.8 per cent. Yet, wages declined by one per cent. Evidently, companies do not apportion resources to labour in any proportion of profits.”

6) Sectors like construction, mining as well as services continued to remain weak, though better than they were during April to June. These sectors are high employment sectors. This remains a worry given that what seems to be happening currently is a recovery which isn’t creating enough jobs. In fact, financial services, real estate and professional services (bundled together for some reason in the GDP data) contracted by 8.09% during July to September. It had contracted by 5.33% during April to June. And that can’t possibly be a good thing. This can also be seen under NREGA data where demand for jobs this year remains astonishingly higher than last year. It can also be seen in the labour participation rate contracting with people stopping to look for jobs because they are unable to find one, and hence, dropping out of the workforce.

It also needs to be said here if there is a second round of covid, as is being feared, the services sector will continue to remain weak, in particular services like restaurants, hotels, tourism, cinema halls, malls etc.

7) If we look at GDP from the expenditure side, the private consumption expenditure contracted by 11.32% against a contraction of 26.68% between April to June. Clearly, there has been improvement on this front. Nevertheless, private consumption expenditure forms more than half of the Indian economy, and as long as it continues to remain weak, the economy will continue to remain weak. Also, we need to remember that the contraction of 11.32% happened despite pent up demand and festivals in the Western and Southern part of the country. Further, the fact that private consumption has continued to contract, brings into question the growth in the manufacturing sector. Are actual sales happening at the consumer level or is this simply a case of a  build-up of inventory, as has been the case in the auto industry?

8) This is a slightly technical point but still needs to be made. On the expenditure side, the GDP is calculated as a sum of private consumption expenditure, investment, government expenditure and net exports. Net exports is exports minus imports. In the Indian case, this is a negative entry into the GDP figure, given that exports are usually less than imports. During July to September, net exports is a positive number, given that imports are lower than exports, having fallen by a much higher rate. This is primarily because of a collapse in consumer demand, which is not a good thing. When it comes to the goods part of imports, the non-oil non-gold non-silver part of imports collapsed by 23.82% during July to September. This helped push up the GDP number.

9) The GDP has contracted by 15.67% during the first six months of the year. If the economy contracts by 3-5% during the second half of the year, we still are looking at 9-10% contraction this year. This was largely the consensus forecast made for this year. Even if there is no contraction in the second half of the year, the economy will still contract 7.66%, which will make India one of the worst performing economies in 2020-21. Also, we need to remember that the GDP of 2019-20 is likely to be crossed now only in late 2021-22 or 2022-23. So this pushes the Indian economy back by at least two years. Of course a lot of it is because of covid, but let’s not forget, the Indian economy had been slowing down even before the pandemic struck.

10) Let me close this piece with a little story. Sometime in April 2006, I first started to look for a flat to rent, in Mumbai. Of course, one had to go through agents. Pretty soon, I realised that the agents were trying a psychological trick on me. They first showed me a flat which was in a very bad state. They would then show me something which was slightly better. Nevertheless, the difference in rent between the flat was much more than the difference in their quality, with the rent of the second flat being much more than the first one. I caught on to this because I had read this book called Freakonomics sometime in 2005. The book had an extended chapter on the contrast effect.

We all tend to compare things before making a decision. Given this, the attraction of an option can be increased significantly by comparing it to a similar, but worse alternative. This is known as the ‘contrast effect’.

How does this apply in the present context? It’s simple. The fact that the Indian economy contracted by a massive 23.92% during April to June, it makes a contraction of 7.54% during July to September, much better. But there are many nuances, as explained above, that need to be taken into account.

PS: My writing has been highly irregular over the last few weeks. I was busy with a project I had taken on. Now that I am done with it, will write more regularly.

The Curious Case of the Indian Festival Season

Summary: Does the Indian economy actually have a festival season when it comes to consumption? 

I recently did a long story for the Mint where I elaborated on why this festival season isn’t going to rescue the Indian economy.

One of the questions I originally wanted to explore in the piece was whether the so-called festival season actually has an impact on the overall economic growth or is it simply a marketing gimmick, like many other things. I couldn’t get into it for lack of space and hence, have decided to explore this separately here.

The festival season is defined as the period between October and December which typically has festivals like Dussehra, Diwali and Christmas, among other festivals. This is believed to be an auspicious period for making purchases, particularly the period between Navratri and Diwali.  Of course, there are many big festivals that do not happen during this three-month period, like Ganesh Chaturthi, Holi etc. (Even Dussehra can sometimes fall towards the end of September).

As a 2018 research note published by the rating agency Crisil points out: “Indeed, in the last ten years, around 30% of two-wheeler sales has come in the festive months.”  Over and above this, industry estimates suggest that 35-40% of sales of consumer durables in particular electronic products, happens during the festival season.

Hence, in the run-up to this period, corporates are typically very confident about how festival season sales will perk up the overall economy. And this year, as I explained in my Mint piece, has been no different on that front. This grandstanding has only increased over the last few years as the economy has gone downhill. The corporates need to say something positive to keep the media interested and this is what they come up with. Come festival season, and all will be well. Of course, I am making this a tad simplistic, but I hope you do get the drift.

There is a simple way of checking out whether the so-called festival season has a marked impact on economic growth and whether growth during these three months is higher than the growth during the remaining part of the year.
India started declaring quarterly gross domestic product (GDP) data from 1996 onwards. Hence, GDP growth data is available from April-June 1997, a year later. GDP is a measure of the economic size of a country.

Between April to June 1997 and April to June 2020, we have 93 counts of GDP growth data, with 23 counts of the October to December period. In three years out of the data for 23 years that we have, the economic growth has been the fastest during the October to December period, in comparison to the remaining parts of the year.

Also, the three instances where before 2011, in 2001, 2003 and 2010, when the economy during the period grew by 6.3%, 11.2% and 10.7%, respectively. So, clearly on the whole, there is no evidence to suggest that the economy grows faster during the so-called festival season vis a vis the remaining parts of the year. And there is nothing in the last decade.

While, the economy may not grow faster during the festival season, that is no reason to believe that the private consumption part of the economy doesn’t grow faster during this period than other periods.

One of the methods to calculate the GDP is private consumption expenditure plus government expenditure plus investment plus net exports (exports minus imports). Private consumption expenditure, the stuff you and I buy to keep our lives going, over the years has formed the biggest part of the GDP. Data from the last 24 years shows that it typically tends to oscillate between 55-60% of the economy. On rare occasions it goes above 60% or falls below 55% (as it has during the period April to June 2020).

There are seven instances in the growth data of 23 years that is available, where private consumption expenditure has grown faster during the festival season than other periods. Three of these instances are between December 1996 and December 2010 and four after that. What this means is that around 30% of the time in the last 23 years, the festival season consumption growth has been the fastest during the year.

While, this is better than overall growth, it is not definitive evidence. Let’s look at something specific like domestic two-wheeler sales and see if companies end up selling more two-wheelers during the festival season than any other time of the year.

We have quarterly two-wheeler data going as far back as April to June 1991, that is for a period of 29 years. In eight out of these 29 years, two-wheeler sales were the most during the festivals season than other parts of the year. This works out to 27.6%. The interesting thing is that the sales during the festival season were the highest in each of the years from 2002 to 2007. This makes for six out of the eight instances. There have been only two instances in the 2010s, in 2012 and in 2013, and no instance in the 1990s.

What more data can we check? Let’s look at domestic car sales. There are two instances (2015 and 2019) where cars during the festivals season have outsold the other periods, in the last 29 years. Clearly, cars don’t have a festival season.

Ideally, I would have liked to look at the data for electronic products (washing machines, phones, TVs, ACs, etc.) as well. But data for such products isn’t really publicly available.

From what is publicly available we can conclude that the evidence for there being a festival season for Indian consumption is at best weak. In fact, when it comes to car sales, evidence for many years suggests that most cars actually sell during the period January to March.

So, the question is why do corporates keep talking about festival season sales? In the past few years, as the economy has gone downhill, it is a good way to sell hope which the media and the people reading and watching the media, are desperately looking for. (For all you guys who keep asking we know the problems, give us the solutions, this is for you).

One sector which has used this strategy over and over again, over the years, is the real estate sector. Come August and you will start seeing the gurus of this sector telling the media that Diwali sales are going to perk up. But what has happened instead, at least over the last half a decade is that the number of unsold homes has gone up and at the same time the total amount of money that the real estate sector owes to the banks has gone up as well. Of course, it hasn’t defaulted as yet, primarily because the Reserve Bank of India has come to its rescue and changed regulations.

For the media the belief in the festival season makes sense because it tends to drive up advertisements which it badly needs.

To conclude, even if there are sectors that benefit because of the festive season, it doesn’t translate into overall consumption and economic growth, that much is a given. The reason for the same can lie in the fact that while people increase consumption of a few things, they cut down on consumption of other things to maintain a sense of balance. But that is just an explanation, I really have no evidence of the same.

PS: For all you marketing and economic researchers out there, this might be an interesting topic to explore, using a more robust methodology than what I have used here.

In April to June 2021, India May Grow by 15-30%, But We’ll Still Be Catching Up

Summary: Base effect – The collapse in GDP during the April to June 2020 is going to make the GDP growth during April to June 2021 look fantastic.

I want to make a prediction here. And this is a fairly easy one.

A year from now, in early September 2021, you will see a spate of WhatsApp forwards and social media posts, which will say that India is the fastest growing large economy in the world.

And unlike most other times, when WhatsApp forwards and the social media are either trying to outrightly lie and if not that, then at least trying to mislead, this time around they will be 100% correct.

Of course, this grand success will be attributed to the greatness of the current government. And that’s where the misleading part will come in again.

All that will happen is the base effect will come into play. Now what’s the base effect? Instead of me giving you a definition and confusing you, let’s try and understand this in some detail, but in a simple way.

For the period April to June 2020, the Indian gross domestic product (GDP), a measure of economic size, was at Rs 26.9 lakh crore. This was 23.9% lower than the GDP during the period April to June 2019, which was at Rs 35.4 lakh crore. Hence, the GDP came down by a massive Rs 8.5 lakh crore.

The major reason for this was the massive contraction of 26.7% in private consumption, in comparison to April to June 2019. Over and above this, the investment in the economy contracted by 47.1%.

Given that consumption and investment are two major parts of the economy, it is hardly surprising that the economy contracted by as much as it did.

Nevertheless, as the economy opens up and people gradually go back to doing things like they always used to, the private consumption number is bound to improve gradually. The investment in the economy will also go up albeit at a much slower pace.
The reason for this lies in the fact that even before covid struck, the Indian industry had excess capacity and the capacity lying idle has gone up post covid.

This will ensure that the GDP figure for the current and the next two quarters will improve. By the time April to June 2021 comes around India will be in growth territory and that too a massive one.

The GDP during April to June 2021 is bound to be much more than the GDP during April to June 2020 (unless there is a lockdown of similar proportions). This is where things get interesting.

Let’s see what the GDP growth in April to June 2021 is likely to be at various levels of GDP in comparison to the GDP of Rs 26.9 lakh crore in April to June 2020. The chart plots various scenarios.

Up, up and away 

Source: Author calculations and National Statistics Office.

As can be seen from the above chart, the GDP growth figure is likely to be very high for the period April to June 2021.

If the GDP were to recover to Rs 30 lakh crore, the growth will be 11.5%. But in absolute terms we will still be where we were in April to June 2016, when the GDP was at Rs 29.7 lakh crore. So, we will be around five years behind.

If the GDP were to recover to Rs 31 lakh crore, the growth will be 15.2%. But in absolute terms we will still be where we were in April to June 2017, when the GDP was at Rs 31.4 lakh crore. So, we will be around four years behind.

If the GDP were to recover to Rs 32 lakh crore, the growth will be 19%.

If the GDP were to recover to Rs 33 lakh crore, the growth will be 22.7%.

If the GDP were to recover to Rs 34 lakh crore, the growth will be 26.4%. But in absolute terms we will still be where we were in April to June 2018, when the GDP was at Rs 33.6 lakh crore. So, we will be around three years behind.

If the GDP were to recover to Rs 35 lakh crore, the growth will be 30.1%. But in absolute terms we will still be where we were in April to June 2019, when the GDP was at Rs 35.4 lakh crore. So, we will be around two years behind.

In exact terms, India needs to grow by greater than 31.6% in April to June 2021 to be able to cross where we were in April to June 2019. Even in the most optimistic scenario, covid has probably cost us two years of growth.

Hence, the growth in April to June 2021 will look fantastic. And that’s simply because the GDP in April to June 2020 simply collapsed. This collapse will lead to the GDP growth April to June 2021 looking very good. And this, dear readers, is nothing but the base effect at play. Also, if the GDP figure for April to June 2020 gets revised downwards, as it is likely to be, then the growth figure will look even better.

Given this, the GDP growth numbers during 2021-2022, the next financial year, will have to be taken with a pinch of salt. The numbers from April to June 2022 onwards will tell us the real story about economic growth being back on track or not.

Of course, given that most of us do not understand basic fifth standard mathematics or simply choose to ignore it, we will buy into this massive double-digit growth story.

Yes, we did it. It’s always been more fun to believe in rhetoric than use the brain. And a year down the line in history isn’t going to change that.

Modinomics, meet the industrial slowdown!

narendra modi
The Prime Minister, Shri Narendra Modi addressing the Nation on the occasion of 71st Independence Day from the ramparts of Red Fort, in Delhi on August 15, 2017.

The index of industrial production (IIP) figures declared earlier this week, portray a worrying picture of the overall Indian economy. The IIP is a measure of industrial activity in the country.

For the month of July 2017, the IIP grew by 1.2 per cent in comparison to July 2016. In June 2017, it had contracted by 0.2 per cent. While, there has been some improvement month on month, the overall trend of the IIP growth has been down for a while. Take a look at Figure 1, which basically plots the IIP growth (or contraction for that matter) over the last four years.

Figure 1:


As is clear from Figure 1, for more than a year now, the overall trend of IIP growth in the country has been downward. This is a clear indication of a slowdown in the growth of industrial activity.

One of the ways through which IIP is measured is referred as economic activity based classification. As per this method, manufacturing accounts for 77.6 per cent of the IIP. And if things for overall IIP have been bad, they have been worse for manufacturing. Take a look at Figure 2, which basically plots the growth (and contraction) in manufacturing over the last four years.

Figure 2:

modinomics
Source:  Ministry of Statistics and Programme Implementation.

What does Figure 2 tell us? The manufacturing scene in the country doesn’t look great. In July 2017, manufacturing grew by just 0.1 per cent, after having contracted by 0.5 per cent in June 2017. This is a trend that was also visible in the gross domestic product (GDP) data released in late August 2017. Let’s take a look at Figure 3, which plots the growth rates of industry and manufacturing using GDP data, over the last four years.

Figure 3:

Figure 3 clearly tells us that the growth in industry and manufacturing as per the GDP data is at a four-year low. For the period April to June 2017, industry and manufacturing grew at 1.6 per cent and 1.2 per respectively, in comparison to the same period last year.

What does this mean for the overall economy? Industry has formed around 29-31 per cent of the GDP over the years. The fact nearly one-third of the economy is barely growing should be a big reason for worry. This will impact economic growth in both direct and indirect ways. If one-third of the economy barely grows, overall economic growth is bound to slowdown. That is the direct impact.

What about the indirect impact? In order to understand this, we need to figure out how many people actually work for industry. In 2009-2010, the industry as a whole employed around 9.9 crore individuals. Analysts, Nikhil Gupta and Madhurima Chowdhury, who work for stock brokerage Motillal Oswal, in a recent research note using data from the 2014-2015 Annual Survey of Industries, state: “Over the past 35 years, employment in Indian industrial sector has grown at an average of ~2%.” The actual figure is 1.9 per cent per year.

Hence, employment in the industrial sector tends to rise at the rate of 1.9 per year on an average. Using this, we can conclude that by March 2017, the total number of people working in industry would stand at around 11.3 crore. Further, the average Indian family has 5 people. Given this, around 55 crore individuals in a population of 130 crore or around 42 per cent of the population depend on income from industry, in one way or another. An if the industry is barely growing, these people will go slow on their consumption and other expenditure, and in the process slowdown overall economic growth. This is the indirect impact.

Why is this happening? The economic slowdown initiated by demonetisation is basically continuing. It is worth remembering that first and foremost is a medium of exchange. It is a token to carry out economic transactions. When you take 86.4 per cent of the currency in circulation out of an economy, where 80 to 98 per cent of the consumer transactions (in volume, and depending on which data source you take) is carried out in cash, economic transactions are bound to slowdown. And ultimately this is reflecting in the manufacturing data.

If there is slowdown in consumption, there is a bound to be a slowdown in manufacturing. If people are not buying stuff at the same pace as they were in the past, there is no point in companies increasing production like they were in the past.

The irony is that this crisis the Modi government brought upon us. Indeed, this is very worrying in a country where one million individuals are entering the workforce every month. That makes it 1.2 crore, a year. If the growth in industrial sector slows down to the level that it currently has, how will any jobs be created for these youth.

And that is a question worth asking.

The column originally appeared in Newslaundry on September 14, 2017.