The household financial savings, which form a bulk of the overall savings in the Indian economy, went up in 2019-20. This after they had fallen in 2018-19. The question is how did this happen and what does this mean for the Indian economy in the post-covid world? Mint takes a look.
What was household financial savings rate in 2019-20?
Household financial savings essentially refers to the savings of households in the form of currency, bank deposits, debt securities, mutual funds, insurance, pension funds and investments in small savings schemes. The total of these savings is referred to as gross household financial savings. Once the financial liabilities, that is, loans from banks, non-banking finance companies and housing finance companies, are subtracted from the gross savings, what remains is referred to as net household financial savings. The net household financial savings in 2019-20 rose to 7.7% of the GDP from 7.2% in 2018-19. This primarily happened because the liabilities fell from 3.9% of the GDP in 2018-19 to 2.9% in 2019-20.
What explains this uptick in household financial savings?
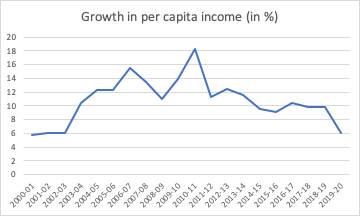
The gross financial savings of households in 2019-20 stood at Rs 21.63 lakh crore, marginally better than the gross savings in 2018-19 which was at Rs 21.23 lakh crore. Nevertheless, the net financial savings jumped to Rs 15.62 lakh crore in 2019-20 from Rs 13.73 lakh crore, a year earlier. This was primarily because the financial liabilities reduced from Rs 7.5 lakh crore to Rs 6.01 lakh crore. This pushed up net financial savings. Why did this happen? This happened primarily because the Indian economy has been slowing down from start of 2019. The per capita income in 2019-20 grew by just 6.1% (nominal terms, not adjusted for inflation), the slowest since 2002-03, when it had grown by 6.03%. How did slow growth in per capita income impact savings?
A double digit growth in per capita income has happened only once since 2013-2014. In 2016-17, the per-capita income grew by 10.39%. Over the last few years, income growth has slowed down, and in 2019-20, it slowed down dramatically to 6.1%. This has led to a slowdown in lending growth. The non-food credit growth of banks in 2019-20 was at 6.7%, the slowest in more than a decade. What does this tell about the overall state of the economy?
A slowdown in income growth has led to a slowdown in consumption as well as a slowdown in loan growth. What hasn’t helped is the weak financial state of non-banking finance companies, which has added to the lending slowdown. Also, this means that people were looking at their economic future bleakly, even before covid-19 had struck. At an individual level, the good part for them is that they tried to go slow on their borrowing in comparison to the past. But at the societal level, this hurt the economy because it led to a consumption slowdown. Where will the household financial savings settle in 2020-21?
The period between April and June will lead to higher savings. As a recent RBI research paper states, a spike in household financial savings “is likely in the first quarter of 2020-21 on account of a sharp drop in lockdown induced consumption.” In fact, this explains why bank deposit rates have fallen in the recent past. The money deposited with banks has gone up, while the banks are unable to lend. But this spike in savings is likely to taper in the months to come simply because of “lags in the pickup of economic activity”.
A slightly different version of the piece appeared in the Mint on June 15, 2020.
In the last one month, many people have asked me a simple question: “But what about bitcoins?”
Between 2013 and now, the price of a single bitcoin has gone from close to zero to more than $19,000. In fact, in 2017, the price of a bitcoin has gone from less than $1,000 to more than $19,000.
This astonishing price rise has been noticed by people. But before we go any further, let’s understand what is a bitcoin? It’s a digital currency that does not use banks or any third party as a medium. It is governed by a string of cryptographical codes that are not easy to break, as they are believed to be of military grade.
The law of demand basically states that demand for something tends to pick up when the prices are low. But this basic law in economics does not tend to apply to various forms of investments. This includes, stocks, real estate etc. A large bunch of people start entering the stock market only once it has rallied significantly. The same is true about real estate. Along similar lines, the bitcoin has caught the attention of people at large, only after having risen significantly in price. This is a point well worth remembering.
In late 2008, when the investment bank Lehman Brothers went bust, the Western world plunged into a serious recession. In order to come out of this, the Western central banks led by the Federal Reserve of the United States, the American central bank, decided to print a huge amount of money and pump it into the financial system.
The idea was to increase the supply of money and make it less costly, that is, drive down interest rates. At lower interest rates, people and corporations were more likely to borrow and spend money, and this in turn would help businesses and the overall economy.
At the same time, this power to create unlimited amount of money out of thin air created a fear that if central banks continued with this strategy, sometime in the future paper money would lose the ‘perceived value’ it had.
There was a fear that with such a huge amount of money being printed, it would unleash consumer price inflation, and money would lose value. While, that hasn’t happened, all the money has led to huge asset price inflation, stock markets and real estate markets have risen across the world, as a large chunk of the printed money has found its way into these markets.
Bitcoin was a response to this phenomenon given that unlike paper money it cannot be created out of thin air. The number of bitcoins is finite and it cannot go beyond a limit of 21 million. Hence, people initially bought into it. But, over the last year or two, at least, the people entering it are largely speculators looking to make a quick buck and that has driven up the price as fast as it has.
The trouble is the history of money essentially shows that, even though, all new forms of money are created by the private sector, they are ultimately taken over by the government. The government basically has three powers: 1) The right to “legal” violence. 2) The right to tax. 3) The right to create money out of thin air by printing it.
And this right to create money out of thin air comes from the basic fact that the people accept government money as money, in the economic transactions that they carry out. In the years to come, if economic transactions, that is the buying and selling of things, move towards bitcoins, the governments all over the world are not going to like it.
No government likes any competition against the pieces of paper that it deems to be money. And given this, the governments all over the world will want to crackdown on bitcoins sooner rather than later. What the believers in bitcoins like to say to this is that the virtual currency has been built with this eventuality in mind. How this plays out, only time will tell.
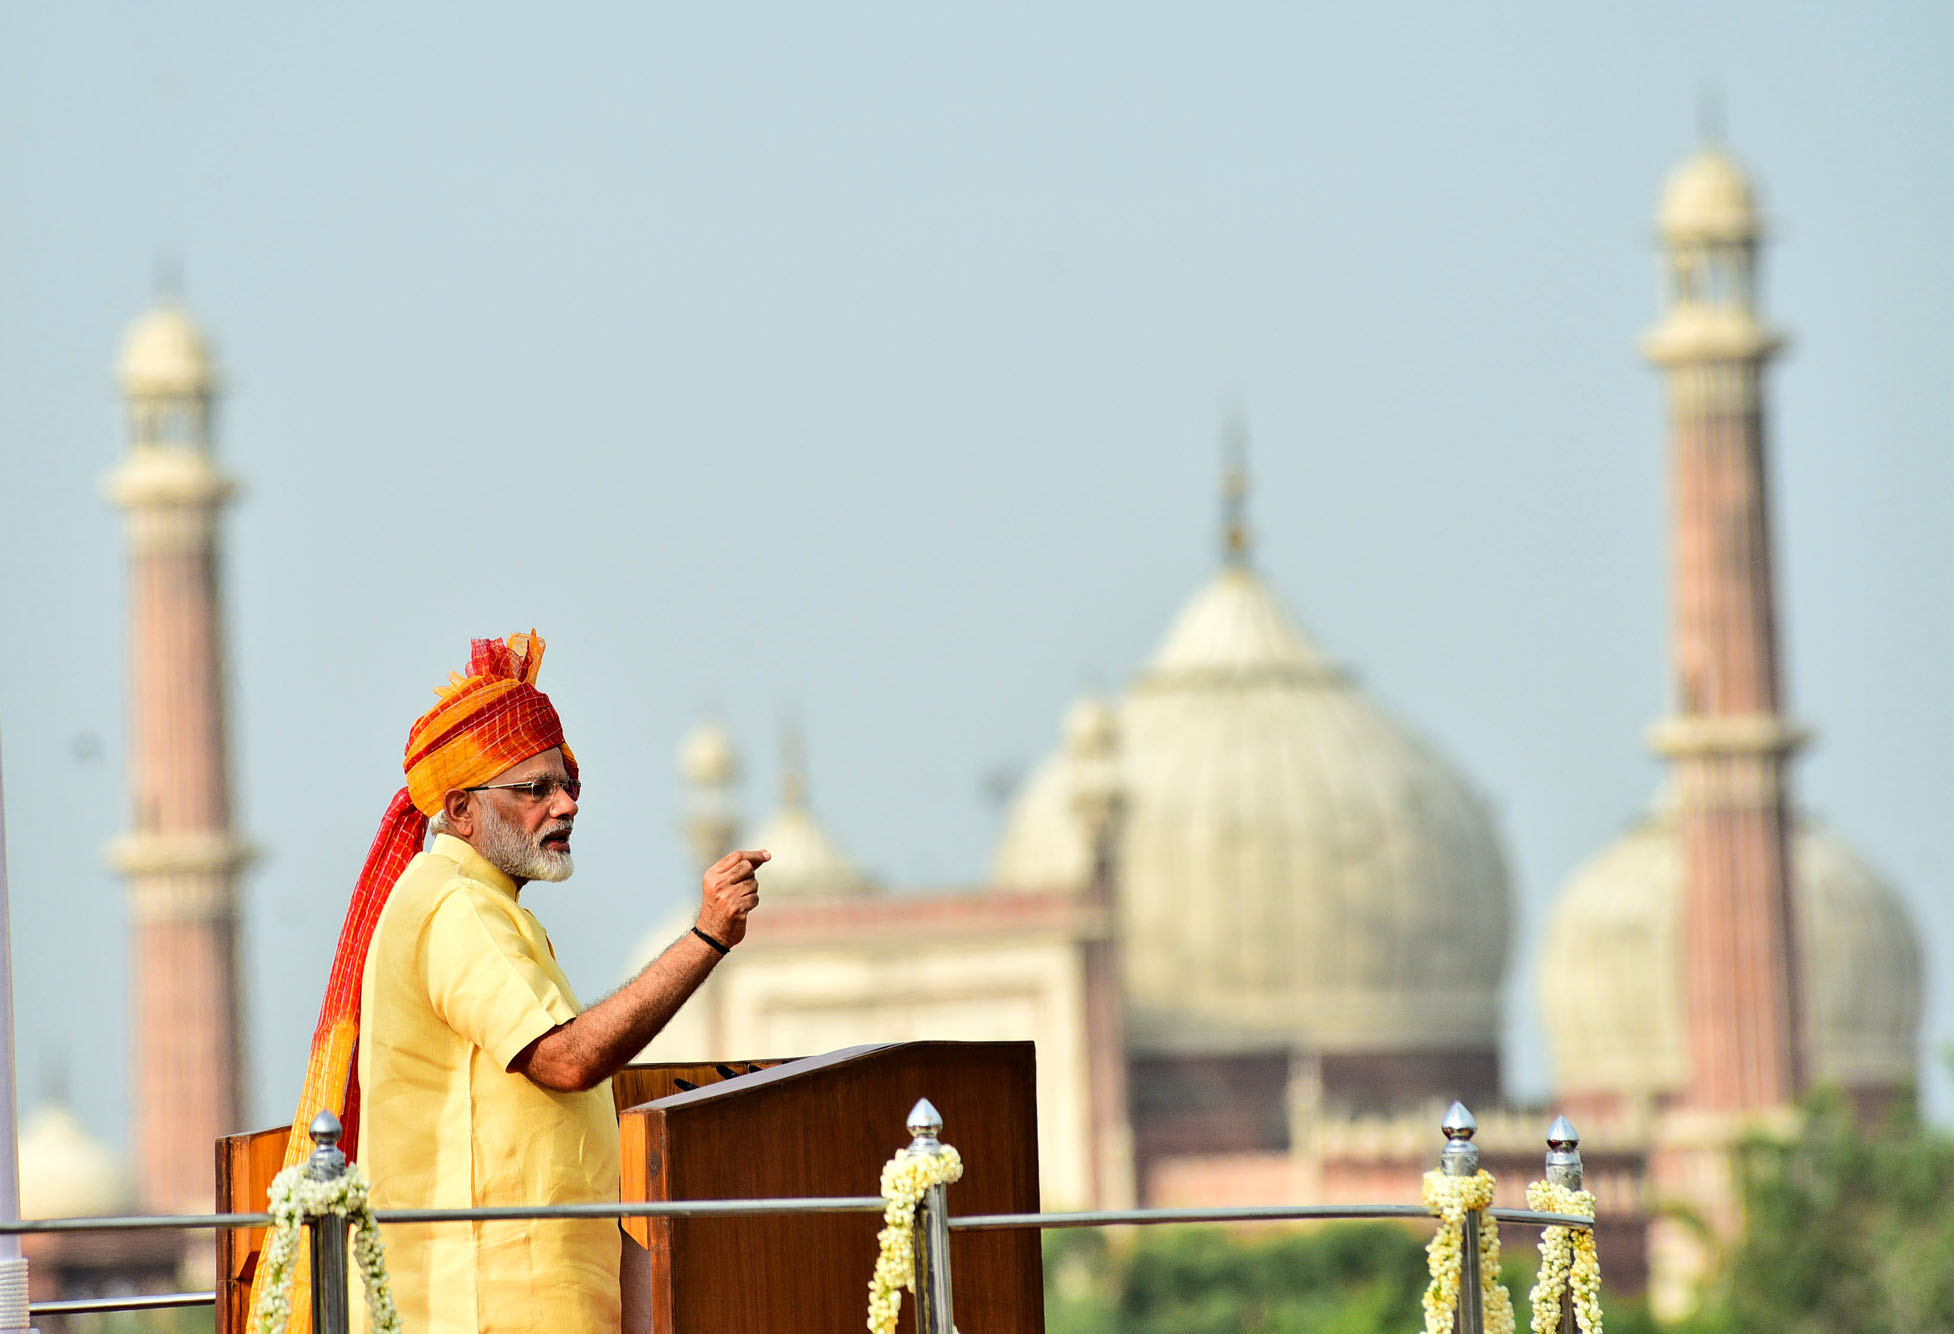
The Prime Minister, Shri Narendra Modi addressing the Nation on the occasion of 71st Independence Day from the ramparts of Red Fort, in Delhi on August 15, 2017.
In a speech last week, Prime Minister Narendra Modi, offered several data points to tell his fellow countrymen, that all is well with the Indian economy. And those who didn’t think so were essentially being needlessly pessimistic, he suggested.
Now only if he had bothered to look at data points beyond those he chose to offer, a totally different situation would have emerged. In this piece, I offer many data points to show that all is not well with the Indian economy.
1) Let’s start with the loans disbursed by banks during the course of this year. Let’s look at non-food credit to start with. These are the loans given out by banks after we have adjusted for food credit or loans given to the Food Corporation of India and other state procurement agencies, for buying rice and wheat directly from farmers at the minimum support price (MSP) for the public distribution system. Take a look at Figure 1.
Figure 1:
The Figure 1 clearly shows that the total amount of non-food credit given by banks during the course of this year has been in negative territory. This basically means that on the whole banks haven’t given a single rupee of a loan. The situation is the worse it has been in five years. Non-food credit consists of loans given to agriculture, industry, services and retail sectors, respectively.
Let’s take a look at each of these sectors.
2) Let’s take a look at Figure 2, which plots the loans given by banks to agriculture and allied activities.
Figure 2:
Loans given to agriculture and allied activities are in negative territory during the course of this year. Again, this basically means that on the whole banks haven’t given a single rupee of a loan to agriculture. In technical terms, their loan book to agriculture has shrunk. Is this possibly because of farm loans being waived off by state governments, that only time will tell.
3) Let’s take a look at Figure 3, which plots the loans given banks to industry.
Figure 3:
Figure 3 makes it clear that loans given to industry by banks continue to shrink. This isn’t surprising given the huge amount of bad loans accumulated by banks on lending to industry. Banks still don’t trust the industry.
4) Let’s take a look at Figure 4, which plots the loans given by banks to the services sector.
Figure 4:
This comes in as a major surprise, loans given to services have shrunk majorly during this financial year. Services constitute half of the Indian economy. If the firms operating in this sector are not interested in borrowing, then how can the Indian economy possibly be doing well?
5) Let’s take a look at Figure 5, which plots the retail loans given by banks during this financial year.
Figure 5:
Retail loans are the only loans which have been in positive territory during the course of this year. Nevertheless, they have been more or less at the same level over the last few years.
This, despite the fact that interest rates have come down dramatically. If people are not willing to borrow more even at lower interest rates, how can things be alright with the Indian economy, is a question well worth asking.
Sadly, Prime Minister Modi, did not include any of these data points in his speech and presentation.
6) The latest Consumer Confidence Survey of the Reserve Bank of India (RBI) for September 2017, states: “Households’ current perceptions on the general economic situation remained in the pessimistic zone for four successive quarters, with the outlook worsening… The employment situation has been the biggest cause of worry for respondents, with sentiment plunging further into the pessimistic zone; the outlook on employment has also weakened.”
7) Take a look at Figure 6, which plots the cement production over the years.
Figure 6:
Cement production is down this year, in comparison to the previous year. This tells us clearly that the construction and the real estate industry continue to be in trouble. These industries are huge employers of people, especially those who have low-skills.
8) The commissioning of new projects has slowed down. As Centre for Monitoring Indian Economy, which tracks this data, points out: “Projects worth Rs 512 billion were commissioned during the quarter ended September 2017. In the coming weeks this estimate is expected to rise. It could reach about Rs 700 billion. Even if this happens, this would be the lowest commissioning of projects during the Modi government’s tenure so far.”
9) There has been a fall in new investment proposals. As Centre for Monitoring Indian Economy, which tracks this data, points out: “Projects worth Rs.845 billion were proposed during the quarter ended September 2017. This is the lowest level of intentions to invest seen in a quarter during the tenure of the Modi government.”
10) There has been a huge fall in the profit of companies. As Centre for Monitoring Indian Economy points out: “We infer this and other related nuggets of information from the financial statements of 1,127 listed companies… Profit before taxes of these companies fell by 27.9 per cent over their level a year ago.”
11) Take a look at Figure 7, which plots the trade deficit or the difference between exports and imports.
Figure 7:
The trade deficit has jumped up majorly during the course of this financial year. This as I have explained beforehas primarily been on account of a jump in non-oil non gold non silver imports, in the aftermath of demonetisation. The unseen negative effects of demonetisation continue to impact the economy.
12) The growth in private consumption expenditure is at a six-quarter low. As the RBI Monetary Policy Statement pointed out: “Of the constituents of aggregate demand, growth in private consumption expenditure was at a six-quarter low in Q1 of 2017-18 [April to June 2017].”
13) As the RBI Monetary Policy Statement further pointed out: “India’s export growth continued to be lower than that of other emerging economies such as Brazil, Indonesia, South Korea, Turkey and Vietnam, some of which have benefited from the global commodity price rebound.”
14) Take a look at Figure 8 which plots the investment to GDP ratio.
Figure 8:
The investment to GDP ratio has improved a little in the period of three months ending June 2017, but it continues to remain very low. As the RBI Monetary Policy Statement pointed out: “The implementation of the GST so far also appears to have had an adverse impact, rendering prospects for the manufacturing sector uncertain in the short term. This may further delay the revival of investment activity, which is already hampered by stressed balance sheets of banks and corporates.”
15) Now let’s take a look at Figure 9, which plots the growth of the non-government part of the GDP.
Figure 9:
Figure 9 basically plots the growth of the non-government part of the economy, which typically constitutes 87 to 92 per cent of the economy. The growth of the non-government part of the economy has fallen to around a little over 4 per cent. This extremely important detail did not find a place anywhere in Prime Minister Modi’s speech.
16) The situation becomes even more worrisome if we look at Figure 10.
Figure 10:
As is clear from Figure 10, the growth rate of industry in general and manufacturing and construction in particular is at a five-year low. The manufacturing part of industry grew at 1.17 per cent during April to June 2017, whereas construction grew by 2 per cent during the same period.
This is a big reason to worry simply because manufacturing and construction have the potential to create new jobs. An estimate made by Crisil Research suggests that in construction 12 workers are typically required to create Rs 10 lakh worth of output. In case of manufacturing it is seven workers.
17) Take a look at Figure 11, which basically shows that labour intensive sectors have slowed down between January to June 2017.
Figure 11:
As Crisil Research points out in a recent research note: “In the past two quarters, three sectors have grown much faster than GDP: 1) Trade, hotels, transport, communication and services related to broadcasting; 2) Electricity, gas, water supply and other utilities, and 3) Public administration, defence and other services. Of these, only the trade, hotels and restaurants sub-sector is labour intensive, requiring about 6 workers to produce Rs 10 lakh worth of output. But the share of this sub-sector in total output is low at ~12%. In contrast, a fast growing sector like public administration, defence and other personal services, despite having a larger share in output, has low labour intensity of only 3. And sectors with higher labour intensity – such as construction (12) and manufacturing (7) – have been undershooting overall GDP growth.”
It needs to be said here that public administration, defence and other personal services sector is basically a proxy for the government. And the government has stopped creating jobs.
18) Take a look at Figure 12.
Figure 12:
Figure 12 plots the index of industrial production (IIP), a measure of the industrial activity in the country. It also plots manufacturing, which forms more than three-fourths of IIP. The growth of both these measures has been in low single digits for a while now and is clearly a reason to worry.
19) Take a look at Figure 13, which basically plots the consumption of petroleum products, over the years.
Figure 13:
The consumption of petroleum products has more or less been flat in comparison to the last financial year. This is another good indicator of slowing economic growth.
20) Take a look at Figure 14, which plots the sale of commercial vehicles during the course of this financial year.
Figure 14:
Commercial vehicle sales, which are a very good indicator of a pick-up in the industrial part of the economy. Commercial vehicle sales this year were lower than they were last year.
21) Take a look at Figure 15. It plots the fiscal deficit ratio of the government over the years.
Figure 15:
As can be seen from Figure 15, in the first five months of the current financial year, 96 per cent of the annual fiscal deficit has already been crossed. Fiscal deficit is the difference between what a government earns and what it spends. Why is the fiscal deficit during the first five months of the year at such a high level? The answer lies in the fact that the economic growth is slowing down and the government is trying to drive up growth, by spending more.
22) Take a look at Figure 16.
Figure 16:
It tells us that the increase in government expenditure has been a greater part of the increase in GDP over the last two years. For the period April to June 2015, the increase in government expenditure made up for around 1.3 per cent of the increase in GDP during that period. Since then it has jumped to 39.2 per cent between January to March 2017 and 34.1 per cent between April to June 2017.
So, the government is spending more and more in order to drive economic growth. This again shows that the government in its actions does believe that the economic growth is slowing down, but PM Modi won’t say so in his public posturing.
23) Take a look at Figure 17, it plots the bad loans ratio of public sector banks.
Figure 17:
Figure 17, basically plots the gross non-performing advances ratio or simply put. the bad loans ratio of public sector banks, over the years. Bad loans are essentially loans in which the repayment from a borrower has been due for 90 days or more. There has been a huge jump in bad loans of public sector banks over the last two years.
On October 7, the Reserve Bank of India imposed restrictions on the banking activities of Oriental Bank of Commerce (OBC). OBC was the seventh public sector bank on which restrictions have been placed. Now, one-third of public sector banks have restrictions in place. And all is well with the Indian economy?
24) Take a look at Table 1.
Table 1:
Gross NPAs (in Rs Crore)
Gross Advances
Gross non-performing advances ratio
Indian Overseas Bank
35,098
1,40,459
24.99%
IDBI Ltd.
44,753
1,90,826
23.45%
Central Bank of India
27,251
1,39,399
19.55%
UCO Bank
22,541
1,19,724
18.83%
Bank of Maharashtra
17,189
95,515
18.00%
Dena Bank
12,619
72,575
17.39%
United Bank of India
10,952
66,139
16.56%
Oriental Bank of Commerce
22,859
1,57,706
14.49%
Bank of India
52,045
3,66,482
14.20%
Allahabad Bank
20,688
1,50,753
13.72%
Punjab National Bank
55,370
4,19,493
13.20%
Andhra Bank
17,670
1,36,846
12.91%
Corporation Bank
17,045
1,40,357
12.14%
Union Bank of India
33,712
2,86,467
11.77%
Bank of Baroda
42,719
3,83,259
11.15%
Punjab & Sind Bank
6,298
58335
10.80%
Canara Bank
34,202
3,42,009
10.00%
Source: Author calculations on Indian Banks’ Association data.(The table does not include the associate banks of the State Bank of India which were merged into it).
What does Table 1 tell us? It tells us that many public sector banks are in a big mess on the bad loans front. Banks like Indian Overseas Bank and IDBI with bad loans ratio of 24.99 per cent and 23.45 per cent, will pull down the performance of any big bank they are merged with.
Even the big banks like Union Bank of India, Bank of Baroda, Punjab National Bank and Canara Bank, have a bad loans ratio of 10 per cent or more. If and when weaker banks are merged with these banks, their performance will only deteriorate. The question to ask is, why are many of these banks still being allowed to operate?
25) The capacity utilisation of 805 manufacturing companies tracked by the RBI OBICUS survey fell to 71.2 per cent during the period April to June 2017. This is the lowest in seven quarters.
I guess I will stop at this. There are many other economic indicators which can be used to point out that all is not well with the Indian economy. (For more details on how PM Modi cherry picked data to build a positive economic narrative, you can click here and here). Of course, this is not to say that there are no positive economic indicators right now. But the negative indicators far outnumber the positive ones.
As I keep saying, the first step towards solving a problem is recognising that it exists. But that doesn’t seem to be the case with PM Modi. In his world, all is well.
On November 8, 2016, in a late-night TV broadcast to the nation, Indian prime minister Narendra Modi, demonetised Rs 500 and Rs 1,000 notes. As of the midnight of November 8, 2016, these notes have been rendered useless.
This decision of the Modi government came as a huge surprise to the media as well as the citizens, given that there were no news leaks before the announcement. Newsreports suggest that the Reserve Bank of India, the Indian central bank, was given close six months to prepare for this eventuality. The government had asked the central bank to print more Rs 50 and Rs 100 notes. Despite the long period taken to prepare for this decision, there were no news leaks.
Further, the Rs 500 and Rs 1,000 notes which have been demonetised, can be deposited in banks as well as post offices up until December 30, 2016. The money will be credited in the account of the individual depositing the money. The notes can also be exchanged up to Rs 4,000.
While Indian cities are full of bank branches, those living in rural areas will find exchanging the demonetised notes a little difficult. Only 27 per cent of Indian villages have a bank within 5 kilometres.
The idea behind this move as per the government is to curb “financing of terrorism through the proceeds of Fake Indian Currency Notes (FICN) and use of such funds for subversive activities such as espionage, smuggling of arms, drugs and other contrabands into India.”
It is also to hit those who have a massive amount of black money in the form of cash. Black money is essentially money that has been earned through corruption and legal activities, without any tax being paid on it. There are several estimates of the total amount of black money going around in the Indian economy. A World Bank estimate puts the size of the black economy at a little 23.2 per cent of the economy in 2007.
By making high denomination notes worthless overnight, the government hoped that those who have black money in this form, will not be able to convert this money into physical assets like gold. Newsreports suggest that jewellers across the country worked overtime through the night of November 8 and November 9, 2016, to help convert black money held in the form of Rs 500 and Rs 1,000 notes into gold.
Starting November 10, 2016, the government will introduce new Rs 500 and Rs 2,000 notes. Those who have black money in the form of the old Rs 500 and Rs 1,000 notes will try exchanging them with new notes. They can’t go to a bank and deposit all their black money given that it is likely to lead to questions from the income tax department.
Any other way of exchanging notes will take some doing, given that the old denomination notes form more than 86 per cent of notes in circulation by value. Hence, it will not be easy to exchange these notes without leaving audit trails for the income tax department. To incapacitate those who are holding a lot of black money in the form of cash seems to be the major idea behind the move.
Crisil Research expects income tax collections of the government to improve as money earlier unaccounted for, enters the banking system and eventually gets taxed. Inflation is also expected to come down in the short-term as cash transactions come down.
Another area which is likely to be impacted is real estate. A portion of the payment while buying a house in India is almost always made in the form of cash. With the high denomination notes, having been demonetised it will become very difficult to organise for this payment. Hence, prices are expected to fall. If prices do fall it will be make real estate affordable. At affordable prices, the demand for real estate is likely to go up. This is expected to create low-skilled and unskilled jobs, which the country badly needs, given that one million individuals enter the workforce every month.
Further, the retail as well as the luxury goods businesses where a bulk of transactions are carried out in cash is expected to be impacted negatively, as cash transactions will come down dramatically in the short-term.
In fact, during the period the old notes are withdrawn and new notes make it to the market, the cash transactions are likely to remain down. India is a country where a bulk of transactions are still carried out in cash. A 2012 estimate carried out by the The Fletcher School at the Tufts University estimated that 86.6 per cent of the transactions were carried out in cash. While this figure would have come down since then, it would still be at a very high level.
Another research paper titled The Cost of Cash in India points out that “the ratio of currency to GDP in India (12.2%) is higher than countries such as Russia (11.9%), Brazil (4.1%), and Mexico (5.7%)”. Hence, India is still largely a cash driven economy and given this, Modi government’s move is likely to cause a few problems in the short-term.
Also, if the Modi government is serious about tackling the black money menace, it shouldn’t just leave it at this. As the former RBI governor Raghuram Rajan said in this context: “I think there are ways around demonetization. It is not that easy to flush out the black money. Of course, a fair amount may be in the form of gold, therefore even harder to catch.”
It is important that the government uses information technology to track down those who are earning money but not paying their share of taxes. As Rajan put it: “I would focus more on tracking data and better tax administration to get at where money is not being declared.”
Further, the government needs to quickly introduce electoral financing reform in the country.
The wrestler Yogeshwar Dutt came in for a happy surprise recently. The bronze medal that he had won at the London Olympics in 2012, is all set to be upgraded to a silver medal.
This has happened because the silver medal winner Besik Kudukhov’s dope test recently turned out to be positive. Kudukhov died in a car accident in 2013. Nevertheless, his sample from the 2012 London Olympics had been preserved and was tested again, before the recently concluded Olympics in Rio de Janeiro in Brazil.
Coming on back of Dutt’s disappointing performance in Rio, the silver medal would have indeed made the wrestler very happy. But typically the silver medallists at Olympics tend to be an unhappier bunch.
The Olympic bronze medallists tend to be happier in comparison to the silver medallists. Indeed, this is surprising but true. In a research paper titled When Less Is More: Counterfactual Thinking and Satisfaction Among Olympic Medallists, V.H. Medvec, S.F.Madey and T. Gilovich, provide the example of Abel Kiviat, a 1,500 metres silver medallist in the 1912 Olympics, held in Stockholm. Kiviat represented the United States.
The fact that he came second rattled him till almost the end of his life. As Medvec, Madey and Gilovich point out: “Kiviat had the race won until Britain’s Arnold Jackson “came from nowhere” to beat him by one-tenth of a second. “I wake up sometimes and say, ‘What the heck happened to me?’ It’s like a nightmare.” Kiviat was 91 years old when he said this in an interview with the Los Angeles Times.” Not winning the gold medal turned out to be a lifelong regret for Kiviat. It rattled him in his 90s. Kiviat died at the age of 99.
In fact, the authors studied the 1992 Olympics Games in Barcelona and came to the conclusion that those winning bronze medals seemed happier than the ones winning the silver medal. And this went against conventional logic. As they write: “Olympic competition involving bronze and silver medal winners—in which those who perform better nonetheless feel worse. On the surface this result is surprising because an underlying premise of all serious athletic competition is that athletes should strive as hard as they can, and that the higher they finish the better they feel.”
Nevertheless, that is not how things eventually turn out. And this goes against conventional wisdom. But the thing is that the silver medallists are thinking about the gold that could have won whereas the bronze medallists are looking at everyone below them, who did not win anything.
Their reference points are totally different. As Michael Foley writes in The Age of Absurdity—Why Modern Life Makes It Hard To Be Happy: “Little in human psychology is simple…Consider the differentials. Bronze is aware of only the vast gap between itself and the unmedalled many not even close to the podium – whereas silver sees only gold one hateful step up.”
In fact, the closer the silver medal winner was to winning the gold the unhappier he or she would feel about it.
And that is why the bronze medallists at the Olympics are happier than the silver ones. Though this seems counterintuitive initially, it makes immense sense after one digs a little more into it.
This does not in any way mean that coming second always leads to lesser satisfaction than coming third. As Medvec, Madey and Gilovich write: “Finishing second is truly a mixed blessing. Performing that well provides a number of direct benefits that increase our well being—recognition from others, boosts to self-esteem, and so on. At the same time, it can indirectly lower satisfaction by the unfortunate contrast with what might have been.”
So where does that place Yogeshwar Dutt? In fact, it makes him a silver medallist who should be happy about it, given that he had been a bronze medal winner for close to four years. His reference point is different than that of other silver medallists.


