What do higher household financial savings tell us about the economy?

The household financial savings, which form a bulk of the overall savings in the Indian economy, went up in 2019-20. This after they had fallen in 2018-19. The question is how did this happen and what does this mean for the Indian economy in the post-covid world? Mint takes a look.

What was household financial savings rate in 2019-20?

Household financial savings essentially refers to the savings of households in the form of currency, bank deposits, debt securities, mutual funds, insurance, pension funds and investments in small savings schemes. The total of these savings is referred to as gross household financial savings. Once the financial liabilities, that is, loans from banks, non-banking finance companies and housing finance companies, are subtracted from the gross savings, what remains is referred to as net household financial savings. The net household financial savings in 2019-20 rose to 7.7% of the GDP from 7.2% in 2018-19. This primarily happened because the liabilities fell from 3.9% of the GDP in 2018-19 to 2.9% in 2019-20.

What explains this uptick in household financial savings?

The gross financial savings of households in 2019-20 stood at Rs 21.63 lakh crore, marginally better than the gross savings in 2018-19 which was at Rs 21.23 lakh crore. Nevertheless, the net financial savings jumped to Rs 15.62 lakh crore in 2019-20 from Rs 13.73 lakh crore, a year earlier. This was primarily because the financial liabilities reduced from Rs 7.5 lakh crore to Rs 6.01 lakh crore. This pushed up net financial savings. Why did this happen? This happened primarily because the Indian economy has been slowing down from start of 2019. The per capita income in 2019-20 grew by just 6.1% (nominal terms, not adjusted for inflation), the slowest since 2002-03, when it had grown by 6.03%.

How did slow growth in per capita income impact savings?

A double digit growth in per capita income has happened only once since 2013-2014. In 2016-17, the per-capita income grew by 10.39%. Over the last few years, income growth has slowed down, and in 2019-20, it slowed down dramatically to 6.1%. This has led to a slowdown in lending growth. The non-food credit growth of banks in 2019-20 was at 6.7%, the slowest in more than a decade.

What does this tell about the overall state of the economy?

A slowdown in income growth has led to a slowdown in consumption as well as a slowdown in loan growth. What hasn’t helped is the weak financial state of non-banking finance companies, which has added to the lending slowdown. Also, this means that people were looking at their economic future bleakly, even before covid-19 had struck. At an individual level, the good part for them is that they tried to go slow on their borrowing in comparison to the past. But at the societal level, this hurt the economy because it led to a consumption slowdown.

Where will the household financial savings settle in 2020-21?

The period between April and June will lead to higher savings. As a recent RBI research paper states, a spike in household financial savings “is likely in the first quarter of 2020-21 on account of a sharp drop in lockdown induced consumption.” In fact, this explains why bank deposit rates have fallen in the recent past. The money deposited with banks has gone up, while the banks are unable to lend. But this spike in savings is likely to taper in the months to come simply because of “lags in the pickup of economic activity”.

A slightly different version of the piece appeared in the Mint on June 15, 2020.

Buys High and Not Low: That’s the Indian Investor for You

bullfighting

“Buy Low, Sell High,” goes the old stock market wisdom.

But like most stock market wisdom, this is easy to mouth, but difficult to implement in real life. It is very difficult to buy when others are selling and vice versa.

The tendency is to go with the herd because there is safety in numbers. And if things don’t work out as intended, one has someone else to blame as well. “I only did what Mr Singh’s son recommended,” goes the argument.

The question is how do numbers look on this front? Do investors actually buy when market levels are low and sell when market levels are high. Or are they doing exactly the opposite?

Take a look the following chart. That is how the Sensex has looked between April 1, 2011 and March 31, 2016. As can be seen from the chart, the overall trend of the Sensex has been in the upward direction, though it did fall during the course of 2015-2016.


Now take a look at the following table.

YearShares and Debentures
(as a % of GNDI)
2011-20120.2
2012-20130.2
2013-20140.4
2014-20150.4
2015-20160.7

Source: Annual Report of the Reserve Bank of India

The table shows the portion of gross national disposable income (basically the GDP number adjusted for a few other things. For a detailed treatment click here) made up for by investments in shares and debentures, which are a part of the household financial savings. In 2011-2012, shares and debentures made up for 0.2 per cent of the gross national disposable income. By 2015-2016, this had jumped up to 0.7 per cent. The household financial savings comprise of currency, deposits, shares and debentures, insurance funds, pension and provident funds and something referred to as claims on government. The claims on government largely reflects of investments made in post office small savings schemes.

What the table clearly tells us very clearly is that a very small portion of Indian retail investors invests in shares and debentures. In fact, these numbers also include the mutual fund numbers.

What do we learn from the chart and the table? As the Sensex went up, so did the investments in shares and debentures.

The trouble is that for some reason, which actually makes no sense, the RBI puts out the data for shares and debentures together. A breakdown of the total amount of money held in the form of shares (or debentures for that matter) is not available. But with the help of some other data we can prove that the Indian investor basically follows the policy of buying once the stock markets have rallied.

As on March 31, 2011, the total amount of money held in equity mutual funds in India had stood at Rs 1,69,754 crore. By March 31, 2016, this number had stood at Rs 3,44,707 crore. The assets under management increase in two ways. The first is because the value of the shares held by the mutual funds goes up. And the second is because of the fresh money being invested into the mutual funds.

As we can see the assets under management have more than doubled in the five-year period. On the other hand, the Sensex returns during the period stood at 30.5 per cent. Hence, it is safe to say that the major part of the increase in assets under management was because of new money coming into the mutual fund schemes.

And this new money kept coming in as the Sensex kept going up. Take the case of what happened between March 31, 2015 and March 31, 2016. The Sensex fell by 9.3 per cent during the course of the year. The assets under management of equity mutual funds on the other hand, went up by 12.8 per cent.

In fact, during the period, the Sensex achieved its highest level on January 29, 2015, when it closed at 29,681.77 points. Between then and March 31, 2016, the Sensex fell by 14.6 per cent. At the same time, the assets under management of equity mutual funds went up by 14 per cent.

This is a clear indication of the fact that investors actually invest in equity mutual funds only after the markets have rallied. Once the market has rallied, the investors probably assume that it will continue to rally.

Hence, I guess, it is safe to say that a similar behaviour is on when it comes to direct investing in stocks as well. And that (along with increase in mutual fund investments) explains why the share of shares and debentures has increased from 0.2 per cent of gross national disposable income in 2011-2012 to 0.7 per cent in 2015-2016.

Of course, one would be able to say this with much greater confidence if the RBI gave an exact breakdown of shares and debentures. I hope that this anomaly is corrected in the days to come.

The column originally appeared in The Five Minute Wrapup on September 7, 2016

Modi-Rajan Bhai-Bhai, Financial Savings of Households at a Five Year High

The Reserve Bank of India released its annual report earlier this week. The report had some important data points which I shall discuss in this piece.

Financial Savings Of the Household Sector

Take a look at the above table. The household financial savings of the country in 2015-2016 were the highest in five years. They stood at 7.7 per cent of the gross national disposable income. And what is gross national disposable income(GNDI)? Clara Capelli and Gianni Vaggi define the term in the research paper titled A better indicator for standard of living: The Gross National Disposable Income: “The GNDI…measures the income that residents can actually use for either consumption or saving, thus accounting for their purchasing power and, consequently, for their living standards.”

Let’s try and understand GNDI in a little more detail. It is essentially the sum of the gross domestic product (a measure of national income) plus remittances (money transfer carried out by migrant workers to their home country) plus money/food received as a part of an international assistance programme plus the net primary income. Net primary income is essentially the “difference between the primary income receivable from non-residents and the primary income payable to non-residents”.

As per the paper, India’s GNDI is around 1.03 times its gross domestic product.

The household financial savings comprise of currency, deposits, shares and debentures, insurance funds, pension and provident funds and something referred to as claims on government. The claims on government largely reflects of investments made in post office small savings schemes.

The household financial savings have gone up to 7.7 per cent of GNDI in 2015-2016. This is a five-year high.

Why has this happened? The simple reason for this lies in the fact that the rate of inflation has been lower in 2015-2016 than it was in the earlier years.
Inflation as measured by the consumer price indexs

As the chart shows, the rate of inflation as measured by the consumer price index has shown a downward trend between December 2013 and September 2015. Since then the rate of inflation has gone up a little.

The point is that when the rate of inflation goes down (i.e. there is disinflation) people have a chance of saving a greater portion of their income and that is what seems to have happened. Lower rates of inflation have led to higher household financial savings. The inflation as measured by the consumer price index peaked at 11.5 per cent in November 2013. It collapsed to 4.3 per cent in December 2014 and it averaged under 5 per cent through 2015.

Both the Narendra Modi government and the Reserve Bank of India governor Raghuram Rajan deserve credit for this. The Modi government for managing food inflation by not increasing the minimum support price on rice and wheat at the same rapid rate as it had been raised in the past (although this had started during the last year of the Manmohan Singh government) and Rajan for managing inflationary expectations (or the expectations that consumers have of what future inflation is likely to be).

In fact, things get interesting if one looks at the breakup of the household financial savings. In 2011-2012, deposits formed the bulk of the savings. They stood at 6 per cent of the GNDI. By 2015-2016, this had fallen to 4.7 per cent of the GNDI. What is happening here?

This clearly shows that most people who invest in deposits (of banks or otherwise) are victims of money illusion.  In 2011-2012 and 2012-2013, the nominal interest rates on bank deposits where close to 9-10 per cent and so was the inflation as measured by the consumer price index. This clearly meant that people were losing purchasing power on the money invested in deposits.

The inflation since then has fallen to around 5-6 per cent. The interest rates on bank deposits has fallen to around 7-7.5 per cent. Nevertheless, depositors are now making a real rate of return on their deposits because the rate of interest on deposits is greater than the rate of inflation. This clearly wasn’t the case earlier, and the depositors were essentially losing purchasing power by staying invested in deposits.

As Gary Belsky and Thomas Gilovich write in Why Smart People Make Big Money Mistakes: “[Money illusion] involves a confusion between ‘”nominal” changes in money and “real” changes that reflect inflation…Accounting for inflation requires the application of a little arithmetic, which…is often an annoyance and downright impossible for many people…Most people we know routinely fail to consider the effects of inflation in their finance decision making.”

This explains why people have moved away from deposits. The falling nominal rates have led to them shifting their investment to other avenues even though the nominal return on deposits is now in positive territory. Take a look at the claims on government. This has jumped from almost nothing to 0.4 per cent of GNDI. This basically means that the smarter lot has moved their money to small saving schemes where the nominal rate of interest as of now is higher than the interest on offer on fixed deposits.

Investments in shares and debentures has also jumped up from 0.4 per cent to 0.7 per cent of GNDI. This should make the finance minister Arun Jaitley happy. He complained some time back that people invest so much money in fixed deposits while ignoring other forms of investing like shares, debentures and mutual funds.

Currency holdings have also jumped from 1.1 per cent of GNDI to 1.4 per cent of GNDI. I really do not have an explanation for this. Why would people want to hold money in a form where they don’t get paid any interest?

The other interesting thing that comes out of the chart is that the gross household financial savings have risen to 10.8 per cent of GNDI in 2015-2016, from 10 per cent in 2014-2015. This has translated into the net household financial savings going up to 7.7 per cent of GDP in 2015-2016 from 7.5 per cent in 2014-2015.

Why is there such a substantial difference between the jump in gross household financial savings and the jump in net household financial savings? The net household financial savings figure is obtained by subtracting financial liabilities from the gross household financial savings.

The financial liabilities in 2015-2016 have jumped to 3 per cent of GNDI, in comparison to 2.5 per cent in 2014-2015. This basically means that people borrowed more in 2015-2016 than was the case in the past. In fact, at 3 per cent of GNDI, the financial liabilities are not significantly different from the 3.2 per cent figure of 2011-2012 and 2012-2013.

This basically tells us that households borrowing is alive and kicking. These numbers are again an answer to those who keep demanding that the RBI cut the repo rate at a much faster rate than it has. The trouble is clearly with corporate borrowing which continues to remain in a mess, and there is not much (and it shouldn’t) that the RBI can do about ensuring that banks lend to corporates.

The column originally appeared in Vivek Kaul’s Diary on September 1, 2016

India Is Still Facing The Ill-Effects Of The Congress Era Inflation

India's PM Singh speaks during India Economic Summit in New Delhi
The devil, like beauty, always lies in the detail.

Sometime last week the Central Statistics Office(CSO) put out data which clearly shows that India is still facing the ill-effects of the inflationary era unleashed by the Congress led United Progressive Alliance (UPA) government.

Between 2008-2009 and 2013-2014, the average consumer price inflation was higher than 10%. Food inflation was higher than 11%. High inflation essentially forced people to spend more and in the process they had lesser money to save.

Take a look at the following table. The household savings fell from 23.39% of the nominal Gross Domestic Product (GDP) to 19.06%. Nominal GDP does not take inflation into account.

In Rs crore2011-20122012-20132013-20142014-2015
Household Savings2065453223395023609362380488
As a % of total savings68.20%66.40%63.40%57.20%
As a % of nominal GDP23.39%22.36%20.94%19.06%
Net Financial Savings (Gross financial savings minus financial liabilities)642609733616862873961307
As a % of nominal GDP7.28%7.34%7.65%7.70%
Saving in physical assets1389209146368414608441379411
As a % of nominal GDP15.73%14.65%12.96%11.05%

The household savings primarily comprise of financial savings as well as savings in physical assets and savings in the form of gold and silver ornaments. The overall household savings have fallen from 23.39% of the GDP in 2011-2012 to 19.06% in 2014-2015.

The household financial savings (i.e. investments made in fixed deposits, provident funds, shares and debentures and life insurance) rose marginally from 7.28% to 7.70% of the GDP.

What the table does not tell you is that in 2007-2008, before the Congress led UPA government initiated an era of high-inflation, the household financial savings had stood at 11.45% of the GDP. Between 2007-2008 and 2011-2012, household financial savings fell dramatically. They haven’t really recovered since then despite lower inflation numbers.

In 2014-2015, the consumer price inflation was at an average of 5.83% during the course of the year. Food inflation was at 6.26%. The after-effects of the era of high inflation are still being felt. The low growth in household financial savings also explains why despite a massive fall in inflation, interest rates haven’t fallen at the same pace. If savings had risen at a much faster rate, the interest rates would have fallen more.

Savings in physical assets (homes, land, flats etc.) have fallen dramatically between 2011-2012 and 2014-2015 from 15.73% of the GDP to around 11.05%. This is again a reflection of the fact that people are not saving enough despite low inflation. One possible explanation for this is that incomes are not going up at a fast pace.

The other point that needs to be made here is that the real estate prices have gone way beyond what most people can afford. And that explains to some extent why household financial savings have risen between 2011-2012 and 2014-2015, but physical assets have not.

Now take a look at the following table. Companies (non-financial corporations) have been saving more over the years. Their savings have gone up from 9.59% of the GDP in 2011-2012 to 12.27% of the GDP in 2014-2015. What does this tell us?


In Rs crore2011-20122012-20132013-20142014-2015
Savings of non-financial corporations84713499032212180201532262
As a % of total savings28.00%29.40%32.70%37.20%
As a % of nominal GDP9.59%9.91%10.80%12.27%
Savings of financial corporations272371300599294180335679
As a % of total savings9.00%8.90%7.90%8.20%
As a % of nominal GDP3.08%3.01%2.61%2.69%
Savings of general government-158234-160048-148089-131729
As a % of total savings-5.20%-4.80%-4.00%3.20%
As a % of nominal GDP-1.79%-1.60%-1.31%-1.05%


It tells us that there are not enough investment opportunities going around and hence the profits that these companies are making are not being invested to expand but being saved. This is again a good indicator of the overall slow trend of the economy.

For sustainable economic growth to happen a country needs to produce things. As the Say’s Law states “A product is no sooner created, than it, from that instant, affords a market for other products to the full extent of its own value.”

The law essentially states that the production of goods ensures that the workers and suppliers of these goods are paid enough for them to be able to buy all the other goods that are being produced. Production of goods also creates new jobs.

A pithier version of this law is, “Supply creates its own demand.” And that is why industrial expansion is important for economic growth to happen. But currently that doesn’t seem to be happening.

(Vivek Kaul is the author of the Easy Money trilogy. He can be reached at [email protected])

The column originally appeared on Swarajya on February 3, 2016

Ajit Gulabchand: The man who built Bandra-Worli sea-link needs lessons in basic economics

220px-Ajit_Gulabchand_-_World_Economic_Forum_on_East_Asia_2011
Ajit Gulabchand, the chairman and managing director of Hindustan Construction Company (HCC) said  in an interview yesterday: “a 50 basis points (bps) rate cut is welcome, but it is insufficient. …I expected at least 300 bps but if not that, 200 bps as an initial cut to create the impact that is necessary.” Among other things, Gulabchand is famous for having built the Bandra-Worli sea-link in Mumbai.

Gulabchand was reacting to the Reserve Bank of India’s decision to cut the repo rate by 50 basis points (one basis point is one hundredth of a percentage) to 6.75%. Repo rate is the rate at which the Reserve Bank of India (RBI) lends to banks and acts as a sort of a benchmark to the interest rates that banks pay for their deposits and in turn charge on their loans.

While industrialists are used to being unreasonable, this is among the most irresponsible statements I have come across from an industrialist, in a while. Allow me to explain.

Central banks do not take extreme steps unless it’s an emergency. When was the last time you heard a big central bank dropping rates by 300 basis points at one go? Or even 200 basis points? Or even 100 basis points for that matter?

So, central banks work in a step by step process and not in a random manner. The question is why is Gulabchand sounding so desperate? The answer can be found out from his profit and loss account statement.

The operating profit (or earnings before interest taxes depreciation and amortisation) of HCC excluding its other income, for the period of April to June 2015 stood at Rs 161.8 crore. The total amount of interest that the company paid on its debt during the same period was at Rs 167 crore.

Hence, the interest coverage ratio of the company is less than one. The interest coverage ratio is calculated by dividing the interest on debt that a company pays during a period by its operating profit. An interest coverage ratio of less than one essentially shows that the company is not making enough money to be able to pay the interest on its debt. And that is not a good situation to be in.

What this basically means is that HCC has taken on more debt than it should have. In this scenario Gulabchand is desperate for the interest costs of the company to go down. The total debt of the company as on March 31, 2015, stood at Rs 5,011 crore. On this the company paid an interest of Rs 651.1 crore during the course of April 2014 to March 2015.

This means an effective interest rate of 13% (Rs 651 crore as a proportion of Rs 5,011 crore). If the interest rates fall by 300 basis points, HCC’s effective rate of interest will come down to 10%, assuming that the banks totally pass on the cut to the borrowers.

At 10%, the interest outflow for HCC would be Rs 501.1 crore (10% of Rs 5,011 crore). This is Rs 150 crore lower than the amount the company paid as interest during the period April 2014 to March 2015. And this is a huge amount given that the profit after tax of HCC during the period was Rs 81.6 crore.

So, it’s understandable why Gulabchand is desperate for significantly lower interest rates. The same logic holds true for a spate of other corporates who are deep in debt and are having a tough time servicing their debt. And given half a chance they talk about lower interest rates.

The question nonetheless is can India afford interest rates which are 300 basis points lower than they currently are. Let’s do a little thought experiment here.

The repo rate before the RBI cut it by 50 basis points was at 7.25%. Let’s say instead of cutting the repo rate by 50 basis points, the RBI had cut it by 300 basis points, as Gulabchand wanted it to. Let’s further assume that banks passed on this cut (I know I am being unreasonable here, but just humour me for a moment). They cut deposit interest rates by 300 basis points and they cut lending rates by 300 basis points as well.

What would happen here? Given that the repo rate would fall to 4.25%, we would have a situation where deposit rates would suddenly fall around 5%. So far so good.

In the monetary policy statement released yesterday the RBI expects consumer price inflation is to reach 5.8% in January 2016. So we will have a scenario where interest on fixed deposits are in the region of 5% and the inflation is at 5.8%. This will mean a negative real return on the fixed deposits, as the rate of inflation will be greater than the interest being offered on fixed deposits. And that will not be a good thing.

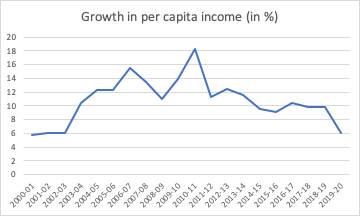
Take a look at the accompanying chart. The green line represents the consumer price inflation. The red line represents the average rate of interest at which the government borrows.

As can be seen from the chart, between 2007-08 and 2013-2014, the consumer price inflation was greater than the average interest rate at which the government borrowed. The rate of interest at which the government borrows is the benchmark for all other kinds of loans and deposits.

As can be seen from the chart, the government managed to borrow at a rate of interest lower than the rate of inflation between 2007-08 and 2013-14. And if the government could raise money at a rate of interest below the rate of inflation, banks couldn’t have been far behind.

Hence, the interest offered on fixed deposits by banks and other forms of fixed income investments was also lower than the rate of inflation. The inflation was consistently greater than 10% during the period, whereas the fixed deposit rates ranged between 8-10%.

And this had negative consequences, as household financial savings fell. Household financial savings is essentially a term used to refer to the money invested by individuals in fixed deposits, small savings scheme, mutual funds, shares, insurance etc. A major part of household financial savings in India is held in the form of bank fixed deposits and post office small savings schemes.

The household financial savings have fallen from 12% of the GDP in 2009-10 to 7.5% in 2014-15. The number was at 7% in 2012-2013. This happened because the rate of return on offer on fixed income investments (like fixed deposits, post office savings schemes and various government run provident funds) was lower than the rate of inflation.

This led to people moving their money into investments like gold and real estate, where they expected to earn more. It also led to a huge proliferation of Ponzi schemes in several parts of the country.

Hence, the money coming into fixed deposits and post office income schemes slowed down leading to a situation where household financial savings fell. This, in turn, led to high interest rates. As mentioned earlier the effective rate of interest that Gulabchand’s HCC paid on its debt during the period between April 2014 and March 2015, was 13%.

If the household financial savings are to be rebuilt, the rate of interest on offer to depositors has to be significantly greater than the rate of inflation. A major reason why household financial savings have risen between 2012-2013 and 2014-2015 has been because the rate of interest on fixed income investments has been higher than the rate of inflation.

In fact, the RBI governor Raghuram Rajan has often talked about a real rate of interest of 1.5-2% on fixed income investments (i.e. fixed deposit interest rates are higher than the rate of inflation by 1.5-2%). This is a very important factor that needs to be kept in mind by the RBI while deciding on interest rates.

The basic point is that the interest rates are not just about corporates and borrowing, they are also about savers. If people don’t save enough through fixed deposits and other fixed income investments, the rate of interest is going to go up.

And in order to ensure that people save enough and do not divert their money into other investments, it is important that the rate of interest on offer on fixed income investments continues to be significantly higher than the rate of inflation.

This also ensures that over the long term interest rates will remain at more reasonable levels. Meanwhile, if that means that the corporates are hurt, then so be it.

The column originally appeared on The Daily Reckoning on Oct 1, 2015