The Republic at 69 and the next seven decades

indian flag

India has been independent for more than 70 years and a republic for 68 years. Between 1950, the year, the country became a republic and 1991, the year, the government initiated economic reforms, the economic size of the country became five times.

By 2014, the economic size of the country was 4.2 times of what it was in 1991. I am forced to stop this comparison at 2014 because India adopted a new GDP series in January 2015 and the GDP data in that series is available only from 2011-2012 onwards.
The differentiating point between pre and post 1991 eras, is that the economic growth has been faster post 1991. There is no denying that this economic growth has had huge benefits.

At the same time, it has created its own set of problems as well. In 1990, as per the World Inequality Report 2018, the top 10 % of India’s population earned around 34 % of the national income. By 2016, this had jumped to 55 %. This rise in inequality has happened because the upper echelons of the society have benefitted more from the economic reforms of 1991.

As can be seen from Figure 1, India along with Brazil, have the highest concentration of wealth in the world, after the Middle East. In purchasing power terms, the per capita income of Brazil is 2.3 times that of India.

Figure 1:
inequality
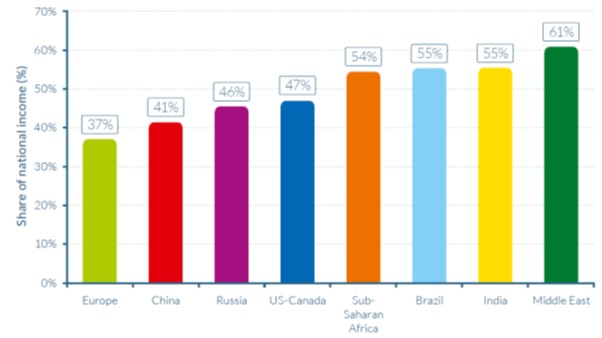
Source: World Inequality Report 2018.

Inequality is not the only reason to worry about on the economic front. For years, the story of India’s demographic dividend has been sold to the world. Demographic dividend is a period of few decades in the lifecycle of a nation where it’s workforce increases at a faster pace than its overall population. As these individuals enter the workforce, find jobs, earn and spend money, the economy grows at a faster pace and pulls out many people out of poverty.

At least that is how things are supposed to work in theory. Around a million Indians are joining the workforce every month. This is expected to continue for the next decade and a half. The trouble is that there aren’t enough jobs going around. A recent estimate made by the Centre for Monitoring Indian Economy suggests that in 2017, two million jobs were created for 11.5 millions Indians who joined the labour force during the year.

There are other data points also which suggest a lack of jobs. The investment to gross domestic product ratio has been falling for a while now. The capacity utilisation rate of manufacturing firms has stagnated between 70 and 72%. If existing capacities are not being used, there is no reason for firms to expand and create jobs.

Labour intensive export sectors like apparels, gems and jewellery, leather, agriculture etc., have remained flat, over the last few years. Real estate and construction, two sectors which have tremendous potential to create jobs which cater to India’s cheap and largely unskilled labour, are down in the dumps.

For many, agriculture is no longer economically feasible. A discussion paper recently published by NITI Aayog suggests that agriculture contributes 39% of rural economic output, while employing 64 % of the workforce. For agriculture to be economically feasible nearly 8.4 crore individuals need to be moved out of it. This unfeasibility of agriculture has also resulted in landowning castes across the country, wanting reservation in government jobs.

The education scenario continues to be depressing. Children are going to school but aren’t really learning. The latest Annual Status of Education Report (ASER) states: “For the past twelve years, ASER findings have consistently pointed… that many children in elementary school need urgent support for acquiring foundational skills like reading and basic arithmetic.” Given this, even when firms have jobs, they cannot find people with the necessary skillset.

The trouble is that skilling is not happening at the scale that it needs to. The different ministries in the government had accepted a target of training 99,35,470 individuals in 2016-2017. Of this, only 19,58,723 or around less than one-fifth had been trained up to December 2016. It isn’t fair to blame the government for this, given the huge scale required. This needs a total overhauling of our education system with a huge focus on vocational studies.

Further, the Indian firms start small and continue to remain small. Labour laws remain the major culprit on this front. The state of Jammu and Kashmir has 260 labour laws. Other estimates suggest that India has around 200 labour laws in total. A very serious effort is needed at the government’s level to improve, the ease of doing business.

All in all, the scenario that prevails for India’s demographic dividend, is very bleak. And it is this demographic dividend which is expected to take us forward for the next seven decades.

The column originally appeared in the Daily News and Analysis, on January 26, 2018.

BLACK MONEY AND HOW IT ENGENDERS INEQUALITY


rupee


In the last month’s edition of the mann ki baat programme, the prime minister Narendra Modi encouraged the citizens to declare the black money they have, pay a fine and get done with it.

Between June 1 and September 30, the government of India, is running a compliance window which allows citizens with black money to declare it to the government, pay a tax of 30%, a surcharge of 7.5% and a fine of 7.5%. This comes with the promise that for “those who voluntarily declare to the government their assets and their undisclosed income…the government will not conduct any kind of enquiry.” As Modi put it: “not once will it be asked as to from where all this wealth came and how it was acquired.”

It remains to be seen how successful this compliance window eventually turns out to be. But the fact of the matter remains that black money continues to remain a huge bane for the Indian society. The Modi government likes to distinguish between the black money that has left the Indian shores and the black money that continues to remain in India.

In the last two years it has been extremely aggressive about reclaiming black money that has left the Indian shores, but the same aggression has been missing when it talks about reclaiming the domestic black money. In fact, the total tax on domestic black money for those wanting to declare it, has been set at 45 per cent. In case of foreign black money this was 60 per cent.

One school of thought is that black money that remains in the country benefits the country in some ways. Let’s consider a politician who has black money. He invests it in a real estate project of a builder. The builder builds homes and sells it. In the process, infrastructure is created. At the same time, jobs are created as well. Further, real estate has a multiplier effect as well. It leads to demand for cement, bricks, steel, glass, and so on. So a lot of people benefit because of domestic black money, if it is invested.

The trouble is that this is just one part of the argument. A lot of homes that have been built using black money lie unsold. The builders are not willing to cut prices because they don’t want their investors to lose out. The investors in many cases happen to be politicians, who have put their ill-gotten wealth to use. This keeps real estate prices high.

Further, many homes that have been sold also, have been kept locked and not been given out on rent. This for the simple reason that rental laws in this country suck, and are loaded completely in favour of the tenant. Also, the current rental yield (rent divided by the market price) is around 2-3%. And at that rate, many landlords feel that renting out home is a risk not worth taking. Hence, many new homes that have been bought are kept locked. A home that is locked is of no use to anyone.

Also, a basic point that people miss is that black money is basically money on which tax has not been paid. When tax is not paid to the government, the government’s tax collections go down. This means that the government gets those who cannot avoid paying tax, to pay more tax. As Arun Kumar writes in The Black Economy in India: “This makes the latter [i.e. those who cannot avoid paying income tax] feel that injustice is being done to them.”

So the government gets those who are paying tax to pay more tax (let’s say by imposing a cess or increasing the rate of tax) or the government simply borrows more. Usually it does both. If the government borrows more, then the chances of interest rates going up, also go up. This again hurts those who are paying tax, more than it hurts others.

In this way, the prevalence of black money leads to more inequality in the society and that is obviously not a good thing.


The column originally appeared in the Bangalore Mirror on July 6, 2016

How money printing has made the rich richer

helicash
Vivek Kaul
 
Raghuram Rajan before he became the governor of the Reserve Bank of India, wrote a book called Fault Lines. This was one of the first books that offered reasons for the financial crisis and that went beyond the greed of Wall Street.
One of the reasons that Rajan discussed in great detail was income inequality. He argued that this was one of the major reasons behind the financial crisis.
The top 1% of the households accounted for only 7.9% of total American wealth in 1976. This would grow to 23.5% of the income by 2007. This was because the incomes of those in the top echelons was growing at a much faster rate.
The rate of growth of income for the period for those in the top 1% was at 4.4% per year. The remaining 99% grew at 0.6% per year. What is even more interesting is the fact that the difference is even more pronounced in the 1990s and the first decade of the twenty first century.
The incomes of those in the top echelons grew at a much faster rate since the 1990s. Between 1993 and 2000, when the dotcom bull run happened and when Bill Clinton was the President of the United States, the income of the top 1% grew at the rate of 10.3% per year, and for the remaining 99%, it grew at 2.7% per year.
Between 2002 and 2007, when George Bush Jr was the President, the income for the top 1% grew at the rate of 10.1% per year. For the remaining it grew at a minuscule 1.3% per year. In fact, the wealthiest 0.1% of the population accounted for 2.6% of American wealth in 1976. This had gone up to 12.3% in 2007.
But it was not only the CEOs and the super rich who were getting richer. Even those below them were doing quite well for themselves. In 1976, the top 10% of households earned around 33% of the national income, by 2007 this had reached 50% of the national income.
In fact in 1992, before the dotcom bull run started, the top 10% earned around 41% of the national income, by the time it ended, the number was at 47% of the national income. When George Bush took over as President the number was at 45% and by the end of his term in early 2008, it had galloped to 50%.
The rich were getting richer in America. One reason for this was the fact that those at the upper echelons of organisations were making more money than ever before. At a more basic level there was also a huge increase in “college premium”. This meant that people who had a college degree earned much more than those who had stopped studying at the high school level

The advent of technology had made a lot of low level jobs redundant. Earlier secretaries used to be required to type letters and responses, or to communicate within the various offices and branches of the firm. With the advent of computers and internet, people did their own typing. And that in turn meant lower pays at lower levels.
The solution to this increasing inequality of income to some extent was more and better education. But that is something that would take serious implementation and at the same time results wouldn’t have come overnight. They would take time.
Hence, the American politicians looked elsewhere to deal with this increasing inequality. There solution was to ensure that loans were easily available to people. Rajan explains this in 
Fault Lines. As he writes “Politicians have therefore looked for other ways to improve the lives of their voters. Since the early 1980s, the most seductive answer has been easier credit. In some ways, it is the path of least resistance…Politicians love to have banks expand housing credit, for all credit achieves many goals at the same time. It pushes up house prices, making households feel wealthier, and allows them to finance more consumption. It creates more profits and jobs in the financial sector as well as in real estate brokerage and housing construction. And everything is safe – as safe as houses – at least for a while.”
This availability of easy money led to a big real estate bubble, which finally morphed itself into the global financial crisis which has been on since late 2008. In the aftermath of the crisis economic growth slowed down. Central banks around the world, led by the Federal Reserve of United States, the American central bank, started to print money.
The idea was to flood the system with money, keep interest rates low and encourage people to borrow, to get the economy up and running again. But that did not happen or at least did not happen at the pace that central banks expected it to.
Low interest rates led to financial firms borrowing and investing money all over the world driving up various financial markets to all time high levels, including the American stock markets. As Gary Dorsch, an investment newsletter, 
writes in his latest newsletter dated December 4, 2013, “The US-stock market rally is now 57-months old, and over this time period, the S&P-500 index has climbed a “wall of worry,” rising +170% from its March 9th, 2009 low, and hitting an all-time high, above the 1,800-level.”
The idea was that once the stock market started to go up, the wealth effect would come into play i.e. people would feel rich and they would go shop. But as it turned out, the retail investors have stayed away from the market for a large part of the last four and half years and have only now started to come back to the market. As Dorsch puts it “But only this year, did it begin to earn the grudging respect of smaller retail investors. They’ve plowed $175-billion into equity funds so far this year, after withdrawing $750-billion in the previous six years.”
Meanwhile the rich got richer. As Dorsch  wrote in a
 newsletter dated October 3, 2013, “Over the past 1-½ years, the Fed has increased the…money supply by +10% to an all-time high of $12-trillion. In turn, traders have bid-up the combined value of NYSE and Nasdaq listed stocks to a record $22-trillion. That’s great news for the Richest-10% of Americans that own 80% of the shares on the stock exchanges.”
He also adds in his latest newsletter that “US-equity values have increased $14-trillion over the past 57-months. Across the Fortune-500 companies, the average chief executives pockets 204-times as much as that of their rank-and-file workers, that’s disparity is up +20% since 2009. Perversely, the compensation of the S&P-500 chieftains is often linked to the ruthless slashing of jobs and wages in order to increase the companies’ profitability. In theory, that boosts stock prices, and CEO’s collect about 90% of their compensation through the exercise of stock options.”
And this has meant that the rich have got richer, while the average income of the middle class and the poor has been falling, as jobs are being slashed. “For Middle America, real disposable income has declined. The Median household income fell to $51,404 in Feb ‘13, or -5.6% lower than in June ‘09, the month the recovery technically began. The average income of the poorest 20% of households fell -8% to levels last seen in the Reagan era,” writes Dorsch.
Due to this nearly more than 100 million Americans are receiving one or another form of welfare from the government. “According to the latest data from the Census Bureau, the US has already passed the tipping point and is officially a welfare society. Today, more Americans are receiving some form of means tested welfare than those that have full-time jobs. No, that’s not a misprint. At the end of 2011, the last year for which data are available, some 108.6-million Americans received one or more form of welfare. Meanwhile, there were just 101.7-million people with full-time jobs, including both the private and government sectors.The danger is the US has already developed a culture of dependency. No one votes to cut his own welfare benefits,” writes Dorsch.
And this is clearly not a healthy sign. The irony is that the American politicians helped by the Federal Reserve created a real estate bubble to address income inequality. Once that bubble blew up, they started printing money. And that in turn has led to more inequality. The solution has aggravated the problem.
The article originally appeared on www.firstpost.com on December 6, 2013 

(Vivek Kaul is a writer. He tweets @kaul_vivek)