India’s Investment Conundrum

road
The Economic Survey released by the ministry of finance every year before the budget is by far the best document on the ‘real’ state of the Indian economy. The latest Economic Survey released in late January, discusses the poor state of investment in India in great detail.

The investment to gross domestic product (GDP) ratio (a measure what part of the overall economy does investment form) peaked in 2007 at 35.6%. It has been falling ever since and in 2017, it had stood at 26.4%. No other country in the world has gone through such a huge investment bust, during the same period, the Survey suggests.

Further, the Survey remains pessimistic about whether India will be able to bounce back from here. For one, India’s investment slowdown is not yet over. As the Survey puts it: “Cross -country evidence indicates a notable absence of automatic bounce-backs from investment slowdowns. The deeper the slowdown, the slower and shallower the recovery.”

Evidence from other countries which have gone through a similar investment slowdown seems to suggest that a full recovery rarely happens. Further, a fall in private investment accounts for a bulk of the investment decline. This is something that can be seen from the fact that new projects announcement in the period of three months ending December 2017, came in at a 13-year low (as per data from Centre for Monitoring Indian Economy).

A fall in the investment to GDP ratio also suggests that enough jobs and employment opportunities are not be created. A recent estimate made by the Centre for Monitoring Indian Economy suggests that in 2017, two million jobs were created for 11.5 million Indians who joined the labour force during the year.

With sufficient jobs and employment opportunities not going around, it has impacted the earning capacity of many Indians, especially, the one million Indians entering the workforce every month.

Ultimately, enough jobs and employment opportunities not being created has translated itself into a lack of growth on the consumer demand front. This can be seen in the capacity utilisation of manufacturing firms which has varied between 70-72% for a while now. This lack of consumer demand has finally translated into falling corporate profits, over the last decade.

Take a look at Figure 1.

Figure 1:
graph
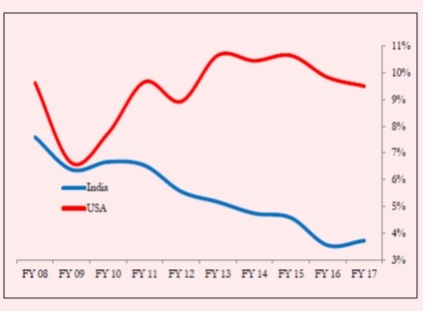
Source: Economic Survey 2017-2018.

Figure 1 plots the corporate profits as a proportion of the GDP since 2008. The Indian profits are represented by the blue line, which has gone down. As the Economic Survey points out: “India’s current corporate earnings/GDP ratio has been sliding… falling to just 3½ percent.” Indian corporate profits have halved since 2008. This is a clear impact of a falling investment to GDP ratio.

Of course, no relationship in economics can be totally linear.

A falling investment rate leads to fewer jobs and employment opportunities, in turn leading to lower consumer demand and lower corporate profits.

Lower consumer demand obviously has a negative impact on the investment rate, which again has an impact on jobs, employment opportunities and corporates profits. And so the cycle works.

John Maynard Keynes, in the aftermath of the Great Depression of 1929, had suggested that when the private sector is not investing, the government needs to step in, up the ante, spend money and create consumer demand.

One of the best sectors to invest in, in order to create demand is housing. The sector has many forward and backward linkages, which can have a huge multiplier effect. As the finance minister Arun Jaitley said in his budget speech: “Under Prime Minister Awas Scheme Rural, 51 lakhs houses in year 2017-18 and 51 lakh houses during 2018-19 which is more than one crore houses will be constructed exclusively in rural areas. In urban areas the assistance has been sanctioned to construct 37 lakh houses.” A few months back, the government had announced a huge road building programme as well.

These programmes will definitely help. But the government can only do so much, given the fact that India’s investment to GDP ratio has been falling for more than a decade. The government doesn’t have access to an unlimited amount of money, and the private sector needs to start investing if the investment rate has to revive.

The private sector won’t do so, at least not immediately, because of a lack of consumer demand and also because it is just coming out of a huge borrowing binge. The government can only facilitate this situation by pushing through ease of doing business at every level.

As Jaitley said in his speech: “To carry the business reforms for ease of doing business deeper and in every State of India, the Government of India has identified 372 specific business reform actions.” These reforms need to be quickly implemented, if there has to be any hope of breaking India’s investment conundrum.

The column originally appeared in Daily News and Analysis on February 13, 2018.

One Learning from Economic Survey: India’s Future is Pakodanomics

One issue that I have regularly written and discussed in my columns is India’s investment to gross domestic product (GDP) ratio, which has fallen dramatically over the years. The latest Economic Survey gets into great detail regarding this issue and paints, what I would call a very bleak picture of India’s economic future.

India’s investment to GDP ratio “climbed from 26.5 percent in 2003, reached a peak of 35.6 percent in 2007, and then slid back to 26.4 percent in 2017.” This is a huge fall of 9.2 per cent from the peak.

As the Economic Survey points out: “And while it is true that the past 15 years have been a special period for the entire global economy, no other country seems to have gone through such a large investment boom and bust during this period.”

Why has this dramatic fall in investment as a proportion of the overall economy happened? This is something that has been analysed to death. Nevertheless, as the Survey points out: “India’s investment slowdown is unusual in that it is so far relatively moderate in magnitude, long in duration, and started from a relatively high peak rate of 36 percent of GDP. Furthermore, it has a specific nature, in that it is a balance sheet related slowdown. In other words, many companies have had to curtail their investments because their finances are stressed, as the investments they undertook during the boom have not generated enough revenues to allow them to service the debts that they have incurred.”

It is well known that companies tend to invest and expand when they are unable to meet the demand from their current production capacity. The Reserve Bank of India carries out capacity utilisation surveys of manufacturing firms every three months. The latest survey for the period April to June 2017, found that capacity utilisation stood at 71.2 per cent. In fact, capacity utilisation has varied between 70 and 72 per cent for a while now.

As economist Madan Sabnanvis writes in his new book Economics of India-How to Fool all People for all Times: “The capacity utilisation rate has gotten stuck in the region of 70-72 per cent which means two things: first demand is absent, and second, even if it does increase, production can be scaled up without going in for fresh investment.”

While, it is easy to hope that this is something that can be unravelled, history tends to suggest otherwise. The Economic Survey looks at many other countries which, in the past, have gone through what India is currently going through on the lack of investment front. The Survey specifically looks at “cases in which the rate of investment has fallen by at least 8.5 percentage points from its peak over a 9 year period are considered.” It then goes on to find out, “what is the investment rate 11, 14 and 17 years after the peak?”

The results are far from encouraging. As the Survey points out: “Investment declines flowing from balance sheet problems are much more difficult to reverse. In these cases, investment remains highly depressed, even 17 years after the peak… India’s investment decline so far has been unusually large when compared to other balance sheet cases.”

The Survey further points out: “The median country reverses only about 25 percent of the decline 14 years after the peak, and about 40 percent of the decline 17 years after the peak.” This conclusion is based on a sample of 30 countries where the investment to GDP ratio fell by 8.5 per cent from its peak, over a 9-year period. As we have seen earlier, the investment to GDP ratio in the Indian case fell from a peak of 35.6 per cent in 2007 to 26.4 per cent in 2017.

The data points stated above do not give us much hope. It basically means that over a period of 11 years after the investment to GDP ratio peaked, the median country in the sample tends to improve its investment to GDP ratio by 2.5 per cent from the lowest level achieved. As the Survey points out: “A ‘full’ recovery is defined as attainment of an investment rate that completely reverses the fall, while no recovery implies the inability to reverse the fall at all or worse.”

The trouble is in the Indian case, more than a decade has elapsed, and the investment to

GDP ratio has continued to fall.

Take a look at Figure 1.

Figure 1: Count and Extent of Recovery from India-Type Investment Decline*Note: *T is the peak time Period *: A fifty percent recovery implies that the country attained an investment rate that reversed half of the 8.5 percentage point fall. The dots imply the percentage of the total fall that the median country namaged to reverse.

Figure 1, basically points out that over a period of 17 years after the investment to GDP ratio peaked, 10 out of the 28 countries were able to make a recovery of more than 50 per cent. Given that the Indian investment to GDP ratio has continued to fall, this does not give us too much hope. Despite this large fall in investment, India has had to pay a moderate cost in terms of growth. As the Survey points out: “Between 2007 and 2016, rate of real per-capita GDP growth has fallen by about 2.3 percentage points-that is lower than the above 3 percent decline in growth noticed, on average, in episodes in other countries that have registered investment declines of similar magnitudes.”

It is a given that unless this investment slowdown reverses at a very rapid rate, India’s hopes of providing jobs and decent employment opportunities, to a million Indians who are entering the workforce every month and the 8.4 crore Indians who need to be moved out of agriculture to make it economically feasible, remains just that, a hope.

India’s hopes of a double digit economic growth, also remain just a hope. As the Survey points out: “A one percentage point fall in investment rate is expected to dent growth by 0.4-0.7 percentage points.”

What does the Economic Survey think India’s chances are? “India’s investment decline seems particularly difficult to reverse, partly because it stems from balance sheet stress and partly because it has been usually large. Cross -country evidence indicates a notable absence of automatic bounce-backs from investment slowdowns. The deeper the slowdown, the slower and shallower the recovery,” the Survey states.

But given that it is a government document, it ends on a note of hope. “At the same time, it remains true that some countries in similar circumstances have had fairly strong recoveries, suggesting that policy action can decisively improve the outlook,” the Survey states. While this sentence suggests hope, there is nothing in the analysis carried out in the Economic Survey, which gives any hope.

The trouble is that the policy action has had next to no impact on the investment to GDP ratio for more than a decade now. The ratio has simply continued to fall.

So, what does that leave us with? Without an increase in investment there will be very few jobs and employment opportunities being created. Basically, any industry that is set up in any area, first provides jobs to people who work for it. It also creates jobs for the ancillary industries which feed into it. Over and above this, it creates other employment opportunities in the area.

When the IT industry took off in and around Bengaluru, other than providing jobs to engineers, it provided employment opportunities for drivers, cooks, maids, shop keepers, and so on. At the second level, as the engineers earned more, and demanded good residential spaces to live in, it created demand for builders. That in turn created employment opportunities in the construction and the real estate industry. And so cycle worked.

To conclude, the question is what will feed India’s huge demographic dividend of one million youth entering the workforce, every month, if investment doesn’t take off? The only answer right now is: Pakodanomics.

And to distract attention from Pakodanomics, given that it is not a great way to make a living, we will keep having more and more Padmavats, for distraction.

(You can read in detail about pakodanomics here and here).

The column was originally published in Equitymaster on January 30, 2018.

India’s Jobs Problem: No One Sells Pakodas In Front of Your Office?

So, India does not have a jobs problem. We are generating enough jobs and everybody is living happily ever after.

Or so seems to suggest a new study carried out by Soumya Kanti Ghosh, Chief Economic Adviser at the State Bank of India and Pulak Ghosh, a Professor at IIM Bangalore. The study uses data from Employees Provident Fund Organisation (EPFO).

In a column in The Times of India, the authors write: “Based on all estimates, we believe that 7 million formal jobs are being added to payroll on a yearly basis.”

This new study has caught the imagination of the media and the politicians in power and is being flagged all around. If seven million jobs are being created in the formal sector every year, India does not have a jobs problem. The informal sector does not have to register with the EPFO. Informal sector is that part of the economy which is not really monitored by the government and hence, it is not taxed.

The informal sector in India, up until now, has been creating a bulk of the jobs. There are various estimates available on this. Ritika Mankar Mukherjee and Sumit Shekhar of Ambit Capital wrote in a recent research note: “India’s informal sector is large and labour-intensive. The informal sector accounts for ~40% of India’s GDP and employs close to ~75% of the Indian labour force.”

The Institute for Human Development, India Labour and Employment Report, 2014, points out: “An overwhelmingly large percentage of workers (about 92 per cent) are engaged in informal employment and a large majority of them have low earnings with limited or no social protection.”

As the Economic Survey of 2015-2016 points out: “The informal sector should… be credited with creating jobs and keeping If unemployment low.” If seven million jobs are being created just in the formal sector, imagine what must be happening in the informal sector. Firms and individuals operating in the informal sector, must be falling over one another to recruit people for jobs they have on offer. But is that really happening?

As I have mentioned in the past, 12 to 15 million Indians are entering the workforce every year. And given that seven million jobs are being created just in the formal sector, the individuals currently entering the workforce must be having a ball of a time, with so much to choose from.

Of course, all this goes against what I have been writing all along about India having a huge jobs problem and the fact that India’s so called demographic dividend is being destroyed. But it also goes against a lot of other data that is on offer.

Jobs are created when companies invest and expand. Let’s first look at the investment to gross domestic product (GDP at constant prices) ratio of the Indian economy. This ratio as I have written in the past has been falling for a while now. Take a look at Figure 1:

Figure 1: 

As is clear from Figure 1, investment as a part of the overall economy (represented by the GDP) has been falling over the years. How are seven million jobs being created in this scenario? In fact, let’s take a look at the incremental investment to incremental GDP ratio, over the years, in Figure 2. This basically plots the ratio of the increase in investment during the course of a year, against the increase in GDP during that year.

Figure 2. 

The incremental investment to incremental GDP Ratio between 2013-2014 and the current financial year (2017-2018) has varied between 8-25 per cent. India seems to have discovered a new economic model of creating jobs without a pickup in investment, i.e., if seven million jobs are indeed being created every year.

Companies tend to expand when they are unable to meet the demand from their current production capacity. The Reserve Bank of India carries out capacity utilisation surveys of manufacturing firms every three months. The latest survey for the period April to June 2017, found that capacity utilisation stood at 71.2 per cent. In fact, capacity utilisation has varied between 70 and 72 per cent for a while now.

As economist Madan Sabnanvis writes in his new book Economics of India-How to Fool all People for all Times: “The capacity utilisation rate has gotten stuck in the region of 70-72 per cent which means two things: first demand is absent, and second, even if it does increase, production can be scaled up without going in for fresh investment.”

The question is how are jobs being created without expansion?

In fact, the data from Centre for Monitoring Indian Economy suggests that new projects announcement in the period of three months ending December 2017, came in at a 13-year low. Take a look at Figure 3.

Figure: 3 

The new investment projects announced during the period of three months up to December 2017, were the lowest since the period of three months ending June 2004. This is a clear indication of the fact that the industry is not betting much on India’s economic future because if they were they would be expanding at a much faster rate and announcing more investment projects than they currently are.

The industrialists may say good things about India in the public domain and in the media, but they are clearly not betting much of their money on the country. And this brings us back to the question, if the industry is not investing, how are jobs being created?

Let’s take a look at the money lent by banks to industry, in Figure 4.

Figure 4: 

The bank lending to industry has been falling over the years. In fact, lately, it has been in negative territory, which means that the overall bank lending to industry has contracted.

This means that on the whole, banks haven’t lent a single new rupee to industry, lately. And that is another good example of industries not expanding. This brings us back to the question: how are seven million formal jobs being created then?

One argument that can be offered against Figure 5 is that over the years many corporates haven’t been borrowing from banks to meet their funding needs. This is true. But this is largely limited to large corporates. Global experience suggests that jobs are actually created when micro, small and medium enterprises expand, and become bigger. In order to do that, they need to borrow.

How does the scene look when we leave out large corporates? Let’s take a look at Figure 5.

Figure 5: 

Bank lending to micro, small and medium enterprises, has been in negative territory for a while now. This basically means that the overall lending to these enterprises has contracted and not a single new rupee has been lent by banks to these firms. How are these firms investing and expanding and creating jobs?

Of course, manufacturing is not the only sector creating jobs. The services sector creates a huge number of jobs of India. One of the biggest job creators in the services sector are real estate companies, which are currently down in the dumps. The construction sector is also a heavy job creator, but with real estate being the way it is, construction is not doing too well either. The information technology sector is looking to shed jobs at the lower end, with robots taking over. Tourism was never a heavy employer of people, in the formal sector, which is what we are talking about here.

Arvind Panagariya, who was the vice chairman of the NITI Aayog, until August 2017, maintained during his tenure, that India was not creating jobs, because India’s entrepreneurs were not investing in labour intensive activities.

In fact, on August 25, 2017, a few days before his tenure ended, Panagariya said“The major impediment in job creation is that our entrepreneurs simply do not invest in labour intensive activities.”

This becomes clear from India’s exports. If one looks at labour intensive exports like textiles, electronic goods, gems & jewellery, leather and agriculture, exports have more or less remained flattish over the last few years. (For a detailed exposition on this, you can click here). So, how are jobs being created with exports remaining flat in labour intensive sectors? Further, if we do believe that seven million jobs are being created every year, then was one of the main economic advisers to the prime minister, wrong all along?

Also, if so many jobs are being created, why does India have so much underemployment. Take a look at Table 1.

Table 1: Percentage distribution of persons available for 12 months based on UPSS approach 

What does Table 1 tell us? It tells us that in rural India, only 52.7 per cent of the workforce which was looking for work all through the year, actually found it. 42.1 per cent of the workforce found work for six to 11 months. If there are so many jobs being created, why are these people finding it difficult to find work all through the year, is a question worth asking. Further, if so many people are finding jobs, why has economic growth slowed down over the years. Are these people earning and not spending money? Also, if there are so many jobs going around, why have the land-owning castes across the country been protesting and demanding reservations in government jobs. Is there an explanation for that?

In the end, there is way too much evidence against not enough jobs being created. Trying to brush that aside, on the basis of a shaky study, will do the nation way too much harm. As I keep saying, the first step towards solving a problem is acknowledging that it exists, otherwise there are enough people selling pakodas, bondas, sandwiches, timepass and what not, outside our offices. But that doesn’t really solve the problem.

Postscript: In order to understand the basic methodological flaws in the study carried out by Ghosh and Ghosh, I suggest you read this.

In order to understand the basic problems in using EPFO data to estimate jobs, I suggest you read this.

The column originally appeared in Equitymaster on January 22, 2018.

GDP Data Brings Us Back to the Basic Question: Where Are the Jobs?

jobs
Late last week, the central statistics office of the government of India declared its forecasts for the gross domestic product (GDP) growth for 2017-2018. The GDP is a measure of economic size and the GDP growth is a measure of economic growth.

The GDP growth for 2017-2018 is expected to be at 6.5 per cent. It is the slowest economic growth that the country will see after Narendra Modi took over as the prime minister. Take a look at Figure 1, which plots GDP growth.

Figure 1: 

This slowdown is a clear impact of the negative impacts of demonetisation continuing into 2017-2018, which was followed by the terribly botched up implementation of the Goods and Services Tax (GST).

Take a look at Figure 2, which basically plots the growth of various sectors.

Figure 2: 

Figure 2 tells us that agriculture and industry in 2017-2018, will slow down considerably in comparison to 2016-2017. Within industry, manufacturing will slow down considerably as well. The growth of the services sector continues to remain robust. Within the services sector, the public administration, defence and other services, which is basically a representation for the government, grew the fastest at 9.4 per cent (though it slowed down in comparison to last year).

What this basically means is that a fast growth in government expenditure in 2016-2017 and 2017-2018, pushed up economic growth, otherwise the economic growth would have been lower than what it finally turned out to be.

Now let’s take a look at investment to GDP ratio in Figure 3.

Figure 3: 

For the year 2017-2018, the investment to GDP ratio is expected to be at around 29 per cent of the GDP. This ratio has been falling since 2011-2012 and there have been no signs of improvement since then. I have taken data from 2011-2012 onwards because the new GDP series data being used since January 2015, has a back series starting from 2011-2012 only.

In fact, the data from Centre for Monitoring Indian Economy suggests that new projects announcement in the period of three months ending December 2017, came in at a 13-year low. Take a look at Figure 4.

Figure 4: 

The new investment projects announced during the period of three months up to December 2017, were the lowest since the period of three months ending June 2004. This is a clear indication of the fact that the industry is not betting much on India’s economic future because if they were they would be expanding at a much faster rate and announcing more investment projects than they currently are. The industrialists may say good things about India in the public domain and in the media, but they are clearly not betting much of their money on the country.

Unless, investment picks up, jobs can’t be created. And without jobs the one million youth entering the workforce every month or India’s so called demographic dividend, is likely to turn into a demographic disaster. Indeed, that is a very worrying point.

To conclude, the GDP data for 2017-2018, brings us back to that basic question: Where are the jobs?

The column originally appeared on Equitymaster on January 8, 2018.