What is True About Sugarcane in Maharashtra is Also True About Rice in Punjab


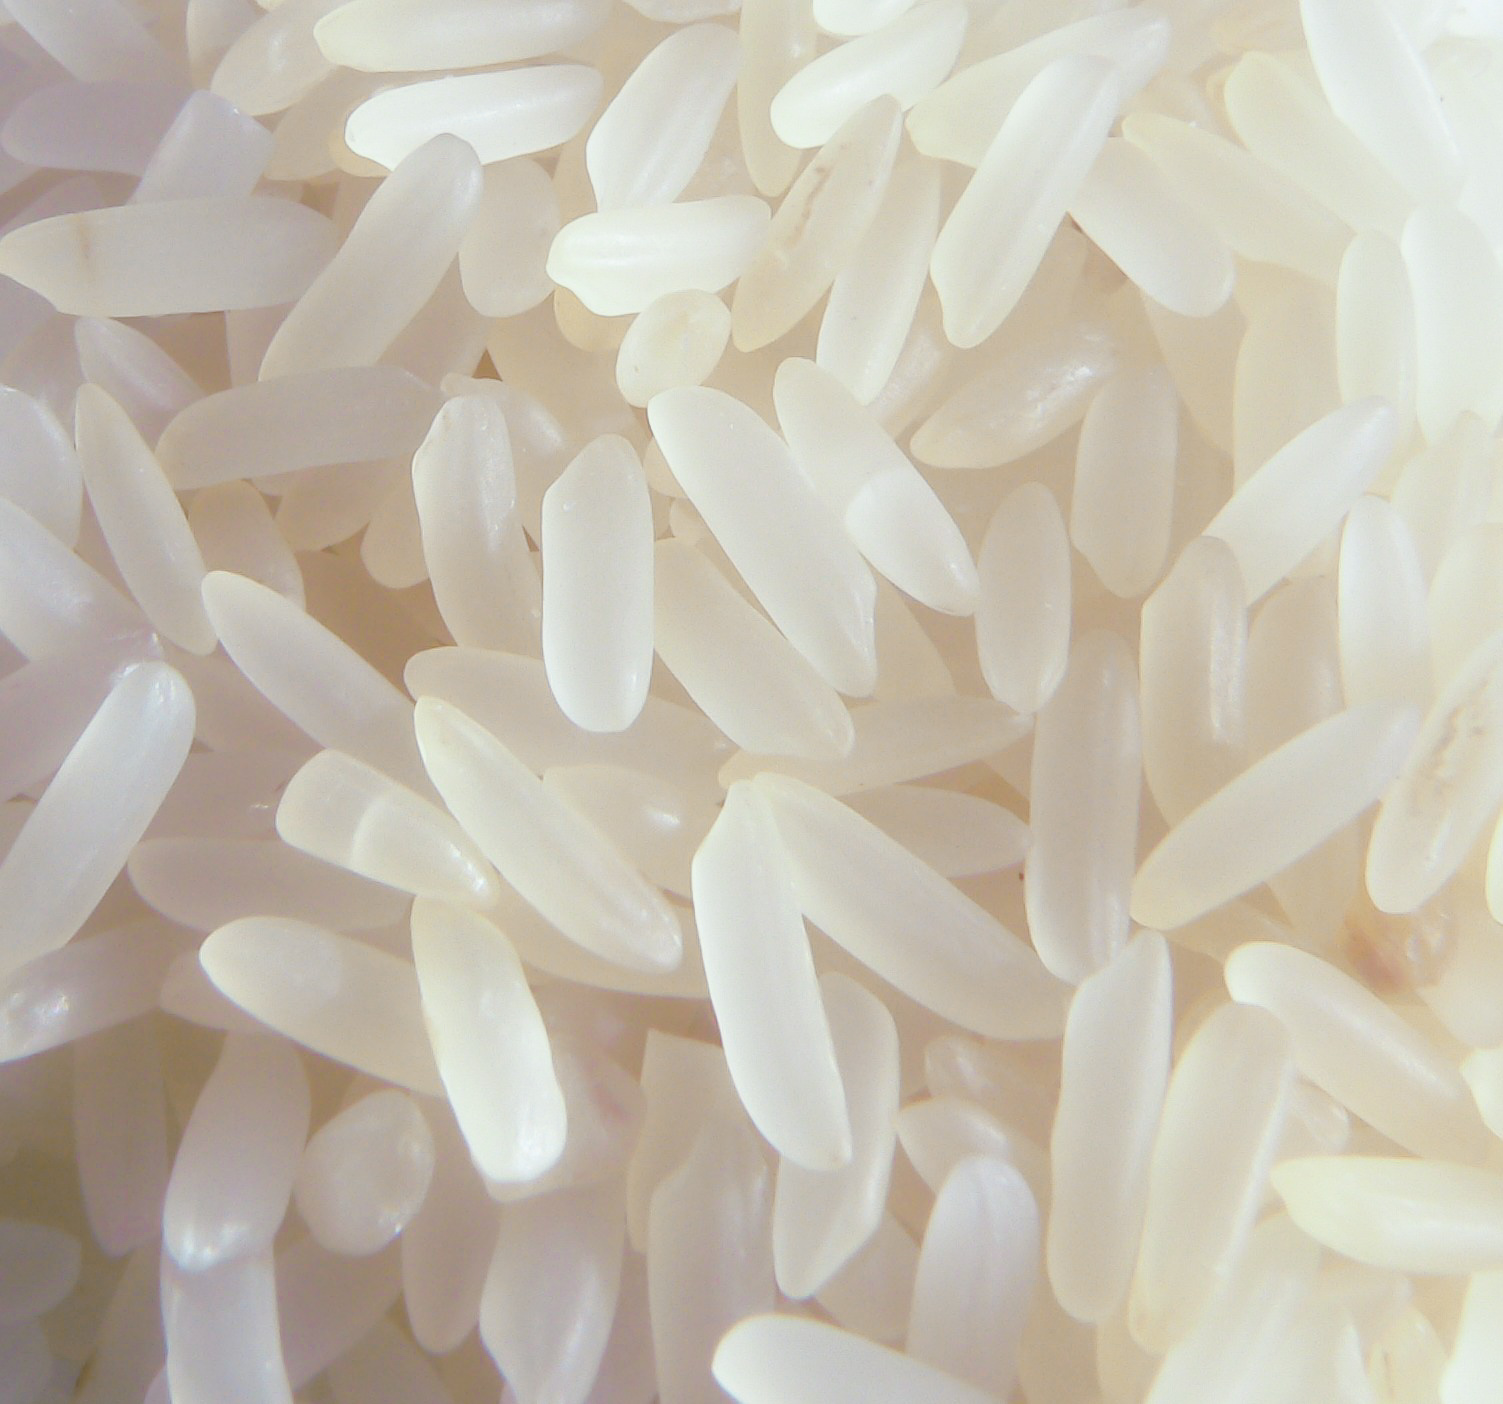
rice

A water-scarce state like Maharashtra should not be growing as much sugarcane as it does. Sugarcane is cultivated on less than four percent of the total cropped area in the state but uses 70% of the its irrigation water.

This is something that is happening in the production of rice in Punjab as well. Punjab, is basically a semi-arid area. The state is the third largest producer of rice. It produces 11.3% of the total rice produced in the country, with Uttar Pradesh and West Bengal producing 13.9% and 13.6% respectively.

The production of rice needs a lot of water. Given this, rice is really not something that should be grown in a semi-arid region. As the Commission for Agricultural Costs and Prices (CACP) in a report titled Price Policy for Kharif Crops—The Marketing Season for 2015-16 points out: “West Bengal, just as an example, consumes 2605 litres of water to produce a kilogram of rice compared to 5337 litres being guzzled by Punjab. The efficiency gap with respect to consumption of water in Punjab (the most efficient in terms of land productivity) is over 51 percent. This shows that the most efficient state in terms of land productivity is not the most efficient if other factor of production viz. water is factored into.”

What this clearly tells us is that rice farming in Punjab is a huge water-guzzler. The state government helps the farmers by ensuring that electricity is free, which essentially leads to a lot of over-pumping of ground water in the state.

As an August 2015 news-report in The Hindu Business Line points out: “According to the Central Ground Water Board, out of 137 blocks in Punjab, 110 come under the over-exploited category. Besides, the gross underpricing of electricity has encouraged the farmers to pump groundwater with minimal cost and effort.”

The CACP makes a broader point in a report titled document titled Price Policy for Sugarcane—2015-16 Sugar Season where it says: “Instead of focusing on economy in water use in agriculture, most state governments have been content with subsidising electricity for pumping irrigation water.”
Other than free electricity, there is another reason for such a huge amount of rice being produced in Punjab. The government of India announces the minimum support price(MSP) for 23 crops, every year. Nevertheless, as far as procurement is concerned, it primarily buys rice, wheat and cotton, through the Food Corporation of India(FCI) and other state procurement agencies.

The awareness of this procurement among farmers varies throughout the country. In Punjab the awareness is very high. As the Economic Survey for 2015-2016 points out: “In Punjab and Haryana, almost all paddy and wheat farmers are aware of the MSP policy.”

Over and above this, the procurement is also not uniformly carried out throughout the country. In 2013-2014, Punjab produced 11.1 million tonnes of rice. Of this, nearly 11 million tonnes was marketable surplus. The state consumed only 0.1 million tonnes of rice, given that rice is not a staple food in Punjab. The Punjabis are primarily roti eaters and roti is made from wheat.

Of this, 8.1 million tonnes was procured by the government. This is the highest among all the states in the country, both in absolute terms as well as a proportion of total production. Also, nearly one fourth of the total rice procured by the government is procured from Punjab.

Compare this to the state of West Bengal, which produced 15 million tonnes of rice in 2013-2014, with a marketable surplus of 9.5 million tonnes (given that Bengalis are primarily rice-eaters). Of this only 1.7 million tonnes was procured.

As the CACP points out: “For instance, there was almost negligible procurement of rice in Assam during 2013-14, even though it contributed 4.6 percent of the total rice production. The situation in other eastern states such as Bihar, West Bengal is somewhat better than that of Assam but not good enough when these states are compared with Punjab.

This is a point that is made in the Economic Survey as well: “Even for paddy and wheat where active procurement occurs, there is a substantial variation across states – with only half or less paddy and wheat farmers reporting awareness of MSP, especially in states such as, Gujarat, Maharashtra, Rajasthan, Andhra Pradesh and Jharkhand.”

The awareness of MSP for rice essentially ensures that the farmers of Punjab are actually producing more rice than they should, given that they have a ready customer in the government. The free electricity is of course another reason. This has also led to a situation wherein the country is producing more rice than what it needs for consumption and is not producing enough other agricultural products like pulses.

In fact, any export of an agricultural product essentially implies export of water. As CACP points out: “When our country exports about 100 lakh tonnes [10 million tonnes] of rice annually, it implies that over 38 billion cubic meter of virtual water is exported.” In a country as water deficient as India is, this is not a good thing.

Much of this rice is produced by pumping ground water and this has had a huge impact in the state of Punjab. As CACP points out: “Given that this water is extracted by mining groundwater, as is being done in much of the Punjab and Haryana belt (particularly in case of rice), where water table is receding by 33 cm each year, thereby shrinking its per-capita availability, high import duty of 70 to 80 percent is perverse and conveys wrong signals on use of water (and also power).”

Cheap electricity and an ineffective procurement policy have essentially led to a situation where India’s water problem will only get worse in the days to come. As the Economic Survey points out: “India has much lower levels of water per capita than Brazil, one of the world’s leading agricultural countries. This constraint is exacerbated because, while Brazil and China use approximately 60 per cent of their renewable fresh water resources for agriculture, India uses a little over 90 per cent.”

The column originally appeared on Vivek Kaul’s Diary on April 14, 2016
IPL Will Use ZERO Percent of the Water That Sugarcane Does

Indian-Premier-League-IPL-logo

The Board for Control of Cricket in India (BCCI) is where politicians from across party lines come together. And given this, you don’t expect it to be the most transparent and fair institution going around. Over and above this, the BCCI also has monopolistic tendencies. Hence, in most situations I would not support BCCI on an issue.

Nevertheless, the entire issue of moving the Indian Premier League(IPL) T20 cricket tournament out of the state of Maharashtra, in order to save water, is basically nonsense. The real issue when it comes to a water crisis in Maharashtra is the agricultural production of sugarcane and not IPL. Allow me to explain.

Take a look at the following chart.

Chart-1.2: State-wise Shares in Production of Sugarcane and Sugar

Maharashtra is the second largest producer of sugarcane in the country after Uttar Pradesh. It is also the largest producer of sugar, which is a by-product of sugarcane. Maharashtra produces more sugar than Uttar Pradesh primarily because the sugarcane produced in the state has a higher sucrose content. In fact, among all states, Maharasthra has the highest sugar recovery rate of 11.1% from sugarcane.
Getting back to the issue of water and sugarcane. As TN Ninan writes in The Turn of the Tortoise: “Nationally, the bulk of the water is used for agriculture…Cropping patters have developed such that water-intensive crops are grown in water-scare areas—like [rice] paddy in Haryana and sugar cane in Maharashtra.”

In fact, Maharashtra uses a lot more water to produce sugarcane than other states like Bihar. As the Commission for Agricultural Costs and Prices(CACP) points out in a document titled Price Policy for Sugarcane—2015-16 Sugar Season: “Water productivity analysis shows that Bihar consumes just 822 litres of water to produce a kilogram of sugar compared to over 2100 litres in Maharashtra, and more than 2200 litres each in Andhra Pradesh and Tamil Nadu. Thus, Andhra Pradesh, Maharashtra and Tamil Nadu consume an additional 1300 to 1400 litres of water over and above what it takes Bihar to produce a kilogram of sugar.”

Andhra Pradesh produces only 4% of India’s sugarcane, so it doesn’t really matter much, if it is a water guzzler. Maharashtra and Tamil Nadu between them produce nearly one-third of India’s sugarcane (22% of Maharashtra and 10% for Tamil Nadu). Given that they use a huge amount of water doing so, this shouldn’t be the case.

As CACP further points out in the case of Maharashtra: “In Maharashtra, sugarcane cultivation, which is on less than 4 percent of the total cropped area of the state, takes away almost 70 percent of irrigation water in the state. This leads to massive inequity in the use of water within the state.

As mentioned earlier, it takes 2100 litres of water to produce one kilogram of sugar in Maharashtra. This basically means that it will take around 2100000 litres or 2.1 million litres of water to produce one tonne or 1000 kilograms of sugar.

It is estimated that the twenty IPL cricket matches being played in Maharashtra would end up using six million litres of water. How has this estimate been arrived at? A public interest litigation has been filed in the Bombay High Court stating that IPL cricket matches should be moved out of Maharashtra.

Ankita Verma, the lawyer for the petitioners told Rediff.com: “International maintenance for pitch guidelines state that for each match you need three lakh litres of water for one ground. If you multiply that for the 20 matches that will be played here, you will come to the figure of 60 lakh litres [or 6 million litres] of water.”

The BCCI puts the number at four million litres, reports Mint. Let’s take the higher of the two numbers of six million litres of water. As mentioned earlier, it takes 2.1 million litres of water to grow one tonne of sugarcane. Hence, for IPL the total water being used is what would have been good enough to produce less than three tonnes of sugarcane, actually 2.86 tonnes to be very precise.

Hence, the entire argument of IPL cricket matches leading to a wastage of water is basically nonsense. Sugarcane is the real water guzzler in the state of Maharashtra. In 2013-2014, the state produced 75,384,000 tonnes of sugarcane, which would have needed around 158,306,400 million litres of water (75,384,000 x 2.1).

On the other hand, IPL this year will end up using six million litres of water, which would essentially be good enough to produce three tonnes of sugarcane.

So the total amount of water used by IPL will be around 0.0000038%(6.1 million litres expressed as a percentage of 158,306,400 million litres) of the water used to produce sugarcane in Maharashtra in 2013-2014. The proportion is so small that we can even round it off to 0%. This entire argument to move IPL out of Maharashtra is basically nonsense. The real issue is the production of sugarcane in the state.

Of course, no noise is being made against the excessive consumption of water in the production of sugarcane primarily because some of the bigger politicians of the state of Maharashtra are also sugar barons.

There are other issues also that need to be discussed here. India produces much more sugarcane than it consumes. The CACP estimates that the total demand for sugar in India (domestic demand plus bulk demand) is at 24.3 million tonnes. The domestic demand being 12.3 million tonnes and the bulk demand being 12 million tonnes.

In 2014-2015, India produced around 28 million tonnes of sugar. This is 3.7 million tonnes more than demand. This excess sugar is exported. We need to realise that when we export sugar, we are essentially exporting water. As Ninan points out: “Growing sugar cane, even more water hungry than[rice] paddy, in water-scarce Maharashtra is equally contraindicated—especially since the country happens to be surplus in sugar most of the time, and exporting sugar amounts to exporting water.”

And a country as water-constrained as India is, should not be exporting water. To conclude, as CACP points out: “Future growth of cane in Maharashtra is likely to be severely hampered by scarce water supplies unless much of sugarcane is put on drip irrigation or varieties are evolved that use less water. Given that sugarcane is a water guzzling crop, its long term development must ensure that water pricing policies are formulated in a manner that reflects its scarcity.”

And this is something worth thinking about.

Disclosure: The basic idea for writing this column came after reading Sunil Jain’s column titled IPL vs sugarcane: That’s really the equation in Maharashtra in The Financial Express.

The column originally appeared on Vivek Kaul’s Diary on April 12, 2016


Why India should be growing dal and not sugarcane

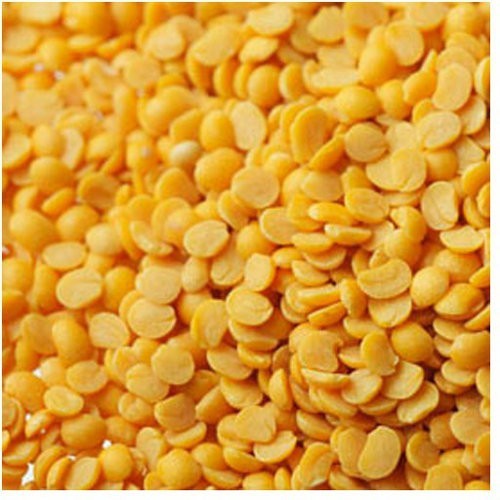
Toor_Dal_Tur_dal

Dal prices, in particular tur dal (also known as arhar dal or pigeon pea) prices, have been on fire. The price of tur dal even crossed Rs 200 per kg sometime back. As I write this, the price of tur dal is still hovering around Rs 200 per kg.

This trend has prevailed over the last few years where dal prices have reached astonishingly high levels at various points of time. Why is that the case? The reasons are both from the demand as well as supply side.

As rural incomes have gone up over the last few years, the demand for dal as a source of protein has gone up. The supply hasn’t been able to keep pace. Over and above this, short term weather trends have led to massive spikes in dal prices.

In 2007-2008, India produced 3.08 million tonnes of tur dal. In 2014-2015, the total production was down to around 2.78 million tonnes, which was lower than the production in 2007-2008. The total production in 2013-2014 had stood at 3.34 million tonnes.

Hence, between 2013-2014 and 2014-2015, there was a significant fall in production of tur dal. Economists Ashok Gulati and Shweta Saini in a column in The Indian Express estimate that the “the consumption of tur hovers between 3.3 to four million tonnes.” Hence, there is a clear gap between the demand for and the supply of tur dal.

What has not helped is the fact that the yield has more or less remained flat. In 2007-2008, 826 kg of tur dal was produced per hectare. By 2013-2014, this number had risen to only 859 kg per hectare, at a rate of less than 1% per year (around 0.7% to be precise).

As Dharmakirti Joshi and Dipti Deshpande economists at Crisil Research point out in a recent research note titled Every third year, pulses catch price-fire: “Pulses account for about 20% of area under foodgrain production, but less than 10% of foodgrain output. Also, over time, production of pulses has failed to catch up with demand. Output has grown less than 2% average in the last 20 years, while acreage has grown even lesser at 0.8%. Not surprisingly, yield rose only 0.9%.”

There are fundamental reasons behind why tur dal prices in particular and dal prices in general have been on fire. Over and above this there is a more recent reason as well. The monsoon this year was at 86% of its long period average. And this did not help either. As Joshi and Deshpande point out: “Pulses are highly risk-prone crops because most of the production is rain-dependent. Barely 16% of total pulses area is covered by irrigation and hence the crop is highly vulnerable to monsoon shocks.”

Also, the current incentive structure of the government is in favour of growing rice, wheat and sugarcane. As Gulati and Saini point out: “The government needs to create a crop-neutral incentive structure for farmers, which is at present skewed in favour of rice, wheat and sugarcane. Much of the subsidies on fertilisers, power, and irrigation go to these crops. These subsidies amount to more than Rs 10,000/ hectare. If the same amount were given to pulse growers, they would be incentivised to produce more.”

The government declares a minimum support price for rice and wheat and actively procures grains through the Food Corporation of India and other agencies.

It declares a minimum support prices for dal as well, but doesn’t actively procure it. Given this, while the farmer is sure of the government buying the rice and wheat that he produces at a certain time, the same certainty doesn’t exist in case of dal. As Joshi and Deshpande point out: “Production is also risky because of inadequate post-harvest storage facilities, absence of assured marketing outlets (unlike wheat and rice) and lack of government assurance for purchase under public distribution.”

The irony is that with economic incentives like assured procurement by the government lead to the farmers producing water intensive crops in water-scarce areas. As TN Ninan writes in The Turn of the Tortoise—The Challenge and Promise of India’s Future: “Punjab and Haryana need to change their choice of crops and reduce growing water-hungry rice…Growing sugar cane, even more water hungry than paddy, in water-scarce Maharashtra is equally contraindicated—especially since the country happens to be surplus in sugar most of the time, and exporting sugar amounts to exporting water.”

As Ninan further points out: “The high cane prices make the crop attractive to farmers who otherwise might have grown less water-intensive crops, especially in stretches where water is not abundant. But one price distortion leads to another, and then another.”

With this entire structure in place enough dal doesn’t get grown. As Gulati and Saini point out in another column in The Financial Express: “Pulses need much less water, are nitrogen-fixing, and therefore do not need much chemical fertilisers either. They can thus save on large input subsidies (power, irrigation and fertilisers), much of which are normally cornered by rice, wheat and sugarcane as these crops have high irrigation cover and higher fertiliser consumption.”

So even though growing dal needs lesser water not enough dal is grown because the prevailing economic incentives go against it. And this anomaly is not going to go away anytime soon.

The column originally appeared on The Daily Reckoning on Nov 30, 2015

‘Dal’onomics 101: Why dal prices have been going up

Toor_Dal_Tur_dal

One of the first things that gets taught in any basic course on economics (or Economics 101) is the substitution effect. This is a scenario where high prices of one commodity pushes consumers into consuming another commodity. If lamb meat prices are too high, consumers move to eating chicken. If coffee prices go up, consumers may move towards drinking the more affordable tea.

In the rational world of theoretical economics this makes tremendous sense. But things are a little different in real life. Take the case of the recent rapid rise in the price of various pulses, tur dal in particular.  The prices recently crossed Rs 200 per kg. The annual increase in price has been more than 100%. In this scenario is the Indian consumer substituting tur dal for something else?

The most logical thing to do would be to consume other pulses like urad, moong, etc. But the prices of other pulses have also risen at a very rapid rate, though not as fast as tur dal. Further, it is also a matter of taste. If the consumer is used to a certain kind of food, it is not so easy to switch to something else overnight.

As economist Subir Gorkarn writes in a recent column in the Business Standard: “Unquestionably, there is some substitution going on between different pulses, but large parts of the country are predominantly tur consumers, while, in others, rising incomes create a long-term, superior-good shift towards tur.”

There have been several media reports talking about how chicken is now cheaper than dal.

It has been jocularly suggested on the social media that chicken being cheaper than dal will lead to regular dal eaters moving to regularly eating chicken. Only if it was as simple as that.

While chicken may be cheaper than dal, it still costs more than Rs 100 per kg and hence, cannot really replace dal as an everyday staple. Dal-chawal or dal-roti is an everyday staple for many Indians. And this cannot be replaced by chicken, unless it starts to cost what dal used to up until a few years back.

Also, it is worth remembering here that dal is a huge source of protein. Further, as incomes go up and people eat better, the demand for food high on protein tends to go up. Data from ministry of agriculture points out that the production of dal has gone up from 14.76 million tonnes in 2007-2008 to 19.77 million tonnes in 2013-2014. In 2014-2015, the total production fell to 17.2 million tonnes. The yield has gone up from 625 kg per hectare in 2007-2008 to 798 kg per hectare in 2013-2014.

Despite an increase in yield as well as production, the troubling point is that the per capita availability of pulses has come down over the long run. A 2014 research report titled India’s Pulses Scenario authored by the National Council of Applied Economics Research (NCAER) points out: “Pulse production has recorded less than one percent annual growth during the past 40 years, which is less than half of the growth rate in Indian human population. Consequently per capita production and availability of pulses in the country has witnessed sharp decline.”

“Per capita net pulse availability has declined from around 60 grams per day in the 1950s to 40 grams in the 1980s and further to around 35 grams per day in 2000s.  However, in the past four years, there has been significant increase in consumption averaging around 50 grams due to somewhat higher production,” the report further points out.

This largely explains why despite an increase in yields as well as overall production, dal prices have gone up over the last few years, with huge spurts in between. How can this be corrected?

A recent newsreport in the Mint points out that a part of the correction has automatically happened through the substitution effect. People are eating more eggs than they were in the past.

Between 1961 and 2013, the per capita availability of eggs has jumped from 7 to 58. At the same time consumption data provided by the National Sample Survey Office suggests “a declining trend in the consumption of pulses—from 11.8 kg per person per year in 1987-88 to 8.4 kg per person per year in 2009-10.”

During the same period “the consumption of eggs went up from 6 per year to 21 per year in rural India and from 17 to 32 in urban areas.”

This is something that the World Health Organisation also suggests when they say: “There is a strong positive relationship between the level of income and the consumption of animal protein, with the consumption of meat, milk and eggs increasing at the expense of staple foods.”

Nevertheless, what about the vegetarians? A significant proportion of Indians are vegetarians and that also needs to be taken into account. They need to eat dal for their protein needs.

The area under production of pulses over the decades has more or less been stagnant. In 1980-1981, the area under production had stood at 22.46 million hectares. This has increased marginally over the years to 24.79 million hectares in 2013-2014. In fact, the number was at 22.09 million hectares in 2008-2009.

The yield in 1980-81 was at 473 kg per hectare. It has since jumped to 798 per kg hectare in 2013-2014. This is an increase of around 1.6% per year. The Indian population has grown at a faster rate.

Further, as the NCAER research report referred to earlier points out: “Most of the increase in pulse production in recent years has been in gram. Low pulse yield in India compared to other counties is attributed to poor spread of improved varieties and technologies, abrupt climatic changes, vulnerability to pests and diseases, and generally declining growth rate of total factor productivity.”

Take the case of tur dal. Between 2007-2008 and 2013-2014, the total production increased from 3.08 million tonnes to 3.34 million tonnes. During the same period the production of gram jumped from 5.75 million tonnes to 9.79 million tonnes. So once one adjusts for the production of gram, the production of other pulses hasn’t gone up by much though their demand has.

A major reason for the area under production of pulses remaining stagnant can be explained the way economic incentives are have been structured for Indian farmers. The incentives are heavily skewed towards production of rice, wheat and sugarcane. And that explains why we have excess stock of these food products.

If prices of pulses are to come down in the years to come, the area under production needs to go up. For that to happen, the economic incentives the way they are currently structured, need to change. And that’s ‘dal’onomics 101 for you.

The column was originally published on Swarajyamag.com on Oct 28, 2015

Why food prices will continue to remain high in the coming years

Vivek Kaul

Buried somewhere in the Reserve Bank of India‘s first quarter review of monetary policy released yesterday is the following paragraph:
The stickiness in inflation, despite the significant growth slowdown, was largely on account of high primary food inflation, which was in double-digits during Q1 of 2012-13 due to an unusual spike in vegetable prices and sustained high inflation in protein items.
In simple English what this means is that despite economic growth slowing down inflation continued to remain high because of high food inflation. The Reserve Bank of India (RBI) has not seen the last of food inflation and there are several reasons why food inflation will continue to remain high in the days to come.
Below average rainfall: The immediate reason for the food prices continuing to remain is the below average rainfall this monsoon season. As the RBI said in the first quarter review of monetary policy:
During the ongoing monsoon season, rainfall up to July 25, 2012 was 22 per cent below its long period average (LPA). The Reserve Bank’s production weighted rainfall index (PWRI) showed an even higher deficit of 24 per cent. Further, the distribution of rainfall was very uneven, with the North-West region registering the highest deficit of about 39 per cent of LPA. If the rainfall deficiency persists, agricultural production could be adversely impacted.
The availability of water can make a huge difference to the agricultural output in India. Areas fed by canals form only around 40% of the total arable land in India. The remaining 60% are dependent on rains. With deficient rains this year the current khareef crop is likely to be impacted with production not being enough to meet demand. This will lead to food prices going up in the days to come.
Rural India is eating better: The various social schemes being run by the current United Progressive Alliance (UPA) government have put more money into the hands of rural India. The income of rural India has more than doubled in the last five years. One thing that seems to have happened because of this is that people are eating better than before. Economists are of the opinion that as income of people rises above the subsistence level of $1000 per year, a substantial portion of the new money is spent on food. People eat more and better quality food. At the same time they also move from cereal based diets to more protein based diets. In major parts of the world this means that people start consuming more meat. But India has a lot of vegetarians and hence consumption of other high protein food items like dal, milk and other dairy based products has gone up, pushing their prices up. This is likely to continue in the months and years to come given the social commitment of the current UPA government. If the proposed Right to Food Act goes through you could see a further increase in food prices.
The Japan syndrome: As a densely populated country industrialises, the area under agriculture tends to go down. This phenomenon was first observed in Japan, and has since then been observed in South Korea, Taiwan, and very recently China. As Lester R Brown points out in Outgrowing the Earth: The Food Security Challenge in an Age of Falling Water Tables and Rising Temperatures “First, as a country industrialises and modernises cropland is used for industrial and residential development. As automobile ownership spreads, the construction of roads, highways, and parking lots…takes valuable land away from agriculture…. Secondly as rapid industrialisation pulls labour out of the countryside, it often leads to less double cropping, a practice that depends on quickly harvesting one grain crop once its ripe and immediately preparing the seedbed for the next crop…Third, as incomes rise, diets diversify, generating demand for more fruits and vegetables. This in turn leads farmers to shift land from grain to these more profitable high-value crops.”
This is a long term phenomenon which is clearly playing out in India right now. Just drive around towards the outer limits of the city you live in and you will realize that what was once agricultural land has been taken over to build malls, apartments, offices etc. This leaves less area to grow vegetables, cereals and other crops, pushing up their prices in turn. Depleting aquifers: A huge amount of increase in the irrigation of crops across the gangetic plane, India’s agricultural heartland have substantially depleted the aquifers or the underground water tables. As a report by DWS Investments points out “Dramatic increases in the irrigation of crops across northern India have substantially depleted the region’s groundwater. Between April 2002 and August 2008, aquifers lost a total of more than 54 cubic kilometers per year. That decrease in groundwater is even more than double the capacity of India’s largest reservoir.”
While this data is around four years old there is no reason to believe that the situation could have improved in the last four years. It could only have got worse. This is something that Brown agrees with in his book Outgrowing the Earth. He writes “the extensive overpumping of aquifers in India will deprive farmers of irrigation water and will also reduce grain production”.
Climate change also threatens food security: As the following table points out Indian agriculture has very low productivity when it comes to other parts of the world. Even Bangladesh does better than us when it comes to producing rice.
Comparing productivity of Indian agriculture with the world (kg/ha)
Country Paddy Country Wheat Country Maize
World 4,223 World 2,829 World 5,010
Bangladesh 4,012 China 4,608 Agentina 7,666
Brazil 3,826 Egypt 6,478 Canada 8,511
China 6,422 France 6,256 China 5,151
India 3,303 India 2,704 India 2,440
Indonesia 4,705 Italy 3,568 Italy 9,144
Japan 6,511 Spain 3,470 Turkey 6,838
USA 8,092 United Kingdom0 7,225 USA 9,458
Source: Agriculture Statistics at a Glance /Kotak GameChanger Report
Even this production is threatened now because of rising global temperature which beyond a certain point tends to reduce the amount of crop produced. As Lester Brown told me in an interview I did for the Daily News and Analysis (DNA) a few years back “For each degree celsius rise in temperature above the norm during the growing season, farmers can expect a 10% decline in wheat, rice, and corn yields. Since 1970, the earth’s average surface temperature has increased by 0.6 degrees Celsius, or roughly 1 degree Fahrenheit.”
As the earth’s temperature rises it has led to glaciers melting. “Nowhere is this of more concern than in Asia. It is the ice melt from glaciers in the Himalayas and on the Tibetan plateau that sustain the major rivers of India and China, and the irrigation systems that depend on them, during the dry season. In Asia, both wheat and rice fields depend on this water. China is the world’s leading wheat producer. India is No 2 (The US is third.) These two countries also dominate the world rice harvest. Whatever happens to the wheat and rice harvests in these two population giants will affect food prices everywhere. Indeed, the projected melting of the glaciers on which these two countries depend presents the most massive threat to food security humanity has ever faced,” said Brown.
Cars and people are competing for grains: As the price of oil keeps going up, the world has started to look for alternate sources of fuel to run cars and other forms of transport around the world. One such fuel is ethanol which is made from corn and sugarcane in different parts of the world. In Brazil, a lot of cars run on ethanol, which is produced using sugarcane. So if oil prices go up, ethanol becomes more viable as an alternate fuel. And this pushes up the price of ethanol input, i.e. sugarcane. With lesser sugarcane available to produce sugar, the price of sugar also goes up. The United States uses corn to make ethanol. So oil prices going up leads to corn prices going up as well. As Brown put it “If the fuel value of grain exceeds its food value, the market will simply move the commodity into the energy economy. If the price of oil jumps to $100 a barrel, the price of grain will follow it upward. If oil goes to $200, grain will follow. From an agricultural vantage point, the world’s appetite for crop-based fuels is insatiable. The grain required to fill an SUV’s 25-gallon tank with ethanol just once will feed one person for a whole year. If the entire US grain harvest were to be converted to ethanol, it would satisfy at most 18% of US auto fuel needs.”
Given these reasons the food prices are likely to remain high in the months and years to come. And the Reserve Bank of India can fiddle around with the interest rates as much as it wants to, but there is no way it can control food prices.
(The article originally appeared on www.firstpost.com on August 2,2012. http://www.firstpost.com/economy/why-food-prices-will-continue-to-rise-in-the-coming-years-400532.html)
(Vivek Kaul is a writer and can be reached at [email protected])