In 10 days time, it will be a year, since the prime minister Narendra Modi, made his rather “infamous” decision to demonetise Rs 500 and Rs 1,000 notes.
One of the claimed successes of demonetisation has been that the cash to gross domestic product (GDP) ratio has come down. In a speech made on October 4, 2017, Modi said: “Demontisation के बाद Cash to GDP Ratio अब 9 प्रतिशत पर आ गया है। (after demonetisation, the cash to GDP ratio has come down to 9 per cent.”
Let’s take a look at Figure 1, it plots the currency in circulation (a measure of cash in the financial system) on a weekly basis, from the week before demonetisation was announced.
Figure 1:
Figure 1 clearly tells us that currency in circulation has still not come back to the level it was before demonetisation was announced. As on October 20, 2017, the currency in circulation was at 91.6 per cent of the currency in circulation as on November 4, 2016, four days before demonetisation was announced.
Now let’s calculate the currency in circulation to GDP ratio (cash to GDP ratio). As on March 31, 2017, the cash to GDP ratio had stood at 8.8 per cent. How did things look as on June 30, 2017? The cash to GDP ratio had improved to 9.9 per cent of the GDP.
How did things look before demonetisation? As on March 31, 2017, the cash to GDP ratio had stood at 12.2 per cent. Currently, it must be a little over 10 per cent of GDP (the exact figure can be calculated only once the GDP number as on September 30, 2017, becomes available).
This fall in cash to GDP ratio is being passed off as an achievement and the fact that nation as a whole has become more honest. As Modi said in the speech referred to earlier in the piece: “भाइयों और बहनों, इस सरकार ने देश में संस्थागत ईमानदारी को मजबूत करने का काम किया है। ये सरकार के अथक परिश्रम का ही परिणाम है कि आज देश की अर्थव्यवस्था कम Cash के साथ चल रही है। (Brothers and sisters, this government has worked to strengthen the institutional honesty of the country. It is due to the tireless hard-work of this government that today the country’s economy is running on less cash.)”
There are two points being made here. The first point is that less cash in the financial system means more honesty. The second point is that it is because of the hard work of the government that the country is running on less cash. Let’s take the second point first.
When PM Modi decided to demonetise Rs 500 and Rs 1,000 notes, in one shot he made 86.4 per cent of the currency in circulation useless, overnight. This impacted the economic activity in the country, given that bulk of the economic transactions in India (anywhere from 80 per cent to 98 per cent, depending on which estimate you believe) are carried out in cash.
This slowdown in growth of economic activity has continued. Ultimately, economic activity translates into economic growth.
For the period of three months ending March 2017 and June 2017, the non-government part of the GDP (which forms around 90 per cent of the GDP) has grown by a little over 4 per cent. When growth in economic activity slows down, the growth in currency in circulation is bound to be impacted as well.
So, yes, the hard work of the government has led to a lower cash to GDP ratio, but at the cost of slowing down economic activity. Hence, claiming this as success, is more of trying to build a narrative around demonetisation being successful, rather than being an actual success of any sort.
Another point that needs to be looked at here are digital transactions. Take a look at Figure 2. It plots the total value of digital transactions over a period of time. It does not take RTGS transactions (which are over Rs 2 lakh and are usually carried out by banks to settle among themselves) into account.
Figure 2:
As Figure 2 clearly tells us, the total value of digital transactions is now lower than the months running up to demonetisation. This basically tells us that digital transactions haven’t replaced cash transactions. Hence, economic transactions which were earlier carried out in cash are still being carried out in cash.
This buttresses the point I made earlier about the cash to GDP ratio coming down because economic transactions are not growing at the same rate as they were growing earlier. Hence, a lot of money continues to remain deposited in banks. And this means a slower growth in currency in circulation, and as a result a lower cash to GDP ratio.
Now let’s talk about a lower cash to GDP ratio meaning that the country has become more honest. This is something I have addressed earlier as well, in February. Take a look Figure 3. It basically plots the cash to GDP ratio of different countries.
Figure 3:
Take a look at Figure 3. Japan has the highest cash to GDP ratio at 19.4 per cent. India is nearly half of that at around a little over 10 per cent? Is India a more honest nation than Japan? As per the Transparency International’s Corruption Perception Index for 2016, Japan is the twentieth least corrupt country in the world. India stands at the 79th position, despite having a much lower cash to GDP ratio.
Or take the case of Brazil, which has a cash to GDP ratio of 3.31 per cent. Like India, it is the 79th least corrupt country in the world. Then there is the Eurozone (country’s which basically use euro as their currency). Their cash to GDP ratio is higher than that of India. Is the Eurozone more corrupt than India?
Hence, the link between a low cash to GDP ratio and low corruption is basically very weak. It is basically something that the Modi government has invented in order to build a positive narrative around demonetisation.
To conclude, there is enough data to suggest that a lower cash to GDP ratio is a reason to worry and not a reason to celebrate. Hope, the Modi government, at least internally realises this.
The Bhartiya Janata Party (BJP) led National Democratic Alliance (NDA) government will celebrate November 8, as the anti-black money day. On November 8, last year, the Narendra Modi government had demonetised Rs 500 and Rs 1,000 notes. This was seen as an attack on the huge amount of black money in the Indian financial system.
In the end, it turned out to be a legal money laundering scheme and nothing else. After demonetisation, the prime minister Modi has continued to maintain a stance against black money in almost all his public posturing. All this posturing reminds me of a line from the Salman Khan starrer Wanted: “Ek baar jo maine commitment kar di, phir main apne aap ki bhi nahi sunta (Once I have committed to something, then I don’t even listen to myself).
Nevertheless, how serious is the Modi government and the prime minister himself about tackling the black money menace? Recently, the prime minister was in Gujarat and in a bid to reach out to the traders who have conventionally supported the BJP in the state, over the few decades, he said: “In the last few months, 27 lakh additional people have registered themselves for this indirect tax [i.e. the Goods and Services Tax]… No businessmen wants to indulge in tax evasion. But tax rules, system, tax officials and even politicians are forcing them to do it…I know, that those who are joining have fear that their past records will be checked. I assure you that no tax officials will be allowed to open past records of those who want to come in the mainstream.”
What is the prime minister saying here: A bunch of people have been afraid of coming on to the Goods and Services Tax system because the declarations they make now and in the months to come, will give the government a good idea about the kind of money they were making in the past. The government also has the details on the kind of tax they have paid in the past [if at all any]. Hence, it is clearly in a position to estimate the total amount of taxes that were not paid in the past.
The prime minister was simply trying to assure the people of the state of Gujarat that the past records will not be checked and they won’t get tax demands from the government. This assurance raises a number of questions:
a) Does the law of the land change, simply because there is an assembly election in the state?
b) Is the commitment to eliminating the black money menace limited to only those states and only those times, when there are no assembly elections happening?
c) Also, does this mean that tax officials are supposed to turn a blind eye to the past shenanigans of people who should have paid tax, and haven’t, because the prime minister has made an assurance during the course of an election speech?
I have always maintained in my writing that prime minister Modi and the BJP aren’t serious about eliminating the menace of black money. And this is one of the things they like to talk about to build a narrative around the point of the government being serious about eliminating corruption and black money. The voters like to hear such things and the politicians are giving it to them.
Let me explain this point in a little more detail. You and I have been getting emails and smses almost every day asking us to link our Aadhar card to our bank accounts. We have also been getting smses asking us to link our Aadhar card to our mobile numbers. It is almost impossible to carry out any transaction with the government without an Aadhar card.
At the same time, no identification is needed to donate money to a political party. Why is that the case? Why can’t the Aadhar card be linked to every donation made to a political party as well. What is stopping the government from doing that? Almost everyone has an Aadhar card now.
If the idea is to eliminate black money, why aren’t donations to political parties linked to Aadhar. In fact, to take this argument even further, why are political parties allowed to collect donations in cash, in this day and age. If the idea is to encourage digital transactions, why can’t PM Modi and the BJP, set an example on this front and ensure that the BJP takes only digital donations.
A lot of the donation to the political parties at the state level comes from the builders and the real estate companies. Because these donations are made in cash, builders need to carry out a part of their real estate transactions in cash as well. (This is not to say that all the cash that they collect is handed over to politicians unless of course the builder is a politician himself).
To conclude, there is enough evidence to suggest that PM Modi and the BJP are not serious about tackling the black money menace. If they were they would first start with genuinely reforming political donations. And this leads me to believe that tackling the black money menace, like many other things, is just another talking point for PM Modi and the BJP.
(This was just a glimpse. If you want to know how big the black money problem is in India and how we can tackle it, there is a long chapter in my book India’s Big Government. The good news is that the book is available at a huge discount on Amazon till Friday, 27th October. The Kindle version is going at Rs 199, against a maximum retail price of Rs 749, and the paperback is going at Rs 499, against a maximum retail price of Rs 999).
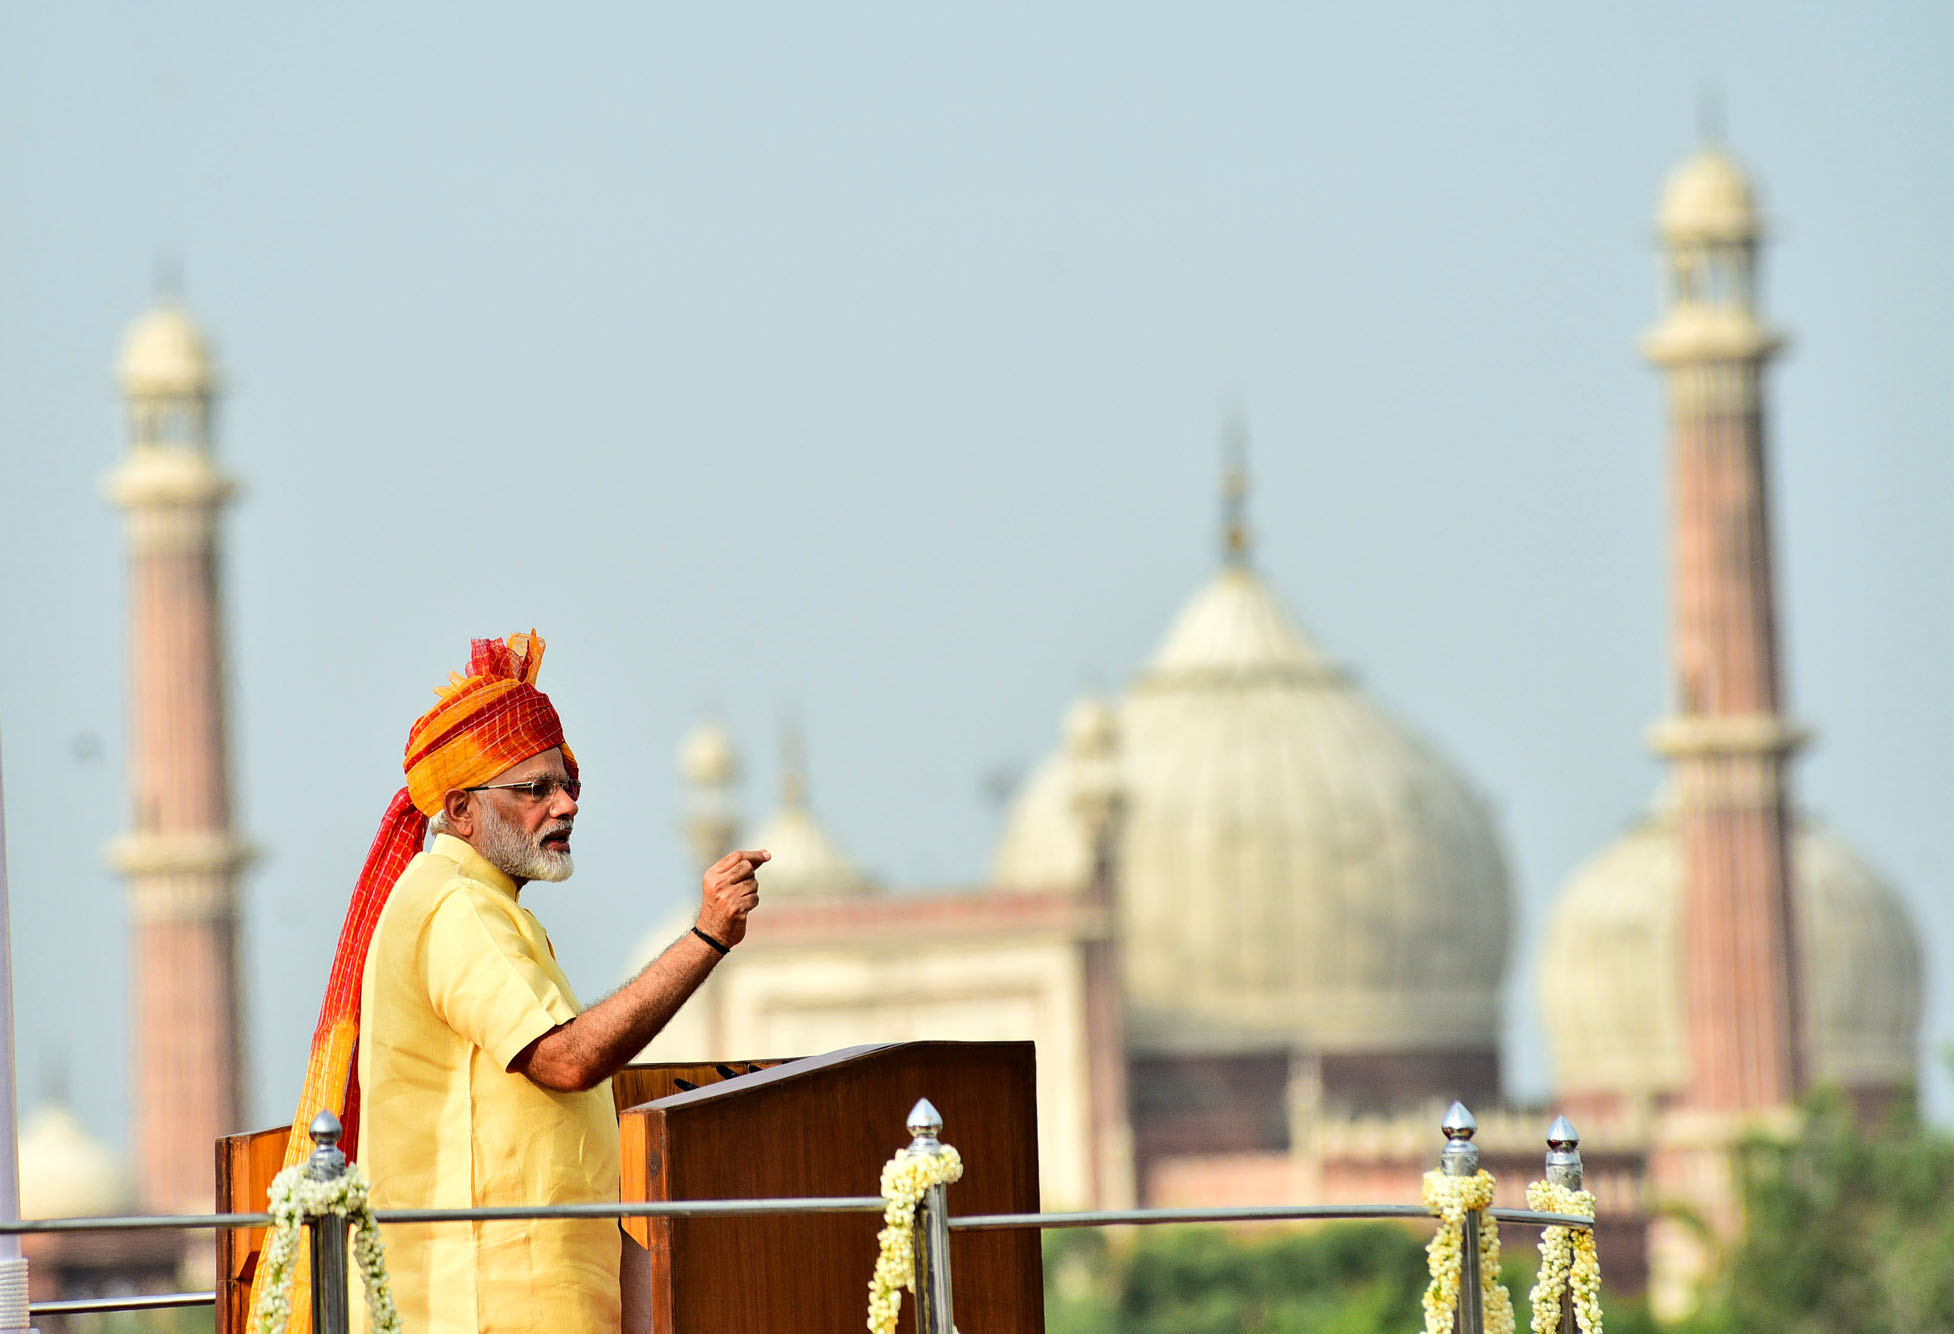
The Prime Minister, Shri Narendra Modi addressing the Nation on the occasion of 71st Independence Day from the ramparts of Red Fort, in Delhi on August 15, 2017.
In a speech last week, Prime Minister Narendra Modi, offered several data points to tell his fellow countrymen, that all is well with the Indian economy. And those who didn’t think so were essentially being needlessly pessimistic, he suggested.
Now only if he had bothered to look at data points beyond those he chose to offer, a totally different situation would have emerged. In this piece, I offer many data points to show that all is not well with the Indian economy.
1) Let’s start with the loans disbursed by banks during the course of this year. Let’s look at non-food credit to start with. These are the loans given out by banks after we have adjusted for food credit or loans given to the Food Corporation of India and other state procurement agencies, for buying rice and wheat directly from farmers at the minimum support price (MSP) for the public distribution system. Take a look at Figure 1.
Figure 1:
The Figure 1 clearly shows that the total amount of non-food credit given by banks during the course of this year has been in negative territory. This basically means that on the whole banks haven’t given a single rupee of a loan. The situation is the worse it has been in five years. Non-food credit consists of loans given to agriculture, industry, services and retail sectors, respectively.
Let’s take a look at each of these sectors.
2) Let’s take a look at Figure 2, which plots the loans given by banks to agriculture and allied activities.
Figure 2:
Loans given to agriculture and allied activities are in negative territory during the course of this year. Again, this basically means that on the whole banks haven’t given a single rupee of a loan to agriculture. In technical terms, their loan book to agriculture has shrunk. Is this possibly because of farm loans being waived off by state governments, that only time will tell.
3) Let’s take a look at Figure 3, which plots the loans given banks to industry.
Figure 3:
Figure 3 makes it clear that loans given to industry by banks continue to shrink. This isn’t surprising given the huge amount of bad loans accumulated by banks on lending to industry. Banks still don’t trust the industry.
4) Let’s take a look at Figure 4, which plots the loans given by banks to the services sector.
Figure 4:
This comes in as a major surprise, loans given to services have shrunk majorly during this financial year. Services constitute half of the Indian economy. If the firms operating in this sector are not interested in borrowing, then how can the Indian economy possibly be doing well?
5) Let’s take a look at Figure 5, which plots the retail loans given by banks during this financial year.
Figure 5:
Retail loans are the only loans which have been in positive territory during the course of this year. Nevertheless, they have been more or less at the same level over the last few years.
This, despite the fact that interest rates have come down dramatically. If people are not willing to borrow more even at lower interest rates, how can things be alright with the Indian economy, is a question well worth asking.
Sadly, Prime Minister Modi, did not include any of these data points in his speech and presentation.
6) The latest Consumer Confidence Survey of the Reserve Bank of India (RBI) for September 2017, states: “Households’ current perceptions on the general economic situation remained in the pessimistic zone for four successive quarters, with the outlook worsening… The employment situation has been the biggest cause of worry for respondents, with sentiment plunging further into the pessimistic zone; the outlook on employment has also weakened.”
7) Take a look at Figure 6, which plots the cement production over the years.
Figure 6:
Cement production is down this year, in comparison to the previous year. This tells us clearly that the construction and the real estate industry continue to be in trouble. These industries are huge employers of people, especially those who have low-skills.
8) The commissioning of new projects has slowed down. As Centre for Monitoring Indian Economy, which tracks this data, points out: “Projects worth Rs 512 billion were commissioned during the quarter ended September 2017. In the coming weeks this estimate is expected to rise. It could reach about Rs 700 billion. Even if this happens, this would be the lowest commissioning of projects during the Modi government’s tenure so far.”
9) There has been a fall in new investment proposals. As Centre for Monitoring Indian Economy, which tracks this data, points out: “Projects worth Rs.845 billion were proposed during the quarter ended September 2017. This is the lowest level of intentions to invest seen in a quarter during the tenure of the Modi government.”
10) There has been a huge fall in the profit of companies. As Centre for Monitoring Indian Economy points out: “We infer this and other related nuggets of information from the financial statements of 1,127 listed companies… Profit before taxes of these companies fell by 27.9 per cent over their level a year ago.”
11) Take a look at Figure 7, which plots the trade deficit or the difference between exports and imports.
Figure 7:
The trade deficit has jumped up majorly during the course of this financial year. This as I have explained beforehas primarily been on account of a jump in non-oil non gold non silver imports, in the aftermath of demonetisation. The unseen negative effects of demonetisation continue to impact the economy.
12) The growth in private consumption expenditure is at a six-quarter low. As the RBI Monetary Policy Statement pointed out: “Of the constituents of aggregate demand, growth in private consumption expenditure was at a six-quarter low in Q1 of 2017-18 [April to June 2017].”
13) As the RBI Monetary Policy Statement further pointed out: “India’s export growth continued to be lower than that of other emerging economies such as Brazil, Indonesia, South Korea, Turkey and Vietnam, some of which have benefited from the global commodity price rebound.”
14) Take a look at Figure 8 which plots the investment to GDP ratio.
Figure 8:
The investment to GDP ratio has improved a little in the period of three months ending June 2017, but it continues to remain very low. As the RBI Monetary Policy Statement pointed out: “The implementation of the GST so far also appears to have had an adverse impact, rendering prospects for the manufacturing sector uncertain in the short term. This may further delay the revival of investment activity, which is already hampered by stressed balance sheets of banks and corporates.”
15) Now let’s take a look at Figure 9, which plots the growth of the non-government part of the GDP.
Figure 9:
Figure 9 basically plots the growth of the non-government part of the economy, which typically constitutes 87 to 92 per cent of the economy. The growth of the non-government part of the economy has fallen to around a little over 4 per cent. This extremely important detail did not find a place anywhere in Prime Minister Modi’s speech.
16) The situation becomes even more worrisome if we look at Figure 10.
Figure 10:
As is clear from Figure 10, the growth rate of industry in general and manufacturing and construction in particular is at a five-year low. The manufacturing part of industry grew at 1.17 per cent during April to June 2017, whereas construction grew by 2 per cent during the same period.
This is a big reason to worry simply because manufacturing and construction have the potential to create new jobs. An estimate made by Crisil Research suggests that in construction 12 workers are typically required to create Rs 10 lakh worth of output. In case of manufacturing it is seven workers.
17) Take a look at Figure 11, which basically shows that labour intensive sectors have slowed down between January to June 2017.
Figure 11:
As Crisil Research points out in a recent research note: “In the past two quarters, three sectors have grown much faster than GDP: 1) Trade, hotels, transport, communication and services related to broadcasting; 2) Electricity, gas, water supply and other utilities, and 3) Public administration, defence and other services. Of these, only the trade, hotels and restaurants sub-sector is labour intensive, requiring about 6 workers to produce Rs 10 lakh worth of output. But the share of this sub-sector in total output is low at ~12%. In contrast, a fast growing sector like public administration, defence and other personal services, despite having a larger share in output, has low labour intensity of only 3. And sectors with higher labour intensity – such as construction (12) and manufacturing (7) – have been undershooting overall GDP growth.”
It needs to be said here that public administration, defence and other personal services sector is basically a proxy for the government. And the government has stopped creating jobs.
18) Take a look at Figure 12.
Figure 12:
Figure 12 plots the index of industrial production (IIP), a measure of the industrial activity in the country. It also plots manufacturing, which forms more than three-fourths of IIP. The growth of both these measures has been in low single digits for a while now and is clearly a reason to worry.
19) Take a look at Figure 13, which basically plots the consumption of petroleum products, over the years.
Figure 13:
The consumption of petroleum products has more or less been flat in comparison to the last financial year. This is another good indicator of slowing economic growth.
20) Take a look at Figure 14, which plots the sale of commercial vehicles during the course of this financial year.
Figure 14:
Commercial vehicle sales, which are a very good indicator of a pick-up in the industrial part of the economy. Commercial vehicle sales this year were lower than they were last year.
21) Take a look at Figure 15. It plots the fiscal deficit ratio of the government over the years.
Figure 15:
As can be seen from Figure 15, in the first five months of the current financial year, 96 per cent of the annual fiscal deficit has already been crossed. Fiscal deficit is the difference between what a government earns and what it spends. Why is the fiscal deficit during the first five months of the year at such a high level? The answer lies in the fact that the economic growth is slowing down and the government is trying to drive up growth, by spending more.
22) Take a look at Figure 16.
Figure 16:
It tells us that the increase in government expenditure has been a greater part of the increase in GDP over the last two years. For the period April to June 2015, the increase in government expenditure made up for around 1.3 per cent of the increase in GDP during that period. Since then it has jumped to 39.2 per cent between January to March 2017 and 34.1 per cent between April to June 2017.
So, the government is spending more and more in order to drive economic growth. This again shows that the government in its actions does believe that the economic growth is slowing down, but PM Modi won’t say so in his public posturing.
23) Take a look at Figure 17, it plots the bad loans ratio of public sector banks.
Figure 17:
Figure 17, basically plots the gross non-performing advances ratio or simply put. the bad loans ratio of public sector banks, over the years. Bad loans are essentially loans in which the repayment from a borrower has been due for 90 days or more. There has been a huge jump in bad loans of public sector banks over the last two years.
On October 7, the Reserve Bank of India imposed restrictions on the banking activities of Oriental Bank of Commerce (OBC). OBC was the seventh public sector bank on which restrictions have been placed. Now, one-third of public sector banks have restrictions in place. And all is well with the Indian economy?
24) Take a look at Table 1.
Table 1:
Gross NPAs (in Rs Crore)
Gross Advances
Gross non-performing advances ratio
Indian Overseas Bank
35,098
1,40,459
24.99%
IDBI Ltd.
44,753
1,90,826
23.45%
Central Bank of India
27,251
1,39,399
19.55%
UCO Bank
22,541
1,19,724
18.83%
Bank of Maharashtra
17,189
95,515
18.00%
Dena Bank
12,619
72,575
17.39%
United Bank of India
10,952
66,139
16.56%
Oriental Bank of Commerce
22,859
1,57,706
14.49%
Bank of India
52,045
3,66,482
14.20%
Allahabad Bank
20,688
1,50,753
13.72%
Punjab National Bank
55,370
4,19,493
13.20%
Andhra Bank
17,670
1,36,846
12.91%
Corporation Bank
17,045
1,40,357
12.14%
Union Bank of India
33,712
2,86,467
11.77%
Bank of Baroda
42,719
3,83,259
11.15%
Punjab & Sind Bank
6,298
58335
10.80%
Canara Bank
34,202
3,42,009
10.00%
Source: Author calculations on Indian Banks’ Association data.(The table does not include the associate banks of the State Bank of India which were merged into it).
What does Table 1 tell us? It tells us that many public sector banks are in a big mess on the bad loans front. Banks like Indian Overseas Bank and IDBI with bad loans ratio of 24.99 per cent and 23.45 per cent, will pull down the performance of any big bank they are merged with.
Even the big banks like Union Bank of India, Bank of Baroda, Punjab National Bank and Canara Bank, have a bad loans ratio of 10 per cent or more. If and when weaker banks are merged with these banks, their performance will only deteriorate. The question to ask is, why are many of these banks still being allowed to operate?
25) The capacity utilisation of 805 manufacturing companies tracked by the RBI OBICUS survey fell to 71.2 per cent during the period April to June 2017. This is the lowest in seven quarters.
I guess I will stop at this. There are many other economic indicators which can be used to point out that all is not well with the Indian economy. (For more details on how PM Modi cherry picked data to build a positive economic narrative, you can click here and here). Of course, this is not to say that there are no positive economic indicators right now. But the negative indicators far outnumber the positive ones.
As I keep saying, the first step towards solving a problem is recognising that it exists. But that doesn’t seem to be the case with PM Modi. In his world, all is well.
A blueprint on economic revival is to be submitted to the Indian prime minister Narendra Modi, or so reports the Business Standard newspaper. This comes on the back of the slowest economic growth since Modi took over as the prime minister in May 2014.
For the period between April and June 2017, the Indian gross domestic product (GDP, a reflection of the size of the economy) grew by just 5.7 per cent. Between January and March 2016, the GDP had grown by 9.1 per cent. The last time the economy grew by less than 6 per cent (at 5.3 per cent) was between January and March 2014, when Manmohan Singh was the prime minister.
Also, the GDP growth of 5.7 per cent was achieved with the government spending more than what it usually does. The non-government part of the GDP, which forms roughly around 90 per cent of the economy, grew by a meagre 4.3 per cent.
The industry as a whole grew by 1.6 per cent, with manufacturing and construction growing by 1.2 per cent and 2 per cent, respectively.
We live in a world where any rate of economic growth greater than 2 per cent is considered to be good. But what is true for the West, isn’t really necessarily true for India. India needs to be growing rates of GDP growth faster than 7 per cent, if it has to continue to pull its millions out of poverty.
As Vijay Joshi, an economist at the University of Oxford, writes in India’s Long Road—The Search for Prosperity: “The ‘power of compound interest’ over long periods is such that even a small change in the growth rate of per capita income makes a big difference to eventual income per head.”
And how do things look for India? Where would it end by 2040 at different rates of economic growth? As Joshi writes: “At a growth rate of 3 per cent a year, income per head would double, and reach about the same level as China’s per capita income today. At a growth rate of 6 per cent a year, income per head would quadruple to a level around that enjoyed by Chile, Malaysia and Poland today. If income per head grew at 9 per cent a year, it would increase nearly eight-fold, and India would have a per capita income comparable to an average high-income country of today.”
This explains why high economic growth is so important for India. Another factor that needs to be kept in mind is that 12 million Indian youth are entering the workforce every year. This is India’s so called demographic dividend. But with construction and manufacturing growing at the rates they are, where will the jobs for the demographic dividend come from? The services sector growth continues to remain robust, but the support from industry is necessary, especially construction, given that most of these youth are low on jobs skills.
A major reason for the same comes from the lack of a good basic education. As per the Annual Status of Education Report 2016: “The proportion of children in Std III who are able to read at least Std I level text has gone up slightly, from 40.2% in 2014 to 42.5% in 2016.” Further, “in 2014, for the country 25.4% of Std III children could do a 2-digit subtraction. This number has risen slightly to 27.7% in 2016.” This has how the situation has been since 2010, after the introduction of the Right to Education.
Given this, a large portion of the youth entering the workforce are low on skills. Hence, they need low-skilled jobs which the construction and the real estate industry can provide. Both these sectors are going through a tough phase.
What hasn’t helped are India’s convoluted labour laws and the lack of ease of doing business. This has ensured that even industries like apparel manufacturing, which have the potential to create many jobs, continue to operate on a small scale. A recent report titled Ease of Doing Business—An Enterprise Survey of Indian States, published by the Niti Aayog, a government body, found that 85 per cent of the firms operating in the apparel sector employed less than eight workers. At a broader level, 85 per cent of Indian manufacturing firms are small and employ less than 50 employees.
The government feels that it has done enough to reform the labour laws, and it is the industry’s responsibility now to respond and set up labour-intensive enterprises. But that as the data suggests isn’t really happening.
Over and above this, agriculture which contributes around 15 per cent of the GDP, continues to employ half of the workforce. Exports during the first five months of this financial year (April to August 2017) are lower than where they were in 2013 and 2014. All these factors have ensured that India has huge underemployment. Numbers from 2015-2016, suggest that only three out of five individuals who are looking for a job all through the year, are able to find one. The situation is worse in rural India, where only one in two individuals looking for a job all through the year are able to find one.
The negative effects of demonetisation have made things worse on the jobs front with many firms operating in the informal sector, which were the real job creators, having to shutdown. The botched-up launch of the Goods and Services Tax (GST), which was supposed to be a good and simple tax and it isn’t, hasn’t helped things either.
The other big worry for India is the mess its largely government owned public sector banks continue to operate in. 17 out of the 21 public sector banks have a bad loans rate of 10 per cent or more ( as of March 31, 2017). This basically means that out of every Rs 100 of loans given by these banks, loans of Rs 10 or more have already been defaulted on. Bad loans are essentially loans in which the repayment from a borrower has been due for 90 days or more. One bank (the Indian Overseas Bank) has a bad loans rate of 25 per cent.
These bad loans have primarily accumulated on lending to industry (read crony capitalists) where the overall bad loans rate, stands at 22.3 per cent.
The government has pumped in close to Rs 1500 billion as capital since 2009 to keep these banks going. With the banks continuing to accumulate bad loans and the Basel III norms coming into force from 2019 onward, these banks are going to need billions of rupees as capital in the years to come, to continue to be in operation.
The government clearly does not have this money and they remain reluctant to privatise or even shutdown some of these banks. Also, a major impact of the bad loans has been that the public sector banks are now reluctant to lend to industry.
To conclude, there are way too many structural issues with the Indian economy as of now. If a long-term growth rate of 7-8 per cent per year has to be sustained, these issues need to be tackled on a war footing.
In his fourth Independence Day speech on August 15, 2017 as Prime Minister, Narendra Modi said: “Over the past three years, Pradhan Mantri Mudra Yojana has led to millions and millions of youth becoming self-dependent. It’s not just that, one youth is providing employment to one, two or three more people.”
Similar views were expressed by Amit Shah, the president of the Bharatiya Janata Party in May 2017, when he said: “We have tried to give new perspective to employment as it is not possible to provide employment to everyone in a country of 125 crore people. We are promoting self-employment and the government has made eight crore people self-employed.”
These remarks emerge out of the assumption that each loan given under the Pradhan Mantri Mudra Yojana(PMMY, and more popularly referred to as a Mudra Loan), leads to the creation of at least one self-employment opportunity. Is that correct? Let’s take a look at Table 1.
Table 1, tells us that up until early September 2017, close to 9 crore loans have been disbursed under the PMMY. When Shah had made the statement in late May, he had perhaps claimed on the basis of this data that the government had made 8 crore people self-employed.
The assumption was that one Mudra loan makes one individual self-employed. PM Modi in his speech essentially seemed to have assumed one Mudra loan leads to one individual becoming self-employed and he, in turn, employs more people. Take a look at Table 2.
What does Table 2 tell us? It tells us that the average loan being given under the PMMY has jumped from Rs 39,405 in 2015-2016 to around Rs 46,528 in the current financial year. Now let’s take a look at the data at a more granular level in Table 3, focusing on two previous financial years.
As can be seen from Table 3, in the previous two financial years, the total number of loans given to new entrepreneurs stood at 2.25 crore. This amounts to a little over 30 per cent of the total loans. Hence, the claim that 8 crore self-employment opportunities have been created because of PMMY loans doesn’t really add up. A bulk of the loans has been given to people who are already self-employed.
The PMMY loans are categorised into three types. These are Shishu (upto Rs 50,000), Kishore (from Rs 50,000 to 5,00,000) and Tarun (from Rs 5,00,000 to 10,00,000). Let’s look at Table 4, which goes into some detail of these different kinds of PMMY loans.
We can see from Table 4 that the most basic Shishu loans over the last two financial years formed around 92-93 per cent of the total loans. Now look at Table 5, which basically tells us the average amount of loan taken under each of the different kind of loans.
The Shishu loans on an average amounted to Rs 19,400 in 2015-2016 and Rs 23,300 in 2016-2017. This basically means that the average loan given under PMMY is very small. It is highly unlikely that such a small amount of capital can create any employment. Hence, it might act more as an overdraft facility for the self-employed (such as Kisan Credit Cards for farmers) than be able to create employment. Also, whether the new entrepreneurs who have taken PMMY loans continue to survive as entrepreneurs, is an interesting question which researchers need to explore.
It is worth pointing out that many self-employed people in India are not self-employed by choice. Economists Abhijit Banerjee and Esther Duflo call them ‘reluctant entrepreneurs’. They do not have a choice. This can be understood from the fact around 46-47 per cent of the Indian workforce is self-employed. Take a look at Table 6.
The above table clearly indicates that the salaried labour force is way better off than the self-employed. Nearly two-thirds of the self-employed earn up to Rs 7,500 per month. For the salaried, this is at a little over 38 per cent.
To conclude, the CEO of Mudra (Micro Units Development & Refinance Agency Ltd.) in an interview to a private media house, when asked the question on the number of jobs created by the Mudra loans, had said: “We are yet to make an assessment on that… We don’t have a number right now, but I understand that NITI Aayog is making an effort to do that.”
In such a situation, the hypothesis of the government that Mudra loans are making crores of youth self-dependent seems to be flawed. It seems more of a political gimmick, because remaining in power is more important than working to allay the distresses of those who are still seeking employment.
 Time flies.


 As can be seen from Table 3, in the previous two financial years, the total number of loans given to new entrepreneurs stood at 2.25 crore. This amounts to a little over 30 per cent of the total loans. Hence, the claim that 8 crore self-employment opportunities have been created because of PMMY loans doesn’t really add up. A bulk of the loans has been given to people who are already self-employed.

