Here’s More Data to Show How Over-Priced Indian Real Estate Is

India-Real-Estate-Market

I know I am kind of going overboard with the analysis of the data released by the Income Tax department last week, but believe me it is necessary, to show how loaded things are against people who actually pay income tax.

Last week, the Income Tax department released some very interesting data-the kind of stuff that it had not released for a while.

It released detailed numbers for income tax returns filed in assessment year 2012-2013. In the assessment year 2012-2013, the income tax returns for the income earned in 2011-2012 was filed.

Let’s look at the income tax returns of individuals in detail. The Income Tax department has provided data for income for individuals under the head-salary, business income, other income, short-term capital gains, long-term capital gains and interest income.

Take a look at the following table:

This table tells us that the average income of individuals filing an income tax return is around Rs 4.40 lakh.

Table 1: Income under the head (in Rs crore)

Salary6,27,200
House property income29,927
Business income4,03,251
long term capital gain30,479
short term capital gains3290
Other sources income1,28,020
Interest income44,918
Total (in Rs crore)12,67,085
Total number of returns287,66,266
Average incomeRs 4,40,476

How do things look if we look at just the salaried class?

Table 2

Salary (in Rs crore)6,27,200
Number of returns filed116,76,493
Average incomeRs 5,37,148

As can be seen from the above table the average income of the salaried class in India filing income tax returns is Rs 5.37 lakh. This is around 22% more than the average income of the individuals filing income tax return.

It is important to understand here that most individuals belonging to the salaried class would have an income lower than the average income of Rs 5.37 lakh. In order to understand this, we will have to take a look at the data in a little more detail.

Let’s divide the data in those earnings up to Rs 10 lakh and those earning more than Rs 10 lakh. Let’s consider those earning up to Rs 10 lakh first (See Table 3). As can be seen from Table 2, the total number of returns filed by the salaried class comes to around 1.17 crore.

Of this close to 1.06 crore have salaried incomes of up to Rs 10 lakh. This means around 91% of the salaried class filing income tax returns have an income of up to Rs 10 lakh. Take a look at the following table (Table 3).

Table 3

Salary rangeNumber of returnsSum of Salary Income (in Rs crore)
>0 and <=1,50,00016,00,16714,956
>150,000 and <= 2,00,00010,67,30018,853
>2,00,000 and <=2,50,00010,24,31523,120
>2,50,000 and <= 3,50,00019,18,71457,075
>3,50,000 and <= 4,00,0008,06,68530,215
>4,00,000 and <= 4,50,0007,54,20232048
>4,50,000 and <= 5,00,0006,96,21033032
>5,00,000 and <= 5,50,0005,95,29831190
>5,50,000 and <= 9,50,00020,23,583140464
>9,50,000 and <= 10,00,0001,00,1559760
Total105,86,6293,90,713
Average IncomeRs 3,69,063

The average income of those earning up to Rs 10 lakh is Rs 3.69 lakh. This is significantly lower than the overall average income of Rs 5.37 lakh of the salaried class filing income tax returns. How do things look for those earning an income of up to Rs 5 lakh?

Table 4

Salary rangeNumber of returnsSum of Salary Income (in Rs crore)
>0 and <=1,50,00016,00,16714,956
>150,000 and <= 2,00,00010,67,30018,853
>2,00,000 and <=2,50,00010,24,31523,120
>2,50,000 and <= 3,50,00019,18,71457,075
>3,50,000 and <= 4,00,0008,06,68530,215
>4,00,000 and <= 4,50,0007,54,20232048
>4,50,000 and <= 5,00,0006,96,21033032
Total78,67,5932,09,299
Average incomeRs 2,66,027

The average income of those earning less than Rs 5 lakh is around Rs 2.66 lakh. These individuals form around two-thirds of the overall salaried class filing income tax returns.

How do things look for those earning more than Rs 10 lakh per year?

Table 5

Salary rangeNumber of returnsSum of Salary Income (in Rs crore)
>10,00,000 and <=15,00,0005,92,41871,464
>15,00,000 and <= 20,00,0002,07,14135,566
>20,00,000 and <= 25,00,0001,10,70024,708
>25,00,000 and <= 50,00,0001,24,47241,302
>50,00,000 and <= 1,00,00,00036,77525,032
>1,00,00,000 and <=5,00,00,00017,51530,661
>5,00,00,000 and <=10,00,00,0006554,375
>10,00,00,000 and <=25,00,00,0001562,158
>25,00,00,000 and <=50,00,00,00026809
>50,00,00,000 and <=100,00,00,0006412
Total10,89,8642,36,487
Average income21,69,876

The average income of those earning more than Rs 10 lakh per year comes to around Rs 21.7 lakh more and is significantly more than the overall average of Rs 5.37 lakh for the salaried class.

What do these tables tell us? That the average salaried Indian who files income tax returns doesn’t earn much. As mentioned earlier, around 91% of the salaried class has an average income of Rs 3.69 lakh. Close to two-thirds have an average income of Rs 2.66 lakh.

This basically means that the income of the average salaried Indian filing an income tax return is significantly lower than the overall average salaried income as well as overall average income. At least that is how things were for the assessment year 2012-2013.

A question worth asking here is what sort of a home can individual earning a salary of Rs 3.69 lakh per year, actually afford. An annual income of Rs 3.69 lakh translates into a monthly income of around Rs 30,755.

What sort of a home loan would a bank give against this amount? Typically, a bank works with the assumption that 40% of the monthly income can go towards servicing an EMI and accordingly gives a loan.

In this case that amounts to around Rs 12,300. An EMI of Rs 12,300 at an interest rate of 10% and a tenure of 20 years, would service a home loan of Rs 12.75 lakh. Banks typically lend up to 80% of the official value of the property. This means an official value of property of around Rs 16 lakh (Rs 12.75 lakh divided by 80%). Please take into account the fact that I have used the word official because there is bound to be a black component as well.

What this number tells us is that most salaried class in 2011-2012, were not in a position to buy a home to live in, across large parts of the country. There is no reason to believe that things would have changed since then.

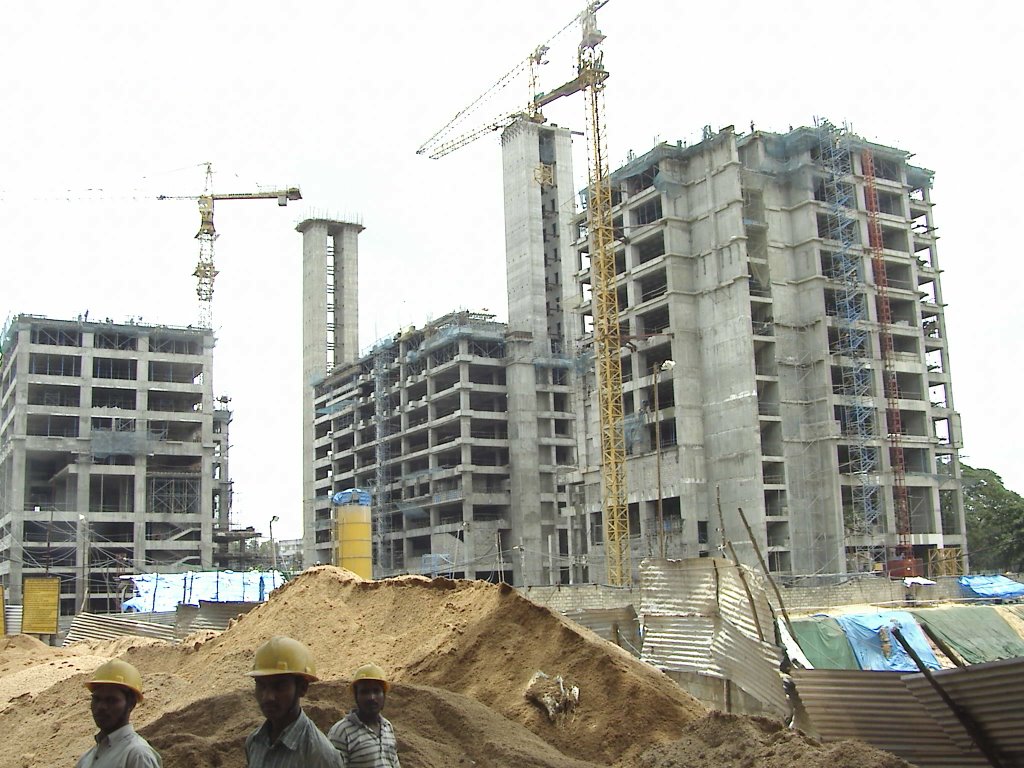
The point is that the demand for real estate is in the below Rs 20 lakh market price segment. But what is being built across large parts of the country is clearly above that price. As RBI governor Raghuram Rajan said in a recent speech: “I am also hopeful that prices adjust in a way that encourage people to buy.”

Let’s wait and see if Dr Rajan’s hope becomes a reality, any time soon.

The column was originally published in the Vivek Kaul’s Diary on May 6, 2016
Here is Another Good Joke: New IT Data Shows Only 6 lakh Indians Are Repaying Home Loans

rupee

In yesterday’s column I explained that if official data is to be believed India has only 20 lakh individuals who earn an income out of house property.

To put it simply, as per official data, India has only 20 lakh landlords or 19.95 lakh to be very precise. This number can be inferred from the data for the assessment year 2012-2013 shared by the income tax department last week. Income tax returns for the income earned during 2011-2012 would have to be filed during assessment year 2012-2013.

In fact, there was another interesting data point, in the column. This means some amount of repetition from yesterday’s column, but kindly bear with me. I am repeating this point because of two reasons—a) I thought, it sort of got lost in yesterday’s column. b) I think it is an equally important point which people need to know about.

As per the data for the assessment year 2012-2013, there were only around 26.01 lakh individual assesses who had shown some income from house property. Of this, around 6.06 lakh (or 6,06,046 to be very precise) had shown a negative income.

This negative income amounted to around Rs 3,298 crore in total. This works out to an average negative income of Rs 54,418 per individual. The term negative income is actually an oxymoron. But what it essentially means is that instead of earning any money from a house, the owner is actually spending money on it.

This happens when someone has taken a home loan to buy a home and is paying an interest on it. The Income Tax Act allows the interest paid on borrowed capital (i.e. a home loan) to be deducted while calculating taxable income.

For 2011-2012, in case of a self-occupied home, a maximum amount of Rs 1.5 lakh could be taken as a deduction for the interest paid on a home loan. Individuals in such situation would end up having a negative income from house property.

For a non-self-occupied home, there was no upper limit to the amount of interest that could be taken as a deduction, though a notional rent would also have to be taken into account, if the house hadn’t been put out on rent.

If the interest to be paid on the home loan was greater than the rent earned or the notional rent, then the income from house property would turn out to be negative. Such individuals would also end up having a negative income from house property.

The surprising thing is that the number of such individuals in total is only a little over six lakh. Does this mean that India has only six lakh people who have taken on a home loan to buy a home? The official data seems to suggest that.

But this is simply bizarre. Some simple mathematics clearly shows us that. The Reserve Bank of India (RBI) puts out sectoral deployment of credit data. During 2011-2012, scheduled commercial banks gave out home loans worth Rs 41,907 crore.

Multiple newsreports point out that in 2012-2013, the average home loan financed by banks was Rs 10 lakh. I couldn’t find an average home loan number for 2011-2012, and hence will have to work with this.

Let’s assume that in 2011-2012, the average home loan financed was 10% lower at Rs 9 lakh than in comparison to 2012-2013. This essentially means that just in 2011-2012, around 4.66 lakh homes (Rs 41,907 crore divided by Rs 9 lakh) were financed by scheduled commercial banks.

Over and above banks, housing finance companies also give out home loans. Hence, it is safe to say that just in 2011-2012, more than six lakh home loans would have been given out.

Further, home loans would have also been given out even in years before 2011-2012. Hence, how is it possible that only around six lakh individuals have a negative income from their homes, as data from the income tax department suggests?

Something doesn’t really add up here. In fact, as I had pointed out in yesterday’s column, the number of home loan accounts with scheduled commercial banks in 2011 had stood at 47.32 lakhs.

Hence, the data from the Reserve Bank of India is completely at odds with the data from the Income Tax department.

Typically, when people do not declare details to the Income Tax department the idea is to hide income and save on tax. But in this case nothing of that sort is happening. If an individual does not declare in his income tax return that he is repaying a home loan, then he does not get the interest paid on the home loan as a deduction.

One explanation for this might be that many salaried individuals are declaring their home loan details to their employers, getting a deduction, and then not filing their income tax returns.

But that can at best be a very small explanation because the difference between six lakh people declaring a negative income from their house and 47.32 lakh home loan accounts with banks, is huge. And if we consider home loan accounts with housing finance companies, the number is even bigger. Also, the same logic will not work for the self-employed individuals.

So what is a possible explanation for this? One explanation that I can possibly think of is that the home loan has been taken on only as a bridge loan. This essentially means that people have used black money to pay a substantial part of the price of the home and have financed the remaining through taking on a home loan. This logic applies more to the self-employed individuals rather than the salaried class.

By not declaring the fact that they are paying an interest on their home loan, the hope is not to attract attention on their rather expensive home in comparison to the home loan amount that has been borrowed. But then in this day and age of big data, it shouldn’t be so difficult for the Income Tax department to figure out, who has taken a home loan and is not declaring it.

I don’t know if this explanation is correct, but this is something I can think of at this point of time.

To conclude, the Income Tax department needs to look at this anomaly in greater detail. The answers will be very interesting.

The column originally appeared in the Vivek Kaul Diary on May 5, 2016

Why we believe in godmen

make in india

If you need to figure out how awful TV can get, you need to watch it post-midnight, when all the sponsored content is on play.

On some channels, there are beautiful women trying to tell you how to lose weight through sweating. On some other channels there are well-built men trying to tell you how to easily clean your car by buying a particular product.

If you keep flipping channels long enough, you will definitely come across some godmen addressing a hall full of people and trying to tell them how to go about improving their lives.

And that is where I ended sometime back at three in the morning. It was one of those nights when I just couldn’t sleep and thought that watching some mindless TV would help.

So let me describe what I saw. There was a big hall full of people. And there was a stage. On the stage a godman sat, on some sort of a throne. The people were asking questions and the godmen was answering them. Every answer was offered as a solution. It told people to do something so as to improve their current life or to ensure that a problem would go away.

So this middle-aged gentleman got up and asked the godman for his blessings. The godman then asked the gentlemen, if he had ever offered a bottle of liquor to god, using the Hindi words bhairav(a manifestation of Lord Shiva) and botal, as is tradition in parts of India.

The gentlemen said yes. Then the godman asked him, what brand had he offered? The gentleman named a particular brand. The godman then asked the businessman, what brand did he drink himself? The gentlemen said the same brand that he had offered.

The godman then told the gentlemen that he should offer a better more superior brand to god and not the same one that he drinks. And if he did so blessings would automatically come. The businessman got his answer, thanked the godman and sat down.

Honesty, I hadn’t seen something as bizarre as this, ever on TV. It led me to think that why do people believe in all kinds of godmen? What is it that godmen have that attracts people? After some thinking I have come the conclusion that godmen essentially offer simple solutions to everything. And this attracts people.

As Matt Ridley writes in The Evolution of Everything: “The literary critic George Steiner, in his book Nostalgia for the Absolute, argued that people are attracted by higher truths that simplify the world and can explain everything.”

The phrase to mark in the above paragraph is simplify the world. People want to be told that if they do this and this, their problems will go away. And this leads to godmen exploiting them. Let me give you another example here.

Sometime back, one my mother’s neighbours sort of forced her to go to a godman. The scene that my mother described to me was extremely bizarre. A disciple of the godman was sitting in front of the godman with a big jute bag open. In this jute bag people were putting in Rs 1000 notes.

There was a long line of people waiting to donate the money. Why would so many people essentially behaving like they were? Why were so many people being tricked all at the same time? The answer perhaps lies in the fact that they falsely believed that the Rs 1000 donation would make their problems go away.

As economist Robert H Frank writes in Success and Luck—Good Fortune and the Myth of Meritocracy: “Holding false beliefs makes people happier in the short run.” This false belief is something that godmen tend to exploit.

Further, as Frank puts it, what people forget is “that such beliefs may entail significant costs longer term.” But then, who is bothered about the longer term. As economist John Maynard Keynes once said, in a totally different context, “In the long run we are all dead”.

(Vive Kaul is the author of the Easy Money trilogy. He can be reached at [email protected])

The column originally appeared in the Bangalore Mirror on May 4, 2016

Here’s a Good Joke: New Income Tax Data Shows India Has Only 20 Lakh Landlords

rupee-foradian.png.scaled1000

In yesterday’s column I had mentioned that only around 26 lakh Indians (to be precise the number is 26,01,777) filed for income from house property under the individual category, for the assessment year 2012-2013.

During the assessment year 2012-2013, income tax returns for the income earned during the year 2011-2012 had to be filed. A total income of Rs 29,927 crore was declared under this category.

Of this around 6.06 lakh individuals showed an income of less than zero from house property. This would primarily include people who have taken on a home loan to buy a house and are repaying it. During the financial year 2011-2012, an interest of up to Rs 1.5 lakh, paid on a home loan, in case of a self-occupied house, could be set off while calculating taxable income.

This meant that an individual repaying a home loan on a self-occupied house, could show a negative income of up to Rs 1.5 lakh when it came to income from house property. These are the individuals showing negative income against their house property. This negative income could be set off against taxable income and the taxable income could bethus  brought down.

Further, the limit of Rs 1.5 lakh applied only to self-occupied property and not on other homes that a tax payer may choose to buy by taking on a home loan. Any amount of interest paid on such home loans can be claimed as a deduction as long as a “notional rent” is added to the income.

We all know that over the last few years the “rents” have been very low in comparison to the EMIs that need to be paid in order to repay the home loan. The rental yield (rent dividend by market value of the home) is in the region of 2-3%.

Even after deducting a notional rent, the interest component tends to be massive during the initial years. Hence, the difference between the notional rent and the interest paid is negative. This essentially means income from house property is negative. Such individuals who own more than one home financed through a home loan, also earn a negative income from their house property. This negative income helps people with two or more homes, claim huge tax deductions.

This “deduction” has been used over the years by well-paid corporate employees to bring down their taxable income. Further, individuals who use this deduction benefit on two fronts—tax deduction as well as capital appreciation.

Even if, the capital appreciation is not huge, such individuals are happy in claiming just the deduction than actually making money from an increase in price. Hence, they may not sell the flat, even in a scenario where prices may be falling and thus prevent a faster fall in home prices.

Getting back to the point, there were only 6.06 lakh individuals in the assessment year 2012-2013 who had an income of less than zero or a negative income from house property. As I said, these are people essentially repaying their home loans. The interest they pay on their home loans can be set off against taxable income.

It is worth asking here that does India have less than 6.06 lakh individuals living in self-occupied homes on which home loans are being repaid? Something just doesn’t add up here. Honestly, this is bizarre.

As a newsreport in The Economic Times points out:In 2011, the number of accounts was 47.32 lakh, which went up to 47.78 lakh in 2012, with the disbursed amount also increasing from Rs 2.5 lakh crore to Rs 2.6 lakh crore.

If the banks had close to 47-48 lakh home loan accounts in 2011 and 2012, why are only around 6.06 lakh showing up in the income tax data?

Also, around 19.95 lakh people declared an income from house property in assessment year 2011-2012. This is another extremely low number. What does this mean? It means that the number of individuals in India who are earning a rental income from their homes (real as well as notional) is around 20 lakh. How is that possible?  It means is that there are around 20 lakh landlords in the country, if the data from the Income Tax department is to be believed.

It is worth recounting here something that Akhilesh Tilotia writes in The Making of India based on the 2011 Census data: India’s households increased by 60 million to 247 million from 187 million between 2001-2011. Reflecting India’s higher ‘physical’ savings, the number of houses went up by 81 million to 331 million from 250 million. The urban increases is telling: 38 million new houses for 24 million new households.”

This means India had 331 million or 33.1 crore houses in 2011. Now compare this with the fact that there are around 20 lakh individuals earning a rental income from their homes. This comparison clearly tells us how low the 19.95 lakh number, really is.

There are two things that become clear here. One, is that many individuals are just buying up homes as an investment and not putting it up on rent. Anshuman Magazine, chairman and managing director of CBRE South Asia Pvt. Ltd., in a 2015 article wrote that “around 1.2 crore completed houses” are “lying vacant across urban India”.

Further, this is a clear indication of the fact that most landlords are getting their rents paid in cash and not paying any income tax on it. It also leads to the question where did these people earn the money to build these houses in the first place?

Here is another interesting data point—Of the 19.95 lakh who have some rental income, around 14.55 lakh have an average rental income of around Rs 60,000 per year or Rs 5,000 per month. This number is very low as well.

The point being a major part of the black money in India continues to be generated in the real estate sector. The general impression we have had up until now is that black money is generated when real estate is bought and sold. Nevertheless, with this new data it is very clear, that black money is generated even when real estate is rented out.

The column originally appeared on the Vivek Kaul Diary on May 4, 2016

0.11 Per Cent of India’s Population Pays 80% of Its Personal Income Tax

rupee

The Income Tax department shared some very interesting data last week. In today’s column I will look at these data points and try and make some sense of them.

a) In the assessment year 2012-2013, around 2.87 crore individuals filed income tax returns. The total income tax collected from these individuals amounted to Rs 1,14,555 crore. In assessment year 2012-2013, income tax returns for the income earned in 2011-2012 had to be paid.

The interesting thing nonetheless was that only 1.25 crore individuals paid any income tax. Data from the World Bank shows that in 2011 the population of India was 124.7 crore. This basically means that in assessment year 2012-2013 around 1% of India’s population basically paid income tax.

One explanation for this is straightforward that income from agriculture is untaxed. Close to 50% of   the country’s population still depends on agriculture for a living. Further, this also tells you that India is a poor country, where most people earn a taxable income of under Rs 2.5 lakh per year, above which one has to start paying income tax.

What this  also tells us among other things, is that a major part of the Indian economy continues to operate in the black zone. Hence, a tremendous amount of black money is generated, on which income tax does not get paid.

b) Around 3.94 lakh Indians pay a tax of greater than Rs 5 lakh. In total they paid an income tax of Rs 64,313 crore in assessment year 2012-2013, which made up for around 56% of the income tax paid by individuals.

Further, around 13.9 lakh Indians paid an income tax of greater than Rs 1.5 lakh. In total, they paid an income tax of Rs 91,110 crore. This made up for around 79.5% of the total income tax paid by individuals for the assessment year 2012-2013.

This means that around 0.11% of India’s population (13.9 lakh divided by 124.7 crore) paid around 80% of the income tax paid by individuals in the assessment year 2012-2013. This is one data point that clearly tells you how few Indians actually pay income tax.

c) Only around 26 lakh Indians filed for income from house property under the individual category. A total income of Rs 29,927 crore was declared under this category.

Of this around 6.06 lakh showed losses under income from house property. This would primarily include people who have taken on a home loan to buy a house and are repaying it. The interest paid on a home loan can be adjusted as a loss. Prima facie the number seems to be extremely low.

Further, this means that around 19.95 lakh people declared “real” income from house property. This is another extremely low number. What this means is that there are only 20 lakh landlords in the country. This is a clear indication of the fact that most landlords are getting their rents paid in cash and not paying any income tax on it. It may also be an indication of the fact that many landlords have not put up their homes on rent.

d) The data points released by the income tax department answers a major question—what is the effective rate of personal income tax in India. We all know that there are three income tax rates of 10%, 20% and 30%, with a higher rate being applied as the income goes up. Nevertheless, what portion of income is the government actually able to collect as tax, after all the deductions are applied, is an interesting question to answer.

Income under the head(in Rs crore)
Salary6,27,200
House property income29,927
Business income4,03,251
long term capital gain30,479
short term capital gains3,290
Other sources income1,28,020
Interest income44,918
Total Income12,67,085
Total tax collected1,14,555
Effective rate of income tax9.04%


Take a look at the above table. For the assessment year 2012-2013, individuals declared a total income of Rs 12,67,085 crore. On this an income tax of Rs 1,14,555 crore was collected. This means an effective rate of 9.04%. Hence, the effective rate of income tax is even lower than the lowest rate of 10%. This is clearly a reason to worry for the government.

e) While the release of detailed income tax data is a good start, much more remains to be done. First and foremost, data from more years needs to be released. This means releasing data from prior to assessment year 2012-2013. It also means releasing data from years after assessment year 2012-2013. More data would help researchers spot trends over the years.

The data released last week is now almost half a decade old. It would be great that in the time to come, the income tax department can be more prompt in releasing such data.

f) One major complain I have with the income tax department on this is that they released the data in the form of PDF files. While that is fine, data in the form of excel files should also have been released. This makes the data machine readable immediately and is of tremendous importance for researchers. Otherwise a lot of time is uselessly spent in transferring data from the PDF files to an excel file.

g) Also, it would have been great if exempt income (like dividend income from stocks, long-term capital gains on stocks etc.), would also have been declared. This would have given us some idea how much potential tax is the government losing out on.

To conclude, this is a good start. Nevertheless, more income tax data needs to be declared in the time to come.

The column originally appeared on the Vivek Kaul Diary on May 3, 2016