Indian Economic Growth Data Has Gone the Chinese Way—It’s Not Believable

narendra_modi
The Central Statistics Office (CSO) has declared the economic growth, as measured by the growth in gross domestic product (GDP), for the period October to December 2015. During the period India grew by 7.3%.

The economic growth for the period July to September 2015 has also been revised to 7.7%, against the earlier 7.4%. The economic growth for the period April to June 2015 was also revised to 7.6%, against the earlier 7%.

The CSO also said that the “growth in GDP during 2015-16 is estimated at 7.6 per cent as compared to the growth rate of 7.2 per cent in 2014-15”.

The question to ask here is that why doesn’t it feel like India is growing at greater than 7%? Before I answer this question let me reproduce a paragraph from author and economic commentator Satyajit Das’ new book The Age of Stagnation: “In a 2007 conversation disclosed by WikiLeaks, Chinese premier Li Keqiang told the US ambassador that GDP statistics were ‘for reference only’. Li preferred to focus on electricity consumption, the volume of rail cargo, and the amount of loans disbursed.”

This was promptly dubbed as the Li Keqiang index, by the China watchers.

Over the years, lot of doubts have been raised about the official Chinese economic growth data. And many analysts now like to look at high speed economic indicators to figure out the ‘actual’ state of the Chinese economy.

The Indian GDP data also seems to have reached a stage where it is ‘for reference only’. And we probably now need our own version of the Li Keqiang index, to figure out how different the actual economic growth is from the official number.

It is worth understanding here that GDP ultimately is a theoretical construct. One look at the high speed economic indicators clearly tells us that India cannot be growing at greater than 7%.

Let’s first take a look at the data points that constitute the Li Keqiang index. The electricity requirement for the period April to December 2015 has gone up by only 2.5% to 8,37,958 million Kwh, in comparison to the period between April to December 2014.

How does the earlier electricity requirement data look? The electricity requirement between April to December 2014 had gone up by 8.3% to 8,16,848 Kwh, in comparison to the period April to December 2013. What this clearly tells us is that the demand for electricity has gone up by a very low 2.6% during the course of this financial year, in comparison to 8.3% a year earlier. This is a clear indicator of lack of growth in industrial demand. As industrial demand picks up, demand for electricity also has to pick up.

And how about railway freight? Between April to December 2015, revenue earning railway freight grew by 1% to 8,16,710 thousand tonnes, in comparison to April to December 2014. Between April to December 2014, revenue earning railway freight had grown by 5% to 8,08,570 thousand tonnes, in comparison to April to December 2013.

The railways transports coal, pig iron and finished steel, iron ore, cement, petroleum etc. A slow growth in railway freight is another great indicator of lack of industrial demand.

This brings us to the third economic indicator in the Li Keqiang index, which is the amount of bank loans disbursed, an indicator of both consumer as well as industrial demand. The bank loan growth for the period December 2014 to December 2015 stood at 9.2%. Between December 2013 to December 2014 the loan growth had stood at a more or less similar 9.5%. Bank loan growth has been in single digits for quite some time now. In fact, growth in loans given to industries stood at 5.3% between December 2014 and December 2015.

And what is worrying is that bad loans of banks have jumped up. Bad loans of banks stood at 5.1% of total advances as on September 30, 2015, having jumped from 4.6% as on March 31, 2015. The stressed loans of public sector banks as on September 30, 2015, stood at 14.2% of the total loans.

Hence, for every Rs 100 of loans given by public sector banks, Rs 14.2 has either been declared to be a bad loan or has been restructured. In March 2015, the stressed assets were at 13.15%.

Estimates suggest that over the last few years nearly 40% of restructured loans have gone bad. This clearly means that banks have been using this route to kick the bad loan can down the road. It also means that many restructured loans will go bad in the time to come.

Hence, the Indian economic growth story is looking ‘really’ weak when we look at the economic indicators in the Li Keqiang index. There are other high frequency economic indicators which tell us clearly that economic growth continues to be weak.

Exports have been falling for 13 months in a row. Between April and December 2015, exports fell by 18% to $196.6 billion. Non petroleum exports between April and December 2015 were down by 9.4% to $173.3 billion. The bigger point is that is how can the economy grow at greater than 7%, when the exports have fallen by 18%? In 2011-2012, exports grew by 21% to $303.7 billion. The GDP growth for that year was 6.5%. How does one explain this dichotomy?

Between April and December 2015, two wheeler sales went up by 1.05% to 1.42 crore, in comparison to a year earlier. Two-wheeler sales are an excellent indicator of consumer demand throughout the country. And given that the growth has been just 1.05%, it is a very clear indicator of overall consumer demand remaining weak.

In fact, the rural urban disconnect is clearly visible here. Motorcycle sales are down by 2.3% to 97.61 lakhs. Scooter sales are up 11.5% to 39 lakhs. Scooters are more of an urban product than a rural one. This is a clear indicator of weak consumer economic demand in rural and semi-urban parts of the country. Tractor sales fell by 13.1% between April to December 2015 to 4.12 lakh. This is another  indicator of the bad state of rural consumer demand.

One data point which has looked robust is the new car sales data. New car sales during the period April to December 2015, grew by 7.9% to 19.22 lakhs, in comparison to a year earlier. Between April to December 2014, new car sales had grown by 3.6% to 17.82 lakhs. The pickup in new car sales is a good indicator of robust consumer demand in urban areas.

Over and above this, not surprisingly, corporate earnings continue to remain dismal. If all the data that I have pointed up until now was positive, corporate earnings would have also been good.

The larger point is that if so many high frequency economic indicators are not in a good state, how is the economy growing at greater than 7% and how is it expected to grow by 7.6% during the course of this year. What is creating economic growth?

It is worth pointing out here that sometime early last year, the CSO moved to a new method of calculating the GDP. Since then robust economic growth numbers have been coming out, though the performance of high frequency economic indicators continues to remain bad. In fact, some economists have measured the economic growth rate between April and September 2015, as per the old method, and come to the conclusion that the growth is in the range of 5-5.2%, which sounds a little more believable.

To conclude, there is no way the Indian economy can possibly be growing at greater than 7%. Honestly, Indian economic growth data now seems to have gone the Chinese way—it’s totally unbelievable. And since we like to compete with the Chinese, at least on one count we are getting closer to them.

And there is more to come on this front in the time to come.

Stay tuned!

The column was originally published on the Vivek Kaul Diary on February 9, 2016
Mr Jaitley’s Search for a One-Handed Economist

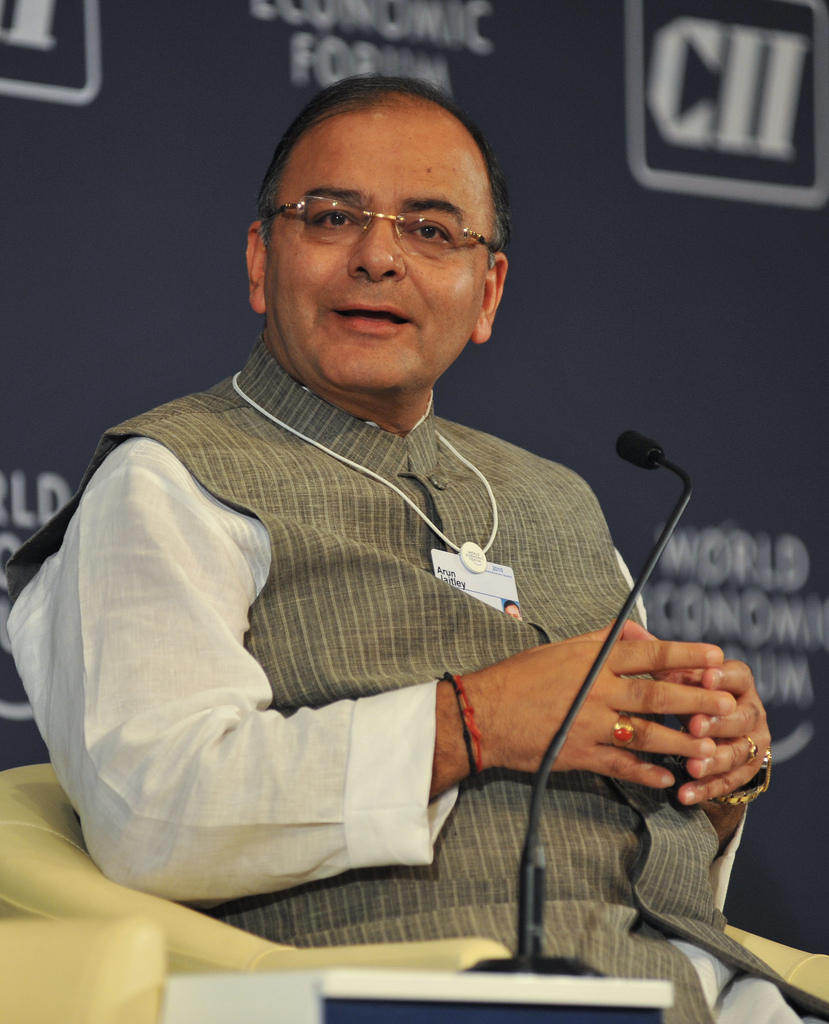
Fostering Public Leadership - World Economic Forum - India Economic Summit 2010
Give me a one-handed economist,” quipped the American president Harry Truman, many years back. “All my economists say, ‘on the one hand…on the other’.”

The finance minister Arun Jaitley is currently probably going through the one-handed economist phase as well. There has been a huge debate going on, in the media, whether the government should relax the fiscal deficit target of 3.5% of gross domestic product for the next financial year i.e. 2016-2017, when it presents its budget later this month. Fiscal deficit is the difference between what a government earns and what it spends.

Economists, as usual, are divided on it. Some like the idea of government spending more in order to revive the slow economic growth (or so they like to believe). Others have been highlighting the negative consequences of the government spending more.

This has left Jaitley, who has no background in either finance or economics, and was a part-time politician and a full-time layer, until few years back, confused. As he recently said: “I’ve been consulting all shades of opinion. This is the first time I’ve come across people holding sharply divided views. Each one has a strong argument in his favour.”

The Chief Economic Adviser to the finance ministry, Arvind Subramanian, has been in favour of the government spending more. In the Mid-Year Economic Analysis released in December 2015, Subrmanian had suggested that in a scenario of lower than expected economic growth (as measured by the real/nominal GDP growth) “if the government sticks to the path for fiscal consolidation, that would further detract from demand.” Further, “consolidation of the magnitude contemplated by the government… could weaken a softening economy”. Fiscal consolidation is essentially the reduction of fiscal deficit.

The finance minister Arun Jaitley had talked about fiscal consolidation in the two budget speeches he has made till date in July 2014 and February 2015. In the first speech he said that the government is aiming to achieve a fiscal deficit target of 3% of gross domestic product(GDP) in 2016-2017.

In the speech he made in February 2015, he postponed this target by a year and said that the government will achieve a fiscal deficit of 3.5% of GDP in 2016-17; and 3% of GDP in 2017-18.  Now there is pressure on the finance minister to abandon the fiscal deficit target of 3.5% of the GDP set for 2016-2017, from one set of economists and the industry.

The trouble is another set of economists does not agree with this. Economist Arvind Panagariya, who happens to be the vice chairman of the NITI Aayog said in January 2016: “I personally don’t think we should be tinkering with the deficit as a percentage of GDP.”
Raghuram Rajan, the governor of the Reserve Bank of India, has also been an advocate of the government sticking to a path of fiscal consolidation. He reiterated the same in a recent speech as well as the monetary policy statement released last week.

One of the interesting points that Rajan made was that India’s overall fiscal deficit position has deteriorated. As he said: “The consolidated fiscal deficit of the state and centre in India is by far the largest among countries we like to compare ourselves with; presently only Brazil, a country in difficulty, rivals us on this measure. According to IMF estimates (which is what the global investor sees), our consolidated fiscal deficit went up from 7 percent in 2014 to 7.2 percent in 2015. So we actually expanded the aggregate deficit in the last calendar year. With UDAY, the scheme to revive state power distribution companies, coming into operation in the next fiscal, it is unlikely that states will be shrinking their deficits, which puts pressure on the centre to adjust more.”

One reason why government’s numbers are different from IMF numbers is because the government of India under-declares its fiscal deficit. How does it do it? The government recognises the disinvestment of shares in public sector units as a revenue rather than as a financing item.

As economist Rajeev Malik of CLSA put it in a recent column in the Mint: “India tends to under-report its fiscal deficit because it counts divestment and other asset sales as revenue rather than a financing item, as is practised by the International Monetary Fund (IMF). Thus, the FY16 budget deficit target—adjusted for divestment—was actually 4.4% of GDP, not 3.9% as officially reported.”

Rating agencies remain strangely silent on this self-serving approach,” Malik validly points out.

What complicates the situation further is that the government follows the cash accounting system and only acknowledges expenses once payment has been made. This has led to a situation where subsidy payments to Food Corporation of India(FCI) and fertilizer companies remain unpaid. The money has been spent by FCI and the fertilizer companies but remains unpaid by the government, and hence is not acknowledged as an expenditure.

The question is where does FCI get this money from? It borrows from the financial market. Why does the market lend money to FCI? It does that because it knows that it is effectively lending money to the Indian government. Hence, this subsidy expenditure has already been incurred by the government but has not been accounted for.

As economist M Govinda Rao put it in a recent column in The Financial Express: “In fact, the cash accounting system hides the real fiscal deficit which is much higher as substantial subsidy payments to Food Corporation of India and fertiliser companies are yet to be disbursed.”

While Jaitley may keep debating whether or not to abandon the fiscal deficit target that he set previously, he needs to tell us clearly what is India’s real fiscal deficit. If that means that he doesn’t get around to meeting the target.

Getting back to Rajan, the RBI governor also raised the question, whether the extra economic growth that will come in because of the government abandoning its fiscal deficit target and spending more, be worth it.

As Rajan said: “Perhaps Brazil offers a salutary lesson. Only a few years ago, the world was applauding the country’s thriving democracy, its robust economic growth, and the enormous strides it was making in reducing inequality. It grew at 7.6 percent in 2010…Paradoxical as it may seem, Brazil tried to grow too fast. The 7.6 percent growth came on the back of substantial stimulus after the global financial crisis.”

In fact, India tried the same strategy in the aftermath of the financial crisis, with the government coming up with a substantial economic stimulus. While this lifted the economic growth for the next few years, it led to a huge increase in corporate debt and high inflation, the aftermaths of which the country is still facing.

The column originally appeared in the Vivek Kaul Diary on Equitymaster on February 8, 2016

Bill Bonner: “We Have Got a Lot More Nonsense Coming”

bill bonner
Dear Reader,

This is the second part of the interview with Bill Bonner.

He founded Agora Inc. in 1979. With his friend and colleague Addison Wiggin, he co-wrote the New York Times best-selling books Financial Reckoning Day and Empire of Debt. His other works include Mobs, Messiahs and Markets (with Lila Rajiva), Dice Have No Memory, and most recently, Hormegeddon: How Too Much of a Good Thing Leads to Disaster.

In this interview Bill tells us that “We have got a lot more, a lot more nonsense coming and I think it’s going to come first from Europe where Draghi is going to come up with a lot more QE like stuff.  We don’t know exactly what or when.”

Happy Reading!
Vivek Kaul
Iceland just sent its 26th banker to prison. As far as I know not a single US banker or someone from Wall Street has gone to jail. Rajat Gupta and Raj Rajaratnam have, but their cases were different. They had nothing to do with the financial crisis.

Ah! I am not sure, but as far as I know no banker specifically has been gone to jail as a result of the crisis.  I don’t know what to make of it.  I am hesitant to condemn the bankers.

I mean they were playing the game when in effect, they were the ones who made the rules. They bribed the politicians to make the rules and they played by those rules. Did they break the rules?  I don’t know.

Why do you say that?

I have been involved in the financial industry in America for a long time. What I do know is, those rules are very tough to understand. If anybody wants to put you in jail, they can put you in jail because it’s sure that you are violating some rule somewhere. There are too many of them.  So I am little bit sympathetic to the bankers in that particular aspect about being convicted of crimes. But I am not at all sympathetic to them in the broader sense because as I said they created that system. I don’t think they deserve to go to jail because I would bet those rules are pretty non-screwy. I do bet they deserve to go broke and that’s what would have happened and that’s the way the market works.

But these guys escaped…

The market doesn’t put you in jail just because you bet on the wrong banker.  But the market has a way of taking care of these problems and it was on its way to taking care of these problems in a big way in 2008, when half of Wall Street was exposed to bankruptcy. Half of those institutions probably would have gone broke and half would have been broken up and sold. That would be a punishment and getting what one deserves. That to me makes sense. Instead of that, the government came in and gave these people money. It gave the people who had made such bad bets even more money to make even bigger bets and then it claimed to be enforcing the law. The wrong doers were too close. They all were too cozy there.

That’s a nice way of putting it…

So my guess is that in Iceland their financial industry did not lobby correctly.  But the end of it was that the financial industry got away scot free and got away with all of their ill-gotten gains and went on to make even more money as the Fed gave them money in the terms of zero interest rate financing.  So the whole thing is absolutely preposterous in every sense and offensive.

Your new book is called “Hormegeddon: How Too Much of a Good Thing Leads to Disaster.”  So can you elaborate a little on the subtitle of the book, “How too Much of a Good Thing Leads to Disaster.”  Why do you say that?

Well there is a famous quote in America by Mae West, who said, “Too much of a good thing is wonderful.”  The thing that she was talking about might be the only thing that too much of is wonderful.  But most things are like sugar. You think, well, I will have a chocolate pudding for dessert and one chocolate pudding is wonderful, two chocolate puddings is okay.  By the time the third chocolate pudding comes around, you begin to say um, I am not sure about this and by the fourth you begin to feel a little sick. If you keep eating chocolate puddings, it is not going to be good for you. So that’s true of almost anything.

By the way the economists have a rule for this called the principle of declining marginal utility and it seems to apply to just about everything.  No matter what you try to do or what you think.

Can you give us an example?

It applies to money. When you have no money and somebody gives you 10 dollars, that 10 dollars, each one of those dollars is very very valuable to you and if you have a million dollars and somebody gives you 10 dollars you really are not going to be impressed at all because the value of that money has declined.  Each additional incremental dollar declines to the point where it is almost worth nothing. We read in the papers that multibillionaires like Zuckerberg have given away 50 billion dollars and that is such a great thing. But actually those 50 billion dollars really had no value.

What do you do when you already have the house that you want…you already have the car that you want… and you can’t eat any more chocolate desserts…no matter how much money you have…you cannot buy another car…what are you going to do with it?

You only have a certain number of hours in a day…you can only watch so many movies…you can only do this…you can only do that…so you reach a point where the extra money that you get has a marginal utility that has declined to zero and then below zero.  Because you have to take care of it, you have to think about it and you have to protect it.  And so when a billionaire has 100 billion dollars and he gives away 50, well I don’t know if he has given away that much.

But anyway, the principle applies to everything.

Can you give us some more examples?

It applies to security, one of the cases that I explained in the book.  Now you would say well security; you can’t be too safe and that’s what they tell you when you go through the line at the airport and there is a grandmother in front of you and they are checking her out thoroughly making her go through twice and panning her down and you are thinking in what way does she pose a threat to anybody and then a voice comes out that says, “you cannot be too safe.”

But in fact you can be too safe and because everything that you do in that direction involves expending money and time and resources that could be used for something else.

Can you give us an example?

In the extreme example that I used in the book—In Germany after the First World War, it felt very unsafe, you know they had capitulated in the war and the allies that is to say France, America and Britain were not at all sympathetic. So Germany felt terribly exposed and they were not allowed even to have an army. 

So along came Adolf Hitler and he said, “Enough of this, I am going have an army anyway.” And he began investing German money in the security industry and at first it seemed like the right thing to do.  And at first the viewers, especially the foreign viewers, who really didn’t know what was going on, they thought that this was great. Germany was getting back on its feet and their factories were hustling again. Everything seemed to be going in the right direction.

But Adolf Hitler did not stop with a little bit of security, he wanted a lot of security and more and more of the German economy, was shifted from domestic production to military production and the result of this was that it shifted people’s minds too, because pretty soon a lot of the German workforce actually worked for the defence industry and a lot of people had children, sons, daughters, nephews in the army. Everybody became very sympathetic to the army, to the defence industry and after years of propaganda to the idea that Germany needed its place in the sun and the way to get it was with military force.

So they launched on this adventurism which they started in 1939 and the result of that we all know.  It was disastrous. It ended in the worst possible way for Germany where all of that security bought them no security at all.  It was counterproductive. It was a negative pay off.  They had gone from when they had too much of a good thing, security being a good thing, to the point where they had no security at all.  And that’s true in a lot of things, I mean that principle.

How do you link this to the current financial crisis?

Well you could say almost exactly the same thing about credit.  A little bit of borrowing is a good thing and the credit has proven to be useful in many circumstances. In fact, credit is as old as the hills and even before there was money there was credit.

Credit right.

Yeah there was debt and people would remember in small tribes. Anthropologists have done a lot of study of this.  They found that people would remember that somebody gave them chicken or somebody gave them an arrowhead or somebody’s daughter was exchanged to one family and they owe them a daughter or something or another.  And they remembered.  They had long memories of this stuff.  So credit is basically something that has been around for a long time and surely a little bit of credit seems to help an economy, but too much credit and then you end up with these funny things happening as we have in the world today.

For sure…

And by the way world credit is astounding in its growth; in 1995, which is 20 years ago, the entire world credit was 40 trillion dollars; today it’s 225 trillion.  That’s in a period in which the GDP has risen like 2% per year.  This is a phenomenal separation of the real economy from the Wall Street economy; The Wall Street economy being an economy of debt, assets, financial instruments, etc.  So we have this huge diversion.

We have seen also the same sort of thing, a declining marginal utility of debt, where each additional dollar invested in debt has produced less and less GDP payoff.  And so at the end, in 2009, we were seeing huge increases in debt with no increase in GDP and that’s what is happening again today, where debt is still going up at a very high rate and the GDP growth has declined in America to about a zero. In fact, it might be zero and it might be negative, we are waiting for the figures for the last quarter to come out, but there are some people guessing that the next quarter is going to be a recessionary.

Given that the next quarter is going to be recessionary, how do you see Janet Yellen and the federal open market committee going about increasing the federal funds rate…

Oh! I don’t think they will and I don’t think they can.  I think that it’s…

Will they reverse the cut?

They won’t want to because you know they have staked their short term reputations on this idea that the economy is recovering and that therefore they can normalise interest rates.  They are all in cahoots by the way. Also, these guys talk to one another. I think what they are counting on is Mario Draghi [the President of European Central Bank] to reinvigorate the European economy with a lot of credit, because he has been generally not done as much.

So Draghi came out and said that he would do whatever had to be done and he said that there were no limits to what he would do.  And right after that the world stock markets went up.  Yellen would much prefer for Draghi to do the heavy lifting this time and my guess is that they have a lot more they can do and I don’t think we have reached the end of this cycle at all.  I think we have got a lot more, a lot more nonsense coming and I think it’s going to come first from Europe where Draghi is going to come up with a lot more QE like stuff.  We don’t know exactly what or when.

You see Yellen going back to QE?

I do, but not quickly.  First they are hoping that the Europeans will do enough. If the Europeans put out enough cheap money it ends up in America any way because the Europeans want to buy US treasury bonds in order to protect their money so that’s probably what will happen.  

I think it really depends on how effective the Europeans are. If the Europeans are not effective and we get another big wave downward in the US markets and we go into a recession in the first quarter, I think then first they will announce that they will not do any further hikes. Then maybe they will come with some QE program or something, but there is no way in which they are going to allow a real correction.  A real correction is the severe serious thing. All of their training and their institutional momentum, all of that goes towards solving these problems rather than letting them solve themselves.

Thank you Bill.

Thank you.

Concluded…

The interview originally appeared on the Vivek Kaul Diary on Equitymaster

You can read  the first Part of the interview here 

Bill Bonner: “It’s 100% impossible for the value of stocks to be divorced from the economy”

bill bonnerDear Reader,

This is a Special Edition of the Diary. In this I speak to Bill Bonner, whose books and columns I have admired reading tremendously over the years. He founded Agora Inc. in 1979. With his friend and colleague Addison Wiggin, he co-wrote the New York Times best-selling books Financial Reckoning Day and Empire of Debt. His other works include Mobs, Messiahs and Markets (with Lila Rajiva), Dice Have No Memory, and most recently, Hormegeddon: How Too Much of a Good Thing Leads to Disaster.

Even though Bill writes largely on finance and economics, his writing style is close to literary fiction, and that is precisely what makes it so enjoyable to read him.

In this interview we talk about how the world of finance and economics has changed over the last few years. And how does Bill read the world that we live in. This paragraph summarises everything: “I just didn’t think it [i.e. the financial crisis] will go on this long but that’s also one of the realities that things that you think can’t last, actually do last longer than you expect and they get worse than you expect and then after they have gotten much worse and lasted much longer than you expect then you begin to think well maybe I don’t understand something about it and maybe there is something going on here that can last and then of course it blows up and you were right all along and then at that time of course you are not anticipating it.”

This is the first part of the interview. The second part will appear tomorrow.

Happy Reading!
Vivek Kaul


I guess the last time we spoke would probably have been sometime in 2011-2012.  So how have things changed?

It was surprising to me that the authorities were more aggressive than I expected coming in with the QE1, QE2 and QE3 and then the twist. And those things as expected didn’t do anything for the economy.

In fact, it may have actually slowed down the real economy.  But they did wonders for the stock market and the financial industry so they are very very popular and well those things were essentially reducing the cost of credit, making easy money even easier.

So naturally, there is more and more debt and it just seems to be a phenomenon or fact of life that when you make debt cheap, when you make it cheaper than it should be, you get people borrowing money for things they shouldn’t be doing and too much capacity, too many speculations, too many gambles, too many business expansions that don’t really make any sense.

And what did that lead to?

So we saw the effect of that in the commodity market, particularly the oil market which has been really laid low by this combination of cheap money which made it possible for American drillers to get out there all over the place and drill for oil and some marginal producers in Canada and otherwise in Brazil and everywhere to come up to increase the supply of oil. Meanwhile the actual demand for oil was going down because the world economy was actually not in a growth mode at all.

So we have those kinds of things happening and that’s all happening since the last time we talked and the huge expansion and explosion and implosion of the oil market, implosion of the commodity market and explosion in world debt which has gone up about 57 trillion dollars since 2008. So these things were really much bigger than I anticipated.

I just didn’t think it will go on this long but you that’s also one of the realities that things that you think can’t last, actually do last longer than you expect and they get worse than you expect and then after they have gotten much worse and lasted much longer than you expect, then you begin to think well may be I don’t understand something about it and maybe there is something going on here that can last and then of course it blows up and you were right all along and then at that time of course you are not anticipating it.

So why hasn’t all this debt lead to economic growth? Why hasn’t cheaper money led to economic growth because you know this was one of the beliefs that central bankers had and their actions in the last seven- eight years have been built on the belief that we will flood the markets with money, we will have low interest rates, people will buy, companies will do well and economic growth will return. Why hasn’t this happened?

Why doesn’t that happen?  And the answer is hard. I don’t really know. There is a Swedish economist named Knut Wicksell and Knut Wicksell noticed, that whenever the cost of money was too low, he said there were two interest rates.

He said there was a natural rate which is to say the rate that money should cost in a real properly functioning market and then there is the actual rate and the actual rate is jigged up by the authorities in the banking industry. Whenever the actual rate is too low, people do not invest in the kinds of things that will increase real production.

He said what they do, and I never have really fully understood this, but he said what they do when money is too cheap, they tend to go for easy things. So the banks take the easy money which is too cheap and then they invest it in US Governments Securities, you know the 10-year treasury bonds and that way they get guaranteed return, a guaranteed positive carry.

What else did he say?

And then he says that when money is too cheap people make cheap investments, one because they don’t really know what is going on.  You know the cheap money distorts the whole picture.  The cost of money is the critical number in all of capitalism You have to know what it will cost you really to borrow money. And once you know what the money really costs then you should decide whether you should build a factory, whether you should invest in this, buy that.  

You don’t know until you know the real cost of money and by distorting the real cost of money as Wicksell points out what it does is it drives out everybody away from real investment where they don’t really know what they should be doing. They don’t want to invest real money in a project where the returns are uncertain and the value of money is uncertain and everything is uncertain. So they go for these cheap investments.  These easy investments such as US treasury bonds where they know they will get paid and so you get a big increase in these debt investments. Hence, just the quantity of debt goes up where everybody is just counting on being able to borrow cheap and lend a little less cheap in order to pocket the difference without any real risk.

Even though the economies as such haven’t recovered, the stock market and the real estate markets in parts of the world have done very very well.  So how do you explain that dichotomy? Has the link between economic growth and stock market returns broken down?

Oh! It has totally broken down. We have a chart that we use. We go back to 1971, where we believe something fundamental happened when they changed the US money system. Since 1971 what you see if you look at US GDP growth, it looks more or less normal.  I mean the growth rate was higher in the 70s and it gradually went down decade after decade, it got lower and lower.

But you are talking about going down from five to three to four to three to two and now probably about zero percent, but that growth is real…that’s the real economy…that’s Main Street…that’s where people work…that’s where they spend their money…that’s where they earn their money.

When you put that on to that chart, and you put a chart of what the value of America’s stocks and bonds are, then that chart just goes right up after about 1995.

Yes that’s what the chart shows…

And so there is something going on where the stocks and the value of assets is being cut off completely from the value of the real economy that supports them, which is impossible of course.

I mean it is impossible for that to continue because ultimately any asset is only valuable in as much as the economy gives it value.  It’s not valuable in itself.  If you have a blue jeans factory and you are producing five thousand pairs of blue jeans a day but that is not worth a penny unless you have got people who are willing to buy five thousand blue jeans a day and they can only do that if they are earning enough to buy five thousand blue jeans a day.

And you know that was Say’s principle which was that “Supply creates demand”, which is a funny thing. I mean it’s easy for people to misunderstand that.  But what it really means is that it’s only because you have an economy that produces wealth that people have the money to buy what you are making.

So there is no way, it’s absolutely hundred percent impossible for the value of stocks and bonds to be divorced from the value of the economy itself.  And what we have seen is a separation and we call it a divorce. But the two have been separated for a long time and my guess is that they are going to get back together.

In the book ‘The Age of Stagnation’ Satyajit Das makes a very interesting point about how lower interest rates have not led to increased consumption and he gives a very interesting reason for it. What he says is that when the return on fixed income investments comes down, people put their money in the stock market and when they do that the pressure on companies to keep increasing their earnings so that they can keep giving dividends increases.

You know people are looking at stocks as a mode of dividend [regular income] than a mode of capital gains because the money they used to earn through the fixed income investments has come down [dramatically].  So when there is pressure on companies to give dividends in a scenario where the sales are not really growing, they fire their employees. They [also] borrow money so that they can buy back their stocks and when they buy back their stocks the earnings per share goes up and the dividend per share [as there are fewer shares than before] also goes up.  So that is why even with cheap money, easy money and low interest rates, consumer buying hasn’t picked up and hasn’t translated into economic growth.  Does this makes sense?

Well I think it totally makes sense. I saw an example of that just in today’s press which unfortunately I can’t recall. The company announced simultaneously that it was laying off 10,000 employees and had a big [stock] buy-back program. 

I think it’s just a shift that in America has been widely described as the ‘financialization’ where the money goes from Main Street to Wall Street. You can see that shift very clearly, if you look at the salaries paid on the Main Street, which have gone nowhere for decades and the salaries paid on Wall Street which have gone straight up and you could also look at the profit share of the economy.

The whole of the financial industry earned about 10% of the US profits in 1980 and by 2007 it was 40%. This is wealth that is going from Main Street economy where people work, live, eat, earn their lives, earn their retirements to Wall Street where its speculation, gambling, investing of sorts.  And that change has transformed the entire economy and eventually that is what I keep saying—trees don’t grow to the sky. I feel this cannot go on forever and how much longer it can go on of course is a subject of great interest.  But I really don’t know.

You know you talked about Wall Street, do you think Wall Street in 2015 -2016 has gone back to the way things were in 2006, 2005 and 2007. Would you say that?

Oh yes! I would say that that’s generally the case.  You don’t want to pin point and you don’t want to be too tied to historical rhythms but it certainly looks that way.  We don’t have a housing bubble of the same sort now in America.

But there is a bubble…

There is a bubble in housing but it is not the same sort.  But the bigger bubbles in the US today are the bubbles in the student debt and auto debt.  We have a heck of an auto debt bubble and the corporate debt bubble that we didn’t have before.

Corporate debt is huge because all the money that has been used to buy back shares…

It is mind boggling to think that a corporation would borrow money to buy some shares and you wonder what business is this corporation in.

Is the student bubble has big as the housing bubble?

No. It’s not that big. The housing bubble was worth $4 trillion or something and this is $ 1 trillion.

Which is big anyway. $1 trillion is not small.

It’s huge, but it’s not the same kind of huge.  It’s an entirely different thing because the housing bubble was exposed to the value of the collateral.  In the housing bubble there is something there and eventually it was obvious that what was there was not worth what they thought it was because at the end of it the typical house costs something like twice as much as the typical family could afford.  So it didn’t take a genius to figure out that cannot go on for much longer and by the way salaries were not going up.  There was no way that a person was going to catch up to that.  But now what is the collateral on a student loan?  It’s nothing.

There is some intellectual capital…

This student loan is interesting because the collateral is essentially worthless.  They have done studies to show that if people borrow money, get educated they don’t earn more money and it’s a bit of a fraud.  Its money that a bank lends, secured by the government, goes to the student, goes to the education industry, which is just lobbying Congress for the whole thing to continue.

How big is the auto bubble?

The auto bubble is big but I don’t remember the numbers. And there is a huge transformation of the auto sales system where it is all directed.

So essentially what we can say here is that low interest rates have had some impact on the auto industry, I mean people have been buying cars.

Big effect yes and without those low interest rates there wouldn’t be these car sales and the car sales like employment have been held up by the central bankers and the economists as evidence that the economy is healthy.

Why they are buying cars is because the interest rates are held down.  This is the equivalent of those low interest loans in the housing industry in 2007.  Now they have the auto industry that has loans that stretch out. The average loan goes more than four years.  And yeah four years for cars is a long time.

To be continued…

The interview originally appeared in the Vivek Kaul’s Diary on February 4, 2016

India Is Still Facing The Ill-Effects Of The Congress Era Inflation

India's PM Singh speaks during India Economic Summit in New Delhi
The devil, like beauty, always lies in the detail.

Sometime last week the Central Statistics Office(CSO) put out data which clearly shows that India is still facing the ill-effects of the inflationary era unleashed by the Congress led United Progressive Alliance (UPA) government.

Between 2008-2009 and 2013-2014, the average consumer price inflation was higher than 10%. Food inflation was higher than 11%. High inflation essentially forced people to spend more and in the process they had lesser money to save.

Take a look at the following table. The household savings fell from 23.39% of the nominal Gross Domestic Product (GDP) to 19.06%. Nominal GDP does not take inflation into account.

In Rs crore2011-20122012-20132013-20142014-2015
Household Savings2065453223395023609362380488
As a % of total savings68.20%66.40%63.40%57.20%
As a % of nominal GDP23.39%22.36%20.94%19.06%
Net Financial Savings (Gross financial savings minus financial liabilities)642609733616862873961307
As a % of nominal GDP7.28%7.34%7.65%7.70%
Saving in physical assets1389209146368414608441379411
As a % of nominal GDP15.73%14.65%12.96%11.05%

The household savings primarily comprise of financial savings as well as savings in physical assets and savings in the form of gold and silver ornaments. The overall household savings have fallen from 23.39% of the GDP in 2011-2012 to 19.06% in 2014-2015.

The household financial savings (i.e. investments made in fixed deposits, provident funds, shares and debentures and life insurance) rose marginally from 7.28% to 7.70% of the GDP.

What the table does not tell you is that in 2007-2008, before the Congress led UPA government initiated an era of high-inflation, the household financial savings had stood at 11.45% of the GDP. Between 2007-2008 and 2011-2012, household financial savings fell dramatically. They haven’t really recovered since then despite lower inflation numbers.

In 2014-2015, the consumer price inflation was at an average of 5.83% during the course of the year. Food inflation was at 6.26%. The after-effects of the era of high inflation are still being felt. The low growth in household financial savings also explains why despite a massive fall in inflation, interest rates haven’t fallen at the same pace. If savings had risen at a much faster rate, the interest rates would have fallen more.

Savings in physical assets (homes, land, flats etc.) have fallen dramatically between 2011-2012 and 2014-2015 from 15.73% of the GDP to around 11.05%. This is again a reflection of the fact that people are not saving enough despite low inflation. One possible explanation for this is that incomes are not going up at a fast pace.

The other point that needs to be made here is that the real estate prices have gone way beyond what most people can afford. And that explains to some extent why household financial savings have risen between 2011-2012 and 2014-2015, but physical assets have not.

Now take a look at the following table. Companies (non-financial corporations) have been saving more over the years. Their savings have gone up from 9.59% of the GDP in 2011-2012 to 12.27% of the GDP in 2014-2015. What does this tell us?


In Rs crore2011-20122012-20132013-20142014-2015
Savings of non-financial corporations84713499032212180201532262
As a % of total savings28.00%29.40%32.70%37.20%
As a % of nominal GDP9.59%9.91%10.80%12.27%
Savings of financial corporations272371300599294180335679
As a % of total savings9.00%8.90%7.90%8.20%
As a % of nominal GDP3.08%3.01%2.61%2.69%
Savings of general government-158234-160048-148089-131729
As a % of total savings-5.20%-4.80%-4.00%3.20%
As a % of nominal GDP-1.79%-1.60%-1.31%-1.05%


It tells us that there are not enough investment opportunities going around and hence the profits that these companies are making are not being invested to expand but being saved. This is again a good indicator of the overall slow trend of the economy.

For sustainable economic growth to happen a country needs to produce things. As the Say’s Law states “A product is no sooner created, than it, from that instant, affords a market for other products to the full extent of its own value.”

The law essentially states that the production of goods ensures that the workers and suppliers of these goods are paid enough for them to be able to buy all the other goods that are being produced. Production of goods also creates new jobs.

A pithier version of this law is, “Supply creates its own demand.” And that is why industrial expansion is important for economic growth to happen. But currently that doesn’t seem to be happening.

(Vivek Kaul is the author of the Easy Money trilogy. He can be reached at [email protected])

The column originally appeared on Swarajya on February 3, 2016