Economic survey: Are stalled projects at Rs 8.8 lakh crore or Rs 18 lakh crore?

India-Real-Estate-Market 

Vivek Kaul


Good decision making is also a function of access to good data. The quality of economic data in India has improved significantly over the years, but it still leaves a lot to be desired. Allow me to explain.
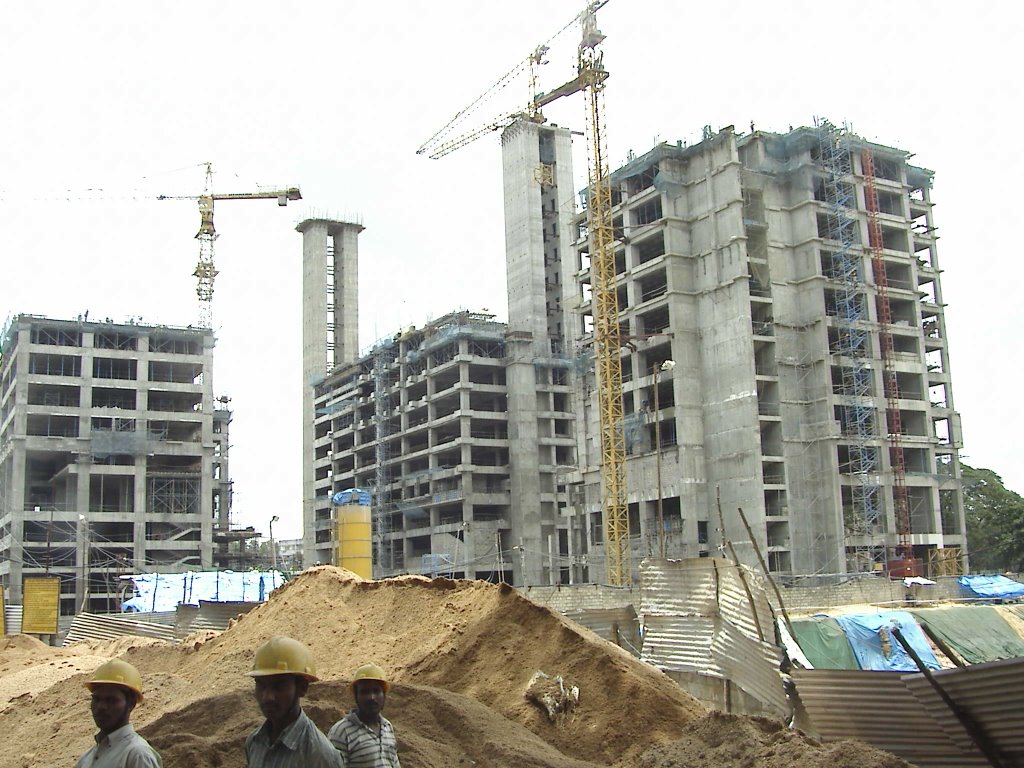
In the Mid Year Economic Analysis released by the ministry of finance in December 2014 it was stated: “There are stalled projects to the tune of Rs 18 lakh crore (about 13 percent of GDP) of which an estimated 60 percent are in infrastructure.”
The Economic Survey which was also released by the ministry of finance today states: “The stock of stalled projects at the end of December 2014 stood at Rs 8.8 lakh crore or 7 per cent of GDP.” The Economic Survey number is lower by Rs 9.2 lakh crore.
The question is how did the stock of stalled projects change so much in a matter of little over two months? The Mid Year Economic Analysis was released on December 19, 2014. Both these documents would have been authored by the Chief Economic Adviser Arvind Subramanian. Guess, only he can tell us why there is such a big difference in the stalled projects data between the two documents.
Nevertheless, if we were to ignore this huge difference and concentrate just on the number put out by the Economic Survey, there is some good news on the stalled projects front.
The Economic Survey defines stalling of projects as a “a term synonymous with large economic undertakings in infrastructure, manufacturing, mining, power, etc.”
The stalling rate of projects has gone up over the last few years. In 2008, the stalling rate was 4% i.e. for every Rs 100 worth of projects under implementation, Rs 4 worth of projects were stalled. For the private sector the stalling rate was 5%.
As of the end of December 2014, the overall stalling rate was 10.3%, whereas the number for the private sector stood at 16%. Hence, for every Rs 100 worth of projects under implementation, Rs 10.3 worth of projects have been stalled. For the private sector Rs 16 worth of projects out of Rs 100 worth of projects under implementation have been stalled.
Interestingly, “the data shows that manufacturing and infrastructure dominate in the private sector, and manufacturing dominates in total value of stalled projects even over infrastructure. The government’s stalled projects are predominantly in infrastructure.”
This has been the “leading reason behind the decline in gross fixed capital formation”.
As investopedia.com points out: “Capital formation refers to net additions of capital stock such as equipment, buildings and other intermediate goods. A nation uses capital stock in combination with labour to provide services and produce goods; an increase in this capital stock is known as capital formation…Generally, the higher the capital formation of an economy, the faster an economy can grow its aggregate income. Increasing an economy’s capital stock also increases its capacity for production, which means an economy can produce more. Producing more goods and services can lead to an increase in national income levels.”
Hence, if economic growth has to return (as per the new GDP series it already has) the stalling rate of projects needs to fall, so that it leads higher capital formation and better incomes. The Economic Survey points out that things may have already started to improve on this front. “The good news is that the rate of stalling seems to have plateaued in the last three quarters. Moreover, the stock of stalled projects has come down to about 7 per cent of the GDP at the end of the third quarter of 2014-15 from 8.3 per cent the previous year,” the survey points out. The stalling rate has fallen from around 11% in December 2013 to 10.3% in December 2014.
While this is good news, the stalling rate still needs to come down dramatically before a substantial impact is seen on economic growth. In fact during the period 2006 to 2008, the stalling rate varied between a little over 2% and 4%. It needs to be brought down to that kind of level.
Further, the question is why have so many projects been stalled? The Economic Survey provides the answer: “It is clear that private projects are held up overwhelmingly due to market conditions and non-regulatory factors whereas the government projects are stalled due to lack of required clearances.”
The government clearances can come thick and fast, if the government wants them to. As the Survey points out: “Clearing the top 100 stalled projects will address 83 per cent of the problem of stalled projects by value.”
Nevertheless, there is not much hope for the private sector. What has not helped the private sector is the fact that it is terribly over-leveraged (i.e. it has taken on a massive amount of debt in comparison to the equity that it has). “An unambiguous fact emerging from the data is that the debt to equity for Indian non-financial corporates has been rising at a fairly alarming rate,” the Survey points out. This is something that cannot be set right overnight.
The declining stalling rate of projects offers some hope on the economic front, but the larger mess still remains.

The column originally appeared on www.firstpost.com on Mar 3, 2015

(Vivek Kaul is the writer of the Easy Money trilogy. He tweets @kaul_vivek) 

Why 7% economic growth looks difficult despite new GDP data

deflationVivek Kaul

Pessimism sells. For reasons I have never understood, people like to hear that the world is going to hell, and become huffy and scornful when some idiotic optimist intrudes on their pleasure.” Professor Deirdre McCloskey – Quoted in The Absolute Return Newsletter

Last Friday the ministry of statistics and programme implementation released a new way of measuring the gross domestic product. The ministry changed the base year for measuring GDP from 2004-2005 to 2011-2012.
The structure of an economy keeps changing. Further, the quality of data that the government has access to keeps improving as well. These changes need to be incorporated in the way the GDP is calculated.
As Crisil Research points out in a recent research note: “The revised series is much wider in scope. The coverage has now expanded to include trade carried out by manufacturing companies (this was earlier a part of trade under service sector), and, among others, partnership firms covered under Limited Liability Partnership Act.”
In fact, as per the new GDP data the Indian economy grew by 4.9% during 2012-13, and 6.6% during 2013-14. The earlier calculations had suggested that the Indian economy grew by 4.5% in 2012-2013 and 4.7% in 2013-2014.
The expected GDP numbers for 2014-2015 calculated as per the new method will be released on February 9, 2015. While the difference in GDP growth is not much in 2012-2013, the difference in 2013-2014 is significant. “Private consumption, government consumption and fixed investment growth were all understated in the old series,” points out Crisil Research explaining why the GDP growth in 2013-2014 jumped as per the new method.
This jump in growth has been questioned by Arvind Subramanian, the chief economic adviser to the ministry of finance.
In an interview to the Business Stanard he said: “This is mystifying because these numbers, especially the acceleration in 2013-14, are at odds with other features of the macro economy. The year 2013-14 was a crisis year – capital flowed out, interest rates were tightened and there was consolidation – and it is difficult to understand how an economy’s growth could be so high and accelerate so much under such circumstances.”
Raghuram Rajan, the governor of the Reserve Bank of India, also advised caution.
As he said in a press conference on February 3, 2015: “We do need to spend more time understanding the GDP numbers and we will be watching February 9 releases with great care and delve in deeply into what we see there. At this point, it is premature to take a strong view based on these GDP numbers. Most of the data that we have seen for 2013-2014, except inflation which was very strong, give us a sense that there was lack in the economy.”
Nevertheless, this jump has led to the belief that the economic growth during the current financial year will be much higher than the 5.5% economic growth that has been previously projected.
An editorial in the Business Standard newspaper pointed out: “The new numbers for 2014-15 will be published on February 9, but the expectation certainly now is that the number will be even higher, perhaps in excess of seven per cent.”
Other ground level data suggests that this is too optimistic. As economists Taimur Baig and Kaushik Das of Deutsche Bank Research point out: “Evidence at the ground level (i.e. sales and earnings data from corporates) and other high frequency macro indicators continue to indicate that the economy is yet to see a capex recovery and meaningful pick-up in activities.”
The quarterly results of companies for the period October to December 2014 have been very poor
As Swaminathan Aiyar writes in The Economic Times: “CNBC data show that for 664 companies that till last week had declared their financial results for the third quarter, sales are up just 1.3% and net profits by just 3.4% on a year-on-year basis. On a quarter-on-quarter basis, sales are down 2.8% and net profits by 6.1%.”
Inflation is not factored into corporate results. Nevertheless, if we do that it is safe to say that sales and profits of companies have fallen on a yearly basis as well. This is clear evidence of the fact that the overall economy is not doing well. It also gives an indication of the fact that consumers are not ready to spend freely.
Given that companies are not doing well, it has also led to a slow growth in tax revenues for the government. At the time the government presented its budget in July 2014, it had assumed that the tax revenues would grow by 16.9% in comparison to the last financial year. But the tax collected for the first nine months of the financial year between April and December 2014 grew by just 5.4% in comparison to the same period in the last financial year. In fact, the growth in excise duties has been more or less flat at 0.2%.
Another factor to look at are bank loans. Latest data released by the RBI shows that bank loans have grown by just 6.6% during the course of this financial year. They had grown by 10.1% during the same period in the last financial year. This is a clear indication of the fact that businesses as well as consumers are not in the mood to borrow.
Then there are stalled projects as well. As Arvind Subramanian, the chief economic adviser to the ministry of finance wrote in the Mid Year Economic Analysis released in December 2014: “Stalled projects to the tune of Rs 18 lake crore (about 13 percent of GDP) of which an estimated 60 percent are in infrastructure. In turn, this reflects low and declining corporate profitability as more than one-third firms have an interest coverage ratio of less than one (borrowing is used to cover interest payments).”
Unlike the GDP which is a theoretical construct, these are real numbers and they don’t look very good. Even the Reserve Bank of India remained sedate about the growth scenario. As it said in the latest
monetary policy statement released on February 3, 2015: “Advance indicators of industrial activity – indirect tax collections; non-oil non-gold import growth; expansion in order books; and new business reported in purchasing managers surveys – point to a modest improvement in the months ahead.”
Given these reasons I would be surprised if the GDP growth number to be released on February 9, 2015, will turn out to be close to 7% or more. If it does that will certainly be a huge surprise.


The article originally appeared on www.equitymaster.com as a part of The Daily Reckoning on Feb 5, 2015