Broken Window Fallacy: What Falling Vegetable Prices Tell Us About Notebandi

broken-windows

The negative effects of demonetisation have now reached a stage wherein there is enough data available to discuss the concept of the broken window fallacy. This fallacy explains beautifully the ill-effects of demonetisation or notebandi in a very simple and straightforward way.

The French economist Frédéric Bastiat discusses this fallacy in his 1874 book That Which is Seen, and That Which is Not Seen. He talks about the anger of a good shopkeeper whose careless son has happened to break a pane of a glass window.

As Basitat writes: “If you have been present at such a scene, you will most assuredly bear witness to the fact, that every one of the spectators, were there even thirty of them, by common consent apparently, offered the unfortunate owner this invariable consolation-“It is an ill wind that blows nobody good. Everybody must live, and what would become of the glaziers if panes of glass were never broken?”

The point being if window glasses were never broken what would glaziers ever do? A glazier is essentially person who fits glass into windows and doors. Without broken window glasses, there would be almost no work for glaziers.

As Basitat writes: “Suppose it cost six francs to repair the damage, and you say that the accident brings six francs to the glazier’s trade-that it encourages that trade to the amount of six francs-I grant it, I have not a word to say against it; you reason justly. The glazier comes, performs his task, receives his six francs, rubs his hands, and, in his heart, blesses the careless child. All this is that which is seen.”

But what about that which is not seen? “It is not seen that as our shopkeeper has spent six francs upon one thing, he cannot spend them upon another. It is not seen that if he had not had a window to replace, he would, perhaps, have replaced his old shoes, or added another book to his library. In short, he would have employed his six francs in some way which this accident has prevented,” writes Bastiat.

So how does all this apply to demonetisation? The phrases to mark in the above paragraphs are that which is seen and that which is not seen. As economist Jim Walker of Asianomics put it in a recent research note: “It is likely that the demonetisation exercise will throw up very little, and certainly transient, weaknesses in measurements of the formal economy. It will be claimed, because it can be seen, that the pain was small and transient.”

This is clearly seen in the post demonetisation revised GDP estimates (or to put it simply economic growth estimates). Most economists have cut their economic growth estimates by less than 100 basis points. One basis point is one hundredth of a percentage.

Take the case of the National Council of Applied Economic Research. It recently cut the Indian economic growth forecast by 70 basis points to 6.9 per cent. Earlier it had forecast an economic growth of 7.6 per cent for 2016-2017.

Or take the case of Moody’s Investors Service. It recently cut the Indian economic growth forecast by 40 basis points to 7.1 per cent, from the earlier 7.5 per cent. The Reserve Bank of India has cut the growth forecast by 70 basis points to 6.9 per cent, from the earlier 7.6 per cent.

Hence, India is widely expected to grow by around 7 per cent in the current financial year. Before demonetisation was announced, it was expected to grow by around 7.6 per cent. Hence, that is a drop of around 60 basis points. Given this small fall, those in favour of demonetisation will claim that the negative impact of demonetisation hasn’t been much.

But this is what Bastiat called that which can be seen. The problem is with the unseen part, which is India’s huge informal economy. As Walker puts it: “Since by definition it is not measured, the detrimental and potentially lasting effects on the informal economy are impossible to observe, precisely because it is not measured.”

This is a point I have made in few of my recent columns. (You can read them here and here). This point is made in the latest Economic Survey as well, a document published by the ministry of finance. As the Survey pointed out: “It is clear that recorded GDP growth in the second half of FY2017 [October 2016 to March 2017] will understate the overall impact because the most affected parts of the economy-informal and cash based-are either not captured in the national income accounts [basically the gross domestic product].”

Hence, a large part of the damage because of demonetisation will remain unseen. This will happen because of two reasons, one because a lot of it will remain unmeasured and two, because a lot of it won’t make it to the national media, which primarily operates out of New Delhi.

Take the case of vegetable prices. Take a look at Figure 1. It shows the vegetable price inflation since November 2015, using the wholesale price index (WPI) data.

Figure 1:
As is clear from Figure 1, the vegetable price inflation was at around 28.5 per cent in July 2016. Since then it has been falling and has been in negative territory since September 2016, with a major fall coming in after demonetisation in November 2016. In December 2016, wholesale vegetable prices fell by a third in comparison to a year earlier. In January 2017, the situation continued.

This damage has primarily happened because the vegetable supply chain in the country works primarily on cash. As analysts Ritika Mankar Mukherjee and Sumit Shekhar of Ambit Capital write in a research note: “The core theme which was discernible across India was that the prices of perishables, such as vegetable, have crashed as farmers are unable to sell their produce as their supply chains are entirely cash driven. For instance, cauliflower and pea farmers in a village in Haryana (near Panipat) told us that they had to trash their produce entirely as there were no buyers.”

With not enough cash going around, transactions for buying and selling of vegetables could not be carried out in the same volume as was the case before notebandi. This has led to a situation where the farmers have had to trash their produce. This is the unseen damage of demonetisation that will never be talked about.

Also, this damage will have a multiplier effect. Given that farmers producing vegetables are ending up with a lot of waste despite a bumper crop, it means that they will not earn as much money as they were hoping to. This will have an impact on their consumption as well. As I had written sometime back, two-wheeler sales have already crashed big time.

The analysts also add: “Whilst farmers were confident that as the cash comes back into the system the situation will improve, they lamented about the fact that the bumper vegetable season was destroyed because of demonetisation.”

How soon the situation improves is not unseen, but it remains to be seen.

The column originally appeared on Equitymaster on February 28, 2017

What Vehicle Sales Tell Us About Notebandi

car

A few days back I got an email from a reader. This email essentially said that the world had moved on from demonetisation/notebandi and it was time that I did as well.

Well, people do get bored. So, does the media.

And in the process, they stop following issues that they did once. As fatigue sets in, this essentially leads to a situation that issues do not get followed to their logical conclusion.

It’s like a daily soap opera which keeps undergoing multiple changes in plots, depending on what the viewers want. Or rather depending on what the managers running the show think the viewers want.

The trouble is that my writing is not like that. Also, now we have some data points to properly analyse notebandi and its impact on the Indian economy.

And it would be rather stupid of me to stop writing on the issue right now. Hence, my writing on notebandi is likely to continue in the months to come and who knows, possibly even years.

So, dear reader, that was that. Let’s now cut to today’s edition of the Diary.

Take a look at Figure 1. It shows the two-wheeler sales over the last five months.

Figure 1: 

Figure 1 clearly shows that there has been a downward trend in two-wheeler sales since September 2016. Notebandi only accentuated this trend. Having said that there has been some recovery in sales in January 2017.

Two-wheeler sales are a very important data point. They show the spending potential of many Indians. They also have a very high correlation with India’s informal economy, which doesn’t get captured very well in the gross domestic product(GDP) numbers.

As Ritika Mankar Mukherjee and Sumit Shekhar of Ambit Capital write in a recent research note: “History suggests that there exists a strong correlation between the nominal GDP generated by the informal sector and… two-wheeler sales data.” And given that two-wheeler sales have shown a largely downward trend lately, what can be said? As Mukherjee and Shekhar point out: “The latest data… shows a marked deterioration underway in the informal sector of the economy.”

As mentioned earlier, the informal sector is not captured well enough in the GDP numbers. As the Economic Survey of 2016-2017 points out: “It is clear that recorded GDP growth in the second half of FY2017 [October 2016 to March 2017] will understate the overall impact because the most affected parts of the economy-informal and cash based-are either not captured in the national income accounts or to the extent they are, their measurement is based on formal sector indicators. For example, informal manufacturing is proxied by the Index of Industrial Production, which includes mostly large establishments. So, on the production or supply side, the effect on economic activity will be underestimated.”

Given this, data points like two-wheeler sales become very important in gauging the real impact of notebandi on the Indian economy. Let’s see how the data for the remaining two months (February and March 2017) comes out. But from four months of data that is available for the second half of this financial year, it can safely be said that things aren’t looking good on this front. And this should be a huge reason to worry. As per Mukherjee and Shekhar, “The informal sector accounts for ~40% of India’s GDP and employs close to ~75% of the Indian labour force.”

Now let’s look at domestic passenger car sales between September 2016 and January 2017. Take a look at Figure 2.

Figure 2:As Figure 2 shows, the domestic passenger car sales have recovered much more quickly than two-wheeler sales, in the aftermath of demonetisation. The January sales were only 4.5 per cent lower than the September sales. In case of two-wheelers, the January sales were still 30.6 per cent lower than the September sales.
What does this tell us? It tells us very clearly that rural India was impacted much more by demonetisation. It tells us that the not so well off have been more impacted much more by demonetisation than the well off. As writer Amit Varma put it in a recent speech: “In all this, the rich got away… You see a reflection of this in automobile sales. They have plummeted for two-wheelers and three-wheelers, but SUV sales are steady. The rich got away.”

And that is something worth thinking about.

The column was originally published on Equitymaster on February 20, 2017

All Bank Deposits Post Notebandi Have Been Invested in Govt Securities

rs-500

One of the many theories offered in favour of demonetisation or notebandi, has been that it has led to lower interest rates. The demonetised notes of Rs 500 and Rs 1,000 had to be deposited into the banks, where the money would be credited against the depositors’ name.

This has essentially led to the total amount of deposits with banks increasing at a rapid rate. Between October 28, 2016, before the demonetisation happened, and January 20, 2017, the total deposits of banks went up by 5.7 per cent. This increase in a period of under three months is huge.

With an increase in deposits, banks have cut interest rates. The logic offered by many experts was that this cut in interest rates will lead to an increase in lending by banks and that would be good for the economy. But the data suggests that anything like that hasn’t happened.

Take a look at Figure 1. It essentially shows the portion of bank deposits that have been invested in government securities, in the recent past.

Figure 1:


What does Figure 1 tell us? As on October 28, 2016, before demonetisation was carried out, around 29 per cent of bank deposits had been invested in government securities. As on January 20, 2017, the latest data that is available, the proportion had jumped to 34.1 per cent. Banks need to compulsorily invest just 20.5 per cent of their deposits in government securities.

Further, between October 28, 2016, and January 20, 2017, the total amount of money banks got as deposits stands at Rs 5.63 lakh crore. During the same period, the total amount of money banks invested in government securities was Rs 6.99 lakh crore. This basically means that during the period under consideration 124 per cent of the money that came in as bank deposits was invested into government securities. Hence, not only all the deposits that came in between October 28, 2016, and January 20, 2017, have been invested by banks into government securities, some of the earlier deposits have also been invested into government securities.

Given that cash is fungible, this basically means that on the whole banks haven’t loaned out any of the deposits that have come after demonetisation. All that money has been invested into government securities.

Now let’s take a look at Figure 2. This essentially plots the portion of bank deposits which have been given out as loans (i.e. non-food credit). Banks give working-capital loans to the Food Corporation of India to carry out its operations, those have been adjusted for.

Figure 2: 

What does Figure 2 tell us? It tells us that before demonetisation banks had loaned out 73.3 per cent of the deposits. This has since fallen to 69.7 per cent. This isn’t surprising given that banks cannot immediately lend out all the money that has come in.

There is another question that needs to be answered here. Given that interest rates have fallen because of demonetisation, how much has bank lending gone up by, before and after demonetisation? Between October 28, 2016, and January 20, 2017, lending by banks went up by a minuscule 0.45 per cent. This basically means that the lending has more or less been flat.

Also, given that all the deposits that have come in since October 28, 2016, have been invested in government securities, this essentially means that some of the deposits that had come in earlier, have been lent out.

This, also tells us, all over again, that lower interest rates are not the only factor that leads to increased borrowing. Hence, the theory of lower interest rates leading to increased borrowing leading to better economic well-being, due to monetisation, does not really work. The data does not show that at all.

There is another point that needs to be made here. A significant amount of investments made by banks in government securities has been made under the market stabilisation scheme(MSS). The government securities issued under the market stabilisation scheme has all the characteristics of regular government securities. But, unlike the regular government securities, these securities are not issued to finance the fiscal deficit of the government. Fiscal deficit is the difference between what a government earns and what it spends and is financed by issuing financial securities referred to as government securities.

What this basically means is that money borrowed under the market stabilisation scheme lies idle. It isn’t used to finance the expenditure of the government. On December 2, 2016, the RBI increased the ceiling of the government securities that could be issued under the market stabilisation scheme to Rs 6 lakh crore. Earlier the limit was Rs 30,000 crore.

As the RBI pointed out in a press release: “After the withdrawal of the legal tender character of the Rs 500 and Rs 1000 denomination notes with effect from November 9, 2016, there has been a surge in the deposits with the banks. Consequently, there has been a significant increase of liquidity in the banking system which is expected to continue for some time.”

The government securities issued under the market stabilisation scheme sucked out this liquidity. But this money has been lying idle with the RBI. Earlier it was a part of the financial system and was helping people carry out transactions. This has reduced the velocity of money. And a lower velocity of money leads to lower economic activity.

Over and above this, the surfeit of deposits coming in has led to banks slashing the interest rates on their fixed deposits. Take a look at Figure 3.

Figure 3: Repo, Base Lending Rate and Term Deposit Rate (Per cent) 

Let’s analyse Figure 3 in some detail. The base rate is essentially the interest rate below which a bank cannot lend i.e. the interest rate at which a bank lends to its best customer. The term deposit rate is essentially the interest rate that a bank pays on its fixed deposits.

Since January 2014, the term deposit rate of banks has fallen. At the same time, the base rate has also fallen. Nevertheless, the term deposit rates have fallen much more and at a far greater speed than the base rates.

This is something that becomes clear by looking at Figure 3 carefully. The gap between the average base rate and the average term deposit rates has increased considerably between January 2014 and December 2016. The base rate has barely moved from 10 per cent to around 9.5 per cent. On the other hand, the term deposit rate has moved from around 8.5 per cent and is now below 7 per cent.

As the Economic Survey points out: “By December 2016 the gap between the average term deposit rate and the average base rate had grown to 2.7 percentage points, from 1.6 percentage points in January 2015.”

The question is why have the banks done this? Over the longer term, the banks have been trying to make up for their bad loans by doing this. As the Economic Survey points out: “They have tried to compensate for the lack of earnings from the non-performing part of their portfolio by widening their interest margins.”

Over the short term, they are simply doing this because of the surfeit of deposits that have come in. They have invested this money in government securities (a large part), which do not pay a high rate of return like lending that money out would. To compensate for this, the banks have cut interest rates on their fixed deposits faster than the interest rates on their loans.

Hence, notebandi or demonetisation has led to lower interest rates on fixed deposits. A major part of the household financial savings in India are held in the form of bank fixed deposits. Anyone looking to meet an investment goal now must save a greater amount and this will leave a lower amount of money for consumption.

Further, lower interest rates haven’t led to a higher lending by banks. All this has led to is money lying idle with the RBI. And that is something that India cannot afford.

(The column originally appeared on Equitymaster on February 16, 2017)

And the Notebandi Lies Continue…

Fostering Public Leadership - World Economic Forum - India Economic Summit 2010

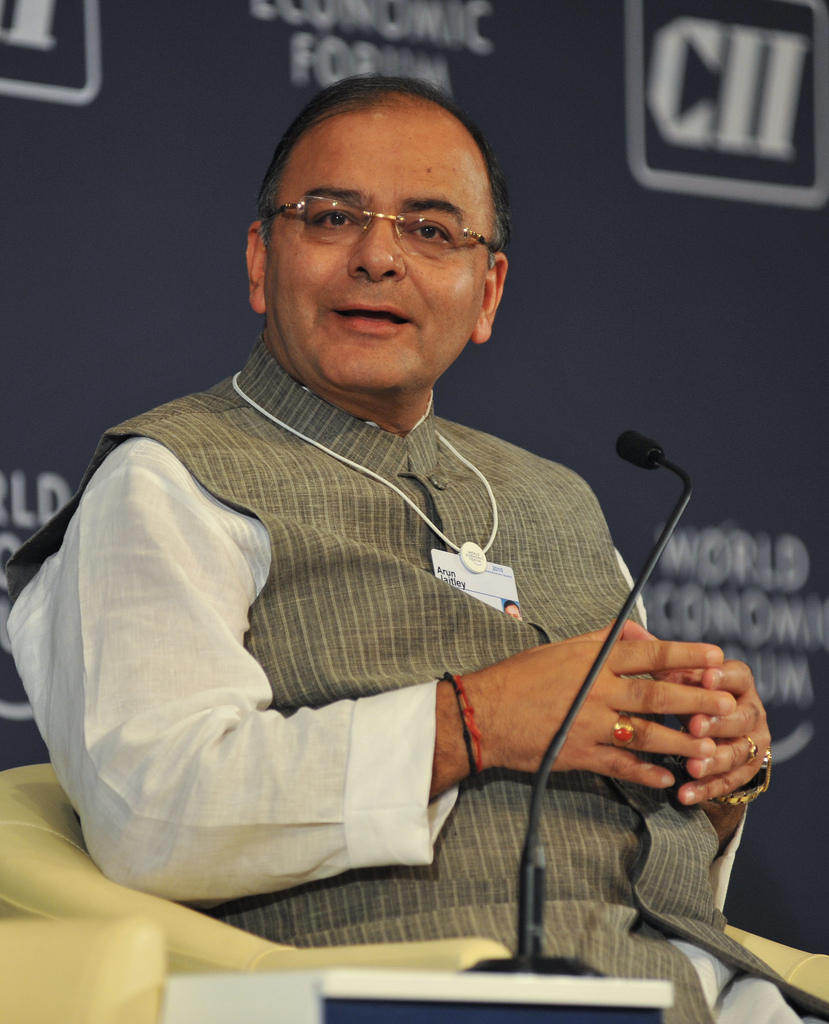
One week back, the finance minister Arun Jaitley said in the Rajya Sabha: “At no point of time, not for a single day, was the currency inadequate.”

Every government needs to defend decisions it has taken. In that context Jaitley’s statement is hardly surprising. Nevertheless, it not only mocks the common man of this country but also tells us how disconnected our ruling politicians are with the realities of the day.

Jaitley was essentially talking about the situation that prevailed in the aftermath of demonetisation or notebandi, as it is more commonly referred to as.

If there was no currency shortage for even a single day, why did ATMs have such long lines for close to a month? Is Mr Jaitley saying that people just gathered there because they had nothing else to do?

If there was no currency shortage even for a day, why did the government place limits on ATM withdrawals? It was churlish of Jaitley to have said what he did, given that 86 per cent of the currency in circulation was demonetised, the midnight of November 8, 2016, onwards.

The advantage with making speeches is that nobody asks questions at the end of it. Nevertheless, the lack of empathy among the politicians does get registered.

That apart, let’s look at the currency in circulation data published by the Reserve Bank of India every week. Take a look at Figure 1.


Figure 1:

Figure 1 essentially shows the currency in circulation in the Indian economy in 2017. December 30, 2016, was the last date for depositing the Rs 500 and Rs 1,000 notes which had been demonetised. Hence, I have taken the currency in circulation numbers from January 6, 2017, onwards, which is a week later.

The currency under circulation has been going up since 2017. On November 4, 2016, four days before prime minister Narendra Modi, made the announcement to demonetise Rs 500 and Rs 1,000 notes, the total currency in circulation had stood at Rs 17.97 lakh crore. In comparison, on February 3, 2017, the total currency in circulation, the latest data available, stood at Rs 10.49 lakh crore.

Hence, the total currency in circulation as on February 3, 2017, was at 58.4 per cent of the level before monetisation was announced. Given this, it is not surprising that the currency shortage, even though it has eased, continues to persist. This goes against what the Economic Affairs Secretary Shaktikanta Das recently said about the remonetisation process being complete.

Take a look at Figure 2. It basically plots the total increase in currency in circulation every week since January 6, 2017.

Figure 2:For the week ending January 13, 2017, the total currency in circulation grew by Rs 52,780 crore. Thereafter, the increase in circulation has fallen quite dramatically. One explanation for this may lie in the fact that initially more Rs 2,000 notes were being printed and that has now been replaced with more Rs 500 notes being printed, which is what the financial system needs, given the shortage of change. But at the same time, it takes four Rs 500 notes to replace money worth Rs 2,000.
The larger point being that the financial system is still away from having an adequate amount of currency. This, as I have explained in the past, is primarily because of the limited currency printing capacity of the government of India and the Reserve Bank of India.

The average increase in currency between January 6 and February 3, 2017, comes to around Rs 37,778 crore. At this speed, it will take many more weeks, before the financial system gets to a level, where it has adequate currency.

The total currency in circulation had stood at Rs 17.97 lakh crore before demonetisation. As of February 3, 2017, the total currency in circulation stood at Rs 10.49 lakh crore. The difference between this and the total amount of currency in circulation before demonetisation stands at Rs 7.48 lakh crore (Rs 17.97 lakh crore minus Rs 10.49 lakh crore).

At the speed of introducing currency worth Rs 37,778 crore per week, it will take close to 20 weeks for the currency under circulation to reach the pre-demonetisation level. One logic that has been offered is that the government may choose not to replace the entire currency.

Even if the government chooses not to replace the entire currency, at Rs 37,778 crore per week, it will take many more weeks before the currency in circulation stabilises at an adequate level.

While, the economics of it, can get tricky, even if the government chooses to go up to Rs 16 lakh crore and not Rs 17.97 lakh crore, it will still take close to 15 weeks to get to the pre-demonetisation level. Of course, the time taken can come down if the speed of money printing can be increased.

Long story short—both Jaitley and Das are essentially lying to the country in saying what they are. And that is something worth remembering and talking about, dear reader.

The column was originally published on February 14, 2017, on Equitymaster

Why Real Estate Prices Haven’t Crashed After Notebandi

India-Real-Estate-Market

Demonetisation or notebandi was expected to push down real estate prices. Some experts had said that by March 2017 real estate prices would fall by 30 per cent. This was supposed to happen because after demonetisation, the cash needed to carry out the black part of the real estate transactions would not be available.

In India, a portion of most real estate transactions is almost always carried out in black. This involves the buyer paying the seller in cash. This essentially ensures that the buyer saves on paying stamp duty, whereas the seller saves on paying a capital gains tax.

With the cash needed to carry out a part of the real estate transaction in black not being available post demonetisation, prices would fall. Or so we were told. (To know my views on the issue, click here).

The question is have real estate prices fallen in the aftermath of demonetisation? The government seems to think so. Take the case of what the
Survey says about this issue: “[Real estate] prices declined, as wealth fell while cash shortages impeded transactions… Prices could fall further as investing undeclared income in real estate becomes more difficult.”

Sometime last week the chief economic adviser Arvind Subramanian said: “The aim of demonetisation, is in fact, to bring down real estate prices.” He also added: “Real estate on the other hand, you do see a dip in prices, in sales, in launches and of course, some of it may be adverse of the economy, but in the long run, some of that is also good, because in equilibrium, the aim of demonetisation, is in fact, to bring down real estate prices.

The question is have real estate prices really fallen? Take a look at the following chart sourced from the latest Economic Survey, which Subramanian perhaps forgot to look at.


The chart essentially shows real estate launches, sales and price, over a period of time. If you look at the right-hand side of the chart, you can clearly see that the red and the blue curves have fallen at a very fast pace. This tells us that demonetisation has led to a huge slowdown in both real estate sales as well as launches.

If we look at the chart carefully, launches of new homes by builders, were down by 60 per cent by December 2016 (the end of the fourth quarter of 2016) in comparison to end 2015. The sales were down by around 40 per cent over a similar period. All of this was not because of demonetisation because both launches and sales were already falling even before demonetisation.

In comparison, the price curve just shows a small dip in the post demonetisation period, this despite the sales crashing. Also, the prices (like sales and new launches) had already been falling even before demonetisation.

So, what does all this tells us? It tells us that the contention of the Economic Survey and Arvind Subramanian of the real estate prices falling should be taken with a pinch of salt. In comparison to the fall in sales and new launches, real estate prices have barely moved.

It also tells us that the government should be carefully reading the documents that it puts out. In this case, the graph says one thing and the analysis accompanying it, says exactly the opposite thing.

So, what explains this phenomenon of falling sales and more or less flat prices? The Indian real estate scenario is always a little tricky to explain. In any other market, if sales had fallen by 40 per cent, the market would have crashed by now. So, what gives? There are no clear cut answers here but only speculative ones.

Most Indian real estate companies are fronts for the ill-gotten wealth of politicians. The builders who operate as fronts have promised a certain rate of return to politicians, and hence, are not able to cut prices. This is one possible explanation. Another explanation that keeps getting offered is the fact that the builders and politicians have made a lot of money over the years, and hence, are in no hurry to cut prices to sell the real estate inventory of homes that has been built up.

A third explanation offered is that banks which have lent money to the builders don’t want them to cut prices. A fourth explanation that was offered to me by a reader was that even though home-sales fell they did not fall by as much as they should have. What does this mean? It basically means that some of the smaller builders post demonetisation, have managed to sell some of their inventory to those who had black money in the form of high denomination notes of Rs 500 and Rs 1,000.

They took this money and used it to pay off their debt to their suppliers. The suppliers then used the money and paid it off to those who they owed money to. Essentially, the demonetised notes were paid down the chain, until they reached the workers who went ahead and deposited the money into their bank accounts. So, the world worked, and black money was converted into white.

I am sure there might be other explanations for this as well. But these are the explanations that I came across and have put them out. With very little data going around, Indian real estate, as always, remains very difficult to analyse.

The column originally appeared in Equitymaster on February 6, 2017