Here’s how India’s government unwittingly aids the growth of ponzi schemes

J164133002Over the last few years a spate of Ponzi schemes have come to light. These include Sahara, Saradha Chit Fund, Rose Valley Hotels and Entertainment and most recently PACL. A Ponzi scheme is essentially a fraudulent investment scheme in which money brought in by new investors is used to redeem the payment that is due to existing investors.
The instrument in which the money collected is invested appears to be a genuine investment opportunity but at the same time it is obscure enough, to prevent any scrutiny by the investors. So PACL invested the money it collected in agricultural land. Rose Valley, Sahara and Saradha had different businesses in which this money collected was invested.
These Ponzi schemes managed to raise thousands of crore over the years. In a recent order against PACL, the Securities and Exchange Board of India(Sebi) estimated that the company had managed to collect close to Rs 50,000 crore from investors. Sahara is in the process of returning more than Rs 20,000 crore that it had managed to collect from investors, over the years.
The question is how do these schemes manage to collect such a large amount of money.
A June 2011, news-report in The Economic Times had estimated that PACL had managed to collect Rs 20,000 crore from investors at that point of time. This means that since then the company has managed to collect Rs 30,000 crore more from investors. An April 2013 report in the Mint quoting state officials had put the total amount of money collected by the Saradha at Rs 20,000 crore.
These Ponzi schemes have managed to collect a lot of money in an environment where the household financial savings in India have been falling. Household financial savings is essentially the money invested by individuals in fixed deposits, small savings scheme, mutual funds, shares, insurance etc.
The latest RBI annual report points out that “the household financial saving rate remained low during 2013-14, increasing only marginally to 7.2 per cent of GDP in 2013-14 from 7.1 per cent of GDP in 2012-13 and 7.0 per cent of GDP in 2011-12…the household financial saving rate [has] dipped sharply from 12 per cent in 2009-10.”
While the household financial savings have dipped, the money collected by Ponzi schemes has grown by leaps and bounds. What explains this dichotomy? Some experts have blamed the low penetration of banks as a reason behind the rapid spread of Ponzi schemes in the last few years.
K C Chakrabarty, former deputy governor of the Reserve Bank of India, in September 2013 had pointed out that only 40,000 out of the 6 lakh villages in India have a bank branch.
Hence, investors find it easier to invest their money with Ponzi schemes, which seem to have a better geographical presence than banks. While this sounds logical enough, the trouble with this reasoning is that the bank penetration in India has always been low. It clearly isn’t a recent phenomenon. So, why have so many Ponzi schemes come to light only in the last few years?
Another reason offered is that the rate of return promised by these Ponzi schemes is high and is fixed at the time the investor enters the scheme. This is an essential characteristic of almost all Ponzi schemes. Take the case of Rose Valley. The return on the various investment schemes run by the company varied from anywhere between 11.2% to 17.65%.
In case of PACL The Economic Times report referred to earlier pointed out that “If a customer puts down Rs 50,000 for a 500 square yard plot, he or she can expect to get back Rs 1,01,365 in six years, or Rs 1.85 lakh in 10 years.” This meant a return of 12.5% and 14% on investments.
An April 2013 report in the Business Standard pointed out that the fixed deposits of Saradha “promised to multiply the principal 1.5 times in two-and-a-half years, 2.5 times in 5 years and 4 times in 7 years.” This basically implied a return of 17.5-22%.
It is clear that returns promised by these Ponzi schemes have been significantly higher than the returns available on fixed income investments like fixed deposits, small savings schemes, provident funds etc., which ranged between 8-10%. Given this, it was the greed of the investors which drove them to these Ponzi schemes, and in the end they had to pay for it.
Again that would be a simplistic conclusion to draw. Rose Valley was paying 11.2% on one of its schemes. PACL was offering 12.5%. This returns weren’t very high in comparison to the returns on offer on other fixed income investments.
In fact, most Ponzi schemes tend to offer atrociously higher returns than this. Charles Ponzi on whom the scheme is named had offered to double investors’ money in 90 days. Or take the case of the Russian Ponzi scheme MMM, which came to India sometime back. Its sales pitch was that Rs 5000 could grow to Rs 3.4 crore in a period of twelve months. Speak Asia, a Ponzi scheme which made a huge splash across the Indian media a few years back, promised that an initial investment of Rs 11,000 would grow to Rs 52,000 at the end of an year. This meant a return of 373% in one year. Another Ponzi scheme Stock Guru, offered a return of 20% per month for a period of up to 6 months.
In comparison, the returns
offered by the likes of Rose Valley, Saradha, Sahara and PACL are very low indeed. But investors have still flocked to them. In fact, in its order against PACL, Sebi estimated that the company had close to 5.85 crore investors. So, the question is why are so many people investing money in such schemes?
The answer lies in the high inflation that has prevailed in the county since 2008. For most of this period the consumer price inflation and food inflation have been greater than 10%. In this scenario, the returns on offer on fixed income investments have been lower than the rate of inflation. Hence, people have had to look at other modes of investment, in order to protect the purchasing power of their accumulated wealth. A lot of this money found its way into real estate and gold. And some of it also found its way into Ponzi schemes. This is the “real” reason behind the explosion in the kind of money that has been raised by these Ponzi schemes.
But why is the rate of interest on offer on fixed income investments been lower than the rate of inflation? This is where things get really interesting. Take a look at the graph that follows. The
government of India since 2007-2008 has been able to raise money at a much lower rate of interest than the prevailing inflation. The red line which represent the estimated average cost of public debt(i.e. Interest paid on government borrowings) has been below the green line which represents the consumer price inflation, since around 2007-2008. 
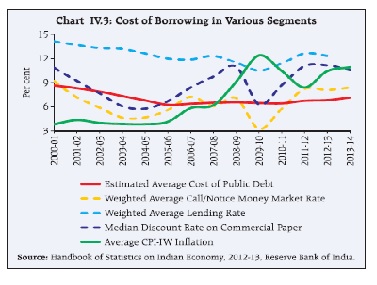
cost of borrowing

How has the government managed to do this? The answer lies in the fact that India is a financially repressed nation. Currently banks need to invest Rs 22 out of every Rs 100 they raise as deposits in government bonds. This number was at higher levels earlier and has constantly been brought down. Over and above this Indian provident funds like the employee provident fund, the coal mines provident fund, the general provident fund etc. are not allowed to invest in equity. Hence, all the money collected by these funds ends up being invested in government bonds.
As the Report of the Expert Committee to Revise and Strengthen the Monetary Policy Framework points out “Large government market borrowing has been supported by regulatory prescriptions under which most financial institutions in India, including banks, are statutorily required to invest a certain portion of their specified liabilities in government securities and/or maintain a statutory liquidity ratio (SLR).”
This ensures that there is huge demand for government bonds and the government can get away by offering a low rate of interest on its bonds. “
The SLR prescription provides a captive market for government securities and helps to artificially suppress the cost of borrowing for the Government, dampening the transmission of interest rate changes across the term structure,” the Expert Committee report points out.
The rate of return on government bonds becomes the benchmark for all other kinds of loans and deposits. As can be seen from the graph above, the government has managed to raise loans at much lower than the rate of inflation since 2007-2008. And if the government can raise money at a rate of interest below the rate of inflation, banks can’t be far behind. Hence, the interest offered on fixed deposits by banks and other forms of fixed income investments has also been lower than the rate of inflation over the last few years.
This explains why so much money has founds its way into Ponzi schemes, even though the rate of return they have been offering is not very high in comparison to other forms of fixed income investment. To conclude, the government of India has had a significant role to play in the spread of Ponzi schemes.

A slightly different version of this article appeared on Quartz India on September 10, 2014


(Vivek Kaul is the author of Easy Money: Evolution of the Global Financial System to the Great Bubble Burst. He can be reached at [email protected])

Borrow less, don’t blame RBI: Time Jaitley stops doing a Chidu on us

Fostering Public Leadership - World Economic Forum - India Economic Summit 2010Vivek Kaul

A favourite pastime of former finance minister P Chidambaram other than telling us that the Indian economic growth was about to bounce back, was to ask the Reserve Bank of India (RBI) to cut interest rates.
The new finance minister Arun Jaitley has carried on from where Chidambaram left.
On August 10, Jaitley had nudged the RBI to cut interest rates after taking various factors into account.

The thing with most politicians is that either they do not understand how a market operates or they pretend otherwise. Jaitley and Chidambaram, I assume would fall into the latter category. Allow me to explain.
The latest RBI annual report points out that “
the household financial saving rate remained low during 2013-14, increasing only marginally to 7.2 per cent of GDP in 2013-14 from 7.1 per cent of GDP in 2012-13 and 7.0 per cent of GDP in 2011-12…the household financial saving rate [has] dipped sharply from 12 per cent in 2009-10.”
Household financial savings is essentially the money invested by individuals in
fixed deposits, small savings scheme, mutual funds, shares, insurance etc. The household financial savings were at 12% of the GDP in 2009-10. Since then, they have fallen dramatically to 7.2% in 2013-14. A major reason for the fall has been the high inflation that has prevailed since 2008.
This has had two impacts. One is that expenses of people have consistently gone up, leading to lower savings. Further, of the money that was saved a higher proportion was directed towards physical savings like gold and real estate. This was done because the rate of return available on financial savings was much lower than the rate of return on gold as well as real estate. The average savings in physical assets between 2005-06 and 2007-08 stood at 11.4% of the GDP. This shot up to 14.8% in 2012-13(the data for 2013-14 is not available).
What has not helped is the fact that over the last few years the fiscal deficit of the government shot up dramatically, as its expenditure shot up at a much faster rate, in comparison its income. Fiscal deficit of the government is the difference between what it earns and what it spends. This increase in fiscal deficit was financed through increased borrowing.
In fact, buried in the
second chapter of the Economic Survey of 2013-2014 is a very interesting data point. In 2012-2013, the household financial savings amounted to 7.1% of the GDP. The government borrowing stood at 7% of the GDP. A similar comparison for 2013-2014 is not available yet. Nevertheless, it would be safe to assume that it won’t be materially different from the 2012-2013 comparison.
The conclusion that one can draw from this is that entire household financial savings were used up to fund the fiscal deficit. This is also reflected in the
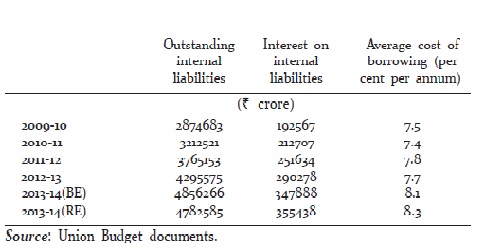
following table from the Economic Survey.
average cost of borrowing
As the government borrowed more and more, eating up into the household financial savings, the cost of its borrowing also went up. In 2009-10, the average cost of borrowing stood at 7.5%. By 2013-2014, this number had shot up to 8.3%.
Lending to the government is the safest form of lending. Hence, the rate of interest that the government pays on its borrowing becomes the benchmark for all other kind of loans. Also, with greater borrowing, it left a lower amount of money available for others outside the government to borrow. As the
Economic Survey pointed out “In recent years, with a decline in the savings rate and an enlarged fiscal deficit, the external capital from outside the firm, available to the private sector has declined.”
So, with the government paying a higher rate of interest on its debt, and not enough money going around for others (which included banks) to borrow, it isn’t surprising that you and I had higher EMIs to pay.
To cut a long story short, if interest rates need to come down, the government needs to borrow less. If the government has to borrow less, it needs to spend less or try and increase its income. If this happens, there will be more money going around for everyone else to borrow, and will lead to a fall in interest rates.
Unless these things happen, any call by the finance minister asking the RBI to cut interest rates needs to be taken with a pinch of salt. The RBI may decide to humour the finance minister and go ahead and cut the repo rate (the rate at which it lends to banks). Nevertheless, any material fall in interest rates will happen only once the government is able to make serious efforts towards curtailing the fiscal deficit.
And the next time you hear Jaitley asking the RBI to cut interest rates, remember, he is trying to do a Chidambaram on us.

The article originally appeared on www.Firstbiz.com on August 23, 2014

'The Federal Reserve Learnt the Lessons Of The Great Depression'

Prof Randall Kroszner..

R Jagannathan and Vivek Kaul

Randall S Kroszner served as a Governor of the Federal Reserve System from March 2006 until January 2009. During his time as a member of the Federal Reserve Board, he chaired the committee on Supervision and Regulation of Banking Institutions and the committee on Consumer and Community Affairs. Kroszner was a member of the President’s Council of Economic Advisers (CEA) from 2001 to 2003. Currently he is the Norman R Bobins Professor of Economics at the University of Chicago Booth School of Business. He is an expert on international financial crises and the Great Depression. He was recently in India for the opening of The University of Chicago Center in Delhi. In this interview Kroszner tells Forbes India on how the Federal Reserve managed to avoid another Great Depression in 2008 and why it had to let the investment bank Lehman Brothers go bankrupt.

You were a governor at the Federal Reserve between 2006 and early 2009. That must have been a very tough and an exciting time…
Three easy years…(laughs). I am joking.
Can you give us some flavour of how those years were?
It was an incredibly challenging time because the markets were moving so rapidly. The economy was also moving rapidly downward. So we had to take important decisions in real time. We would often get into situations where we would try to survive until Friday and then try to do the resolution by Sunday, before the Asian markets opened. So we had a lot of board meetings late on Fridays, Saturdays and Sundays. And it was a time where having an economic framework was very useful because when you have to make decisions in real time, you need to have a framework to understand what the priorities are.
You and Ben Bernanke are scholars of the Great Depression. How did that help?
A number of us were quite familiar with the economic history. Three out of the five of us on the board had written papers on the Great Depression. And we were all pretty much influenced by Milton Friedman and Anna Scwartz’s magisterial A Monetary History of the United States. Their study squarely put the blame on the inaction of the Federal Reserve, turning a depression into the Great Depression. Those were very important lessons for us and gave us both an economic and historical framework for looking into the kind of price distress we were having at that point of time, so that we could act quickly and boldly to prevent a repeat of the Great Depression.
Did you all really believe that if the fiscal side and the monetary hadn’t acted as they did in 2008, you were really seeing a repeat of the Great Depression?
There was a certainly a risk of that because clearly there was a lot of turmoil in the financial markets. There was a potential for failure of many financial institutions, if the Fed did nothing and did not provide liquidity to the market and some institutions. It was by no means a certainty. Even if the probability was low, it’s a risk that I and other members of the Federal Reserve board were reluctant to take.
In the meetings at the Fed before September 2008 what was the atmosphere like? Did Chairman Bernanke and other governors have a clue of what was to come?
If you see the verbatim transcripts of 2008 many of us including myself were very concerned about the fragility of the market and the economy. We undertook some very bold action in terms of a very rapid interest rate cut. This was at a time when the European central banks were raising interest rates because oil prices were rising throughout 2008. But our forecast was that demand was likely to go down significantly and that the rise in oil prices was just a temporary price shift not suggesting an underlying increase in inflation. And that is why we had interest rates very low during that time period while other central banks were raising interest rates.
Being the Chair of the committee on Supervision and Regulation of Banking Institutionsyou must have been in the room when a decision to let Lehman Brothers go bust would have been made. What was the atmosphere like?
So, there was no meeting where a go/no go was made. It was a series of processes. Remember we were dealing with independent investment banks having significant funding troubles and having great concerns about their ability to survive. And so we were exploring whether there could be merger partners for organisations like Merrill Lynch and Lehman Brothers. Bank of America decided to buy Merrill Lynch. There were others who were looking at Lehman Brothers and we thought that we would be finding a merger partner. But it then emerged over that weekend[the weekend of September 13-14, 2008] that a merger partner was not available for Lehman Brothers. The market had known that they were in trouble for a while. And Lehman Brothers had not been willing to merge with a number of other institutions that had proposed merger over the summer. Hence, it was in an effectively weak capital position. Its business model was imploding and so, the Fed was not able to do a capital infusion.
Why was that the case?
The Fed can only lend against good collateral to a solvent organisation. It was very difficult to make an assessment at that time. There was a merger partner avaialble for Merrill Lynch and Bank of America could provide capital infusion and support. Morgan Stanley and Goldman Sachs had sufficient capital and sufficiently functional business models, that we felt comfortable granting them bank charters on an emergency basis. But Lehman Brothers did not have that wherewithal.
But two days later Federal Reserve stepped into rescue AIG. How do you explain that?
Well remember that the Fed could lend against good collateral. The problematic part of AIG was the financial products subsidiary of the holding company. But AIG had other operations in many states and in many countries that were not associated with the challenges that were there in the financial products division. And also AIG had sufficient collateral to be able to post against the loan.
You are also a scholar of the Great Depression. What were the mistakes made during the Great Depression that haven’t been made during the period of what is now called the Great Recession?
As you know a number of us including Bernanke, myself and one of the other governors, were students of the Great Depression and had done work on it. Milton Friedman and Anna Scwartz’s in their magisterial book on the monetary history of the United States had said that depression of the late twenties and early thirties was turned into the Great Depression precisely because the Fed did not act. The Fed stood by as the money supply collapsed, and as deflation came in. The prices fell by a third, GDP fell by 30%, and unemployment went up to 20%, and there was no action.
And that was the lesson?
Yes. That was a very important lesson for those of us who had studied the Great Depression, to make sure that we did not make that mistake of inaction because the central bank can prevent deflation. Broadly, we certainly learned the lessons of the Great Depression at the Fed, to make sure that we didn’t make the same mistakes. We didn’t just sit ideally and allow the price level to fall significantly and allow the GDP to contract. Honestly, we were able to avoid a significant to recession. It is really something very different from what happened in the 1930s.
You also managed to avoid a deflation…
Deflation can be very destructive as we saw in the thirties. Even a mild deflation can be very problematic as we have seen over the last fifteen years in Japan. It was the strong commitment on the part those of us who studied the 1930s as supposed to the others, to make sure to not allow a state of inaction, where a central bank did not act as the lender of the last resort, which is actually what it was created to do. Further, central banks around the world have to be vigilant against the threat of deflation.
I
nternational financial crises is an area of your expertise. Why are economists unable to spot bubbles. Your colleague and Nobel laureate Eugene Fama has even gone to the extent of saying that “I don’t even know what a bubble means. These words have become popular. I don’t think they have any meaning.”
It is easy ex-post to say that aha that price did not make any sense or it was clear that price would be coming down. But when in you are real time it is very difficult to be able to tell whether there is some sort of dislocation of the market or a fundamental change. We had the same challenge after the Asian, Russian and the Latin American crisis in the 1990s. The World Bank, IMF and many economists looked for indicators, so called red flags, which you could look at and tell when the economy is is getting overheated. They tried to figure out which are the indicators that can tell us that credit growth is too fast, or that there is a “bubble” in a particular sector. Despite a lot of work by a lot of very smart people on the policy side and the academic side, we really haven’t come up with a simple set of indicators or any indicator where you can have confidence and say just look at x, y and z, and you know that there is some sort of dislocation here, that is going to be reversed.
In a recent interview you said that the Fed’s approach to communication has changed through the years. Could you elaborate on that?
The communication has become more complete and more transparent and also the words have changed over time. They are sometimes called forward guidance. They are sometimes called open mouth operations because its talking about what kind of purchases and sales that the open market operations are going to do. In my last meeting at the Federal Open Market Committee(FOMC) we brought interest rates to approximately zero and said that we would keep them there for an extended period of time. That gradually changed into a particular date, and Fed would describe dates like 2014/2015. That changed to a description of 6.5% unemployment threshold. And most recently the Fed has said that it would not be focusing on a particular unemployment threshold.
What is the aim here?
I think all of the statements are trying to get at the same thing. It’s different words in different circumstances, around the same idea about the desire of the Fed to provide liquidity support to monetary accommodation to make sure that the economy fully recovers before it decides to take the punchbowl away. In these uncharted waters, giving a little bit more guidance about what the Federal Reserve thinks about policy making and how is it going to react to data is helpful because the past behaviour may not be that useful because we haven’t had these kinds of circumstances before.
In a recent interview when you were asked that when do you think the time will come when the Federal Reserve will start to raise interest rates, you had replied “I do think it will come sometime in my lifetime”. Does that mean the era of low interest rates in the US is here to stay? That was a bit of flip comment. I hope you understand that it was not meant seriously. We have had low interest rates for five to six years now. There is a hope that the economy will be strong enough sometime in 2015, and rates will be able to go up. You can see from most recent FOMC documents all of the FOMC members believe that the interest rates will be higher by the end of 2015 than they are now. And that sounds to me as reasonable.
A lot of gold bulls have been thinking that some point gold should have some role in money making. Do you see gold ever having any kind of role in monetary policy in future?
It’s narrow to pull this in any particular commodity because then the value of the currency will rise and fall depending on the vagaries of the particular market. So, like a flood in a mine in South Africa will have a big impact. And that is like putting too many eggs into one basket. The least you would want is a broader commodity based basket that would be well diversified and would be able to withstand these kind of shocks. So certainly thinking about alternative benchmarks for units of account are worthwhile to do. But I wouldn’t want to put all of my eggs in one particular commodity basket, particularly a market like gold which is a very small one. Small shocks like a flood in a mine in South Africa could have a big impact on money supply. Hence, it doesn’t seem like a very stable system.
The near zero interest rates and the QEs have had a bigger impact on the assets markets than the credit markets and the real economy. Would you say it is building up some problem?
It is important that the Fed is aware about this and is looking into this. Jeremy Stein one of the governors of the Fed has been at the forefront trying to think about what indicators to look at, indicators that might raise red flags. Jeremy as well as his staff are thinking very carefully about that. Monitoring this very very closely is very important and I know that the Fed is. To be able to predict which markets will have a dislocation, it is impossible to do that. No one has that kind of foresight. But I do think there is much more focus on that today than there was in the past.
In another five six months it will be six years since the Lehman Brothers went bust. How long do you think the easy money policies will continue?
As Chairman of the Federal Reserve, Ben Bernanke had said, whatever it takes, a corollary of that is as long as it takes. We have had a slow recovery than anyone had hoped for and that has been true not only in the US but many other countries as well. Some countries like India and some emerging markets that had done very well in the late 2000s have seen a significant fall in growth more recently. As the FOMC and Janet Yellen have said they are now on a path of tapering. It is very important to draw the distinction between tapering and tightening. The Fed had made a commitment to buy $85 billion worth of additional assets every month and that added nearly $1 trillion to the balance sheet every year. And with tapering now it is going to reduce the pace of that increase. So, it is not a tightening it just reducing the pace of additional accommodation. The additional accommodation is likely to wind down by the fourth quarter of this year and then depending on economic conditions, around six to nine months after that, the Fed might actually begin the process of tightening. But this is sort of a very gentle lengthy process. This is not a sudden shift of policy.

The interview originally appeared in the Forbes India magazine dated Jun 27, 2014


Why corporates are not gung ho about investing in India

indian rupeesVivek Kaul  

Several senior functionaries of the UPA government have been confidently talking about the Indian economy returning to high rates of economic growth over the next few years. One of the major factors that needs to be set right for this is to happen is the falling level of corporate investment. 
In 2004-05(i.e the period between April 1, 2004 and March 31, 2005) this was at 10.3% of the gross domestic product (GDP). It rose to 17.3% in 2007-2008(i.e. The period between April 1, 2007 and March 31, 2008). 
Since then the number has been falling and should be currently around 10% of GDP or even lower, for that matter. This is reflected in the sanctions for fresh projects which have been fallen dramatically over the years. As
 an editorial in The Financial Express points out a recent study by Kotak Institutional Equities shows how sanctions for fresh projects have been tapering off from Rs 1,13,900 crore in Q1FY11 to Rs 74,900 crore in Q1FY12, Rs 41,300 crore in Q1FY13 and to just Rs 22,000 crore in Q1FY14.”
When the level of corporate investments fall, it has an immediate impact on the creation of urban jobs. As Chetan Ahya and Upasana Chachra of Morgan Stanley point out in a December 2, 2013 note titled 
India Economics: 2014 Outlook: A Year of Macro Adjustment “The steady decline in the ratio of investment to GDP has had a severe impact on urban job creation.” When enough jobs are not being created this has an impact on consumption and that in turn impacts economic growth. 
Given this, if the Indian economy has to go back to growing at high economic growth rates of 8% and higher, the level of corporate investments as a proportion of GDP need to go up. But that is easier said than done.
aSwanand Kelkar and Amay Hattangadi 
have a very interesting piece in the Mint today where they offer a major reason behind the slowdown in corporate investments. As they write “The Incremental Capital Output Ratio (ICOR)…measures the incremental amount of capital required to generate output or GDP. From FY2004 till FY2011, India’s ICOR hovered around the 4 mark, i.e. it required four units of investment to generate one unit of output. Over the last two years, this number has increased with the latest reading at 6.6 for FY2013.”
What this means in simple English is that the projects that corporates invest in are taking a longer period of time to be completed and start throwing up money. And this in turn is pushing down the return on the money that coprorates invest in fresh projects. In this scenario, any corporate will think twice before committing to a fresh investment. 
This scenario is likely to continue in the time to come. As Neelkanth Mishra and Ravi Shankar of Credit Suisse write in a research note titled 
India: 2014 Outlook dated December 2, 2013, “We expect the investment cycle to stay broken for the next two-three years: most types of large-scale investments with the exception of oil & gas have a depressed medium-term outlook. The order book for BHEL, the bellwether capital goods company, continues to decline, and the fact that new project announcements aren’t seeing any pick-up either would only worsen the situation going forward, in our view…The construction of national highways is unlikely to accelerate with most construction companies having weak balance sheets, and the last one-two years of contracts being so aggressively bid that they are having trouble raising loans.” 
For this cycle to be broken both inflation and interest rates need to come down. Inflation has had a huge impact on private consumption. “Moreover, persistent high consumer price inflation has only eroded the purchasing power of urban consumers, thus adding to the weakness in urban consumption. In addition, rural consumption growth is also moderating as real rural wage growth is decelerating. Slower growth in government spending will also in turn affect rural consumption growth adversely. Hence, we believe even private consumption growth remain slow in the next 6-12 months,” write Ahya and Chachra of Morgan Stanley.

Given this, consumer demand will continue to remain low. And in face of that fact, corporates in a large number of sectors aren’t likely to expand or announce fresh projects. 
High interest rates also discourage corporate investment. Interest rates have risen due to lower savings. “From FY2008 (i.e. the period between April 1, 2007 to March 21, 2008) to FY2013(i.e. the period between April 1, 2012 and March 31, 2013), the savings rate has fallen from 36.8% to 29.6%,” point out Kelkar and Hattangadi. Savings have fallen on account of people paying more for things, due to high inflation. 
What has also not helped is the fact that of the money saved a lot of money has been diverted into physical assets like gold and real estate, in the hope of earning a rate of return that manages to beat the prevailing inflation. “Persistently high consumer price inflation has kept real interest rates negative…encouraging households to reduce financial savings and increase allocation to gold and real estate. This is reflected in deposit growth, which has stayed weak relative to credit growth now for the last three and a half years, elevating the loan-deposit ratio near full capacity levels (76.5%currently),” write Ahya and Chachra.
And due to this the level of financial savings (or the money that people put into fixed deposits, small savings scheme, mutual funds, insurance etc) has come down dramatically. In 2007-2008 the number was at 11.63% of GDP. By 2011-2012 this had fallen to 8.02% of GDP. Currently, the number must be even lower.
If interest rates need to come down the amount of money going into physical savings needs to come down. As Ahya and Chachra point out “the central bank (i.e. the RBI) will also need to manage real rates in a way that incentivises households (savers) to increase their allocation towards financial saving (deposits) and away from gold.” 
The import duty on gold has been raised from 2% to 10% during the course of this year
. Over and above this a gold importer needs to re-export 20% of all the gold that he imports. This has led to gold imports falling dramatically to $3.9 billion during July to September 2013, down nearly 65% from the same period in 2012, when it had stood at $11.1 billion. 
While gold imports are falling, does that mean the demand for gold has been falling as well? News reports suggest that gold smuggling has gone up dramatically. 
A report in the Daily News and Analysis suggests that nearly 500 kgs of gold is being smuggled into India everyday., which means around 15 tonnes a month, and that is clearly a lot of gold. (To read a detailed analysis on this point, click here)
If this is correct, what this means is that Indians are still buying gold. And given that the level of financial savings is unlikely to go up in the near future. This means that interest rates will continue to remain high, making it unattractive for corporates to borrow fresh money to invest. 
What does not help is the fact the Indian corporates are already highly leveraged. In fact, debt to equity ratio of industrial companies was around 0.8 as of March, 2006, point out Mishra and Shankar. This mean that corporates had 80 paisa of debt for every rupee of equity. Since then it has gone up to around 2 i.e. corporates now have 2 rupees of debt for every rupee of equity. 
All these reasons make it difficult for India Inc to be gung ho about making fresh investments in the time to come.

The article originally appeared on www.firstpost.com on December 6, 2013 


(Vivek Kaul is a writer. He tweets @kaul_vivek)