Why Monsoon Still Matters So Much

monsoon

The stock market wallahs have been excited since April 12, 2016. On that day, the India Meteorological Department(IMD) came up with the forecast for the monsoon season rainfall for 2016. The forecast this time is that the monsoon rainfall during the period July to September 2016 will be 106% of the long period average (LPA), averaged over the country, with a model error of ± 5%. At 106%, this will be an above average monsoon.

The long period average over the country as a whole for the period 1951-2000 is 89 cm. So the question is how good have the IMD’s forecasts been over the last few years? The short answer is—not good.

In 2015, the IMD had forecast a rainfall of 93% of the long period average. The actual rainfall was 86% of the long period average. The actual result was outside the ± 5% model error that IMD works with. When the IMD forecast a rainfall of 93% of long period average, it was essentially forecasting a rainfall of anywhere between 88% and 98% of the long period average.

In 2014, the IMD had forecast a rainfall of 95% of the long term average. The actual rainfall was 88% of the long period average. This was also outside the model error of ± 5%. In 2013, the actual rain was 106% of the long term average, in comparison to a prediction of 98%. This was also outside the model error of ± 5%.

In 2012, the actual rain and the predicted rain were at 92% and 99% of the long period average. This prediction was also outside the model error of ± 5%.

In 2011, the actual rain and the predicted train were at 101% and 98%. This was within the model error of ± 5%. Hence, in the last five years, the IMD has got only one prediction right. This makes one wonder if the stock market wallahs have taken this bad record of IMD at predicting monsoons into account or not. Between April 11, 2016 and April 18, 2016, the BSE Sensex has gone up by around 3.2% in four trading sessions.

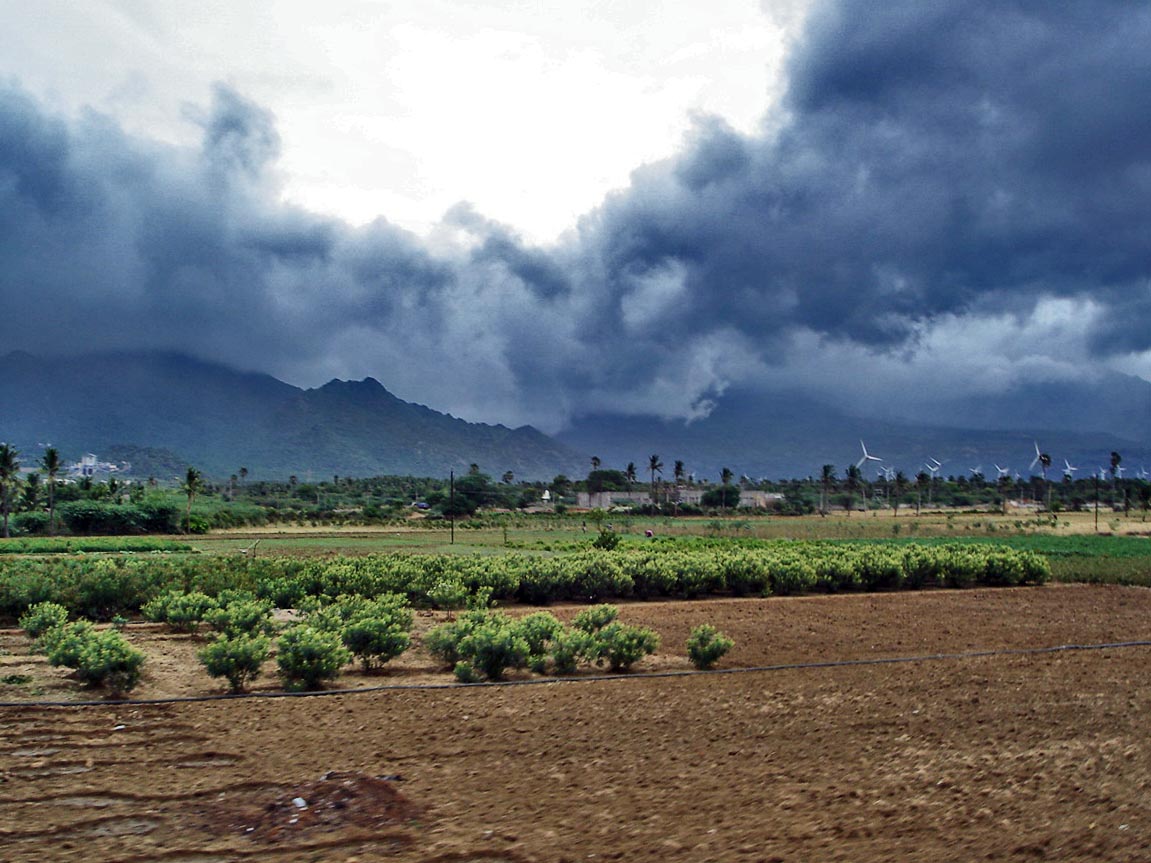
The tragic thing is that nearly 70 years after independence from the British in 1947, the country is still so highly dependent on the monsoon season. As Raghuram Rajan, the governor of the Reserve Bank of India, told the Wall Street Journal in a recent interview: “We’re looking for signs of a good monsoon. Unfortunately, India is still somewhat sensitive to monsoons.”

So why is India so dependent on the monsoon season? Data from World Bank suggests that in 2012, only 36.3% of India’s total agricultural land had access to irrigation. This number would have improved since then. Nevertheless, nearly 60% of India’s agricultural land still does not have access to irrigation.

Hence, for water, Indian agriculture is majorly dependent on the monsoon rains. In this scenario, it is important that monsoon rains arrive on time, are well spread over the season and across different parts of the country, which do not have access to irrigation systems.

Once there are adequate rains, the farmers will be able to grow a good crop and then sell it at a good price. (Of course, a good crop does not mean a good price, there are other issues at play as well. But we will leave that for some other day).

The money that they thus earn will be spent on consumer goods, two-wheelers and so on. This will benefit the companies that manufacture these things, along with those who supply the inputs to these companies and so the multiplier effect will work. For example, more two-wheeler sales mean more sales for tyre companies. More tyre sales mean more demand for rubber and so on. The same logic applies to other inputs that go into making a two-wheeler.

At least this is how the stock market wallahs are thinking. But there are a few caveats that need to be made here. First and foremost, as I said earlier in this column, IMD forecasts more often than not have turned out to be wrong in the last few years. But given that they have made a forecast of 106%, unless they go majorly wrong, the rains this year will be better than the last two years. Second, a good crop need not necessarily mean a good price for the farmer. The agricultural markets around the country still don’t function like they should and benefit the trader community more than the farmers.

Third, the agricultural crop that will benefit from the monsoon rains (i.e. the kharif crop) will start hitting the market only in October 2016. Hence, the fillip to consumption (if any) will start happening only around then i.e. in the second half of this financial year.

Over and above this, there is another important point that needs to be made here. Data from the World Bank tells us that in 2014, India’s population was 129.5 crore. The population growth rate in 2014 was at 1.2%. Assuming that the population in 2015 grew at the same rate, the population for 2015 comes in at around 131 crore.

Data from World Bank shows that 50% of India’s population depends on agriculture. Hence around 65.5 crore out of the 131 crore are still dependent on agriculture. Data from the Central Statistics Office(CSO) shows that in 2015-2016, the total contribution of agriculture, forest and fishing to the gross domestic product (at current prices) was Rs 2,082,692 crore.

Hence, the per capita income of every individual dependent on agriculture, forest and fishing, works out to around Rs 31,797 (Rs 2,082,692 crore divided by 65.5 crore).

Now how do things look for the other half which is not dependent on agriculture? Their total contribution to GDP was Rs 101,69,614 crore. Hence, their per capita income works out to Rs 1,55,261 (Rs 101,69,614 crore divided by 65.5 crore).

What these calculations tell us is that in 2015-2016, those not working in agriculture earned nearly 4.9 times those working in agriculture. If we were to use GDP at constant prices (at 2011-2012 prices), the ratio comes to 5.5. Constant prices essentially adjust for inflation.

And this huge differential in per capita income between those who work in agriculture and those who don’t, is India’s single biggest problem. (Of course since I am using averages here, a lot of other issues are getting side-lined, but the broader point remains valid nonetheless).

This also shows the tremendous amount of inequality present in the country between the haves and the have-nots.

Agriculture no longer yields enough to feed the number of people dependent on it. The only solution to this is to improve crop yields (i.e. more production per hectare), ensure that the farmers are able to sell this increased production through a proper market which works and finally, people need to be gradually moved out of agriculture into doing other things.

This is going to be a slow process because people dependent on agriculture simply do not have the required skillset to be moved to do other things, in most cases. Until then we will simply be dependent on monsoon rains.

The column originally appeared in Vivek Kaul’s Diary on April 19, 2016
The economic growth of 7.4% needs to be taken with a pinch of salt

discount-10
The ministry of statistics and programme implementation published the gross domestic product (GDP) data for India for the period July and September 2015, a couple of days back. The GDP, a measure of the size of the economy, grew by 7.4% during the period in comparison to the same period in 2014.

If we just look at this number then we have to conclude that the Indian economy is doing fabulously well. But other economic data clearly suggests otherwise.

The exports have been going down for the last 11 months.

The corporate earnings for the three months ending September 2015 saw a growth of less than 1%.

The real estate sector is down in the dumps.

The loan growth of banks has been in single digits for some time now.

The bad loans of banks continue to grow.

Two wheeler and tractor sales, a reflection of rural demand, fell during the first six months of the year.

The vehicle sales, a good reflection of urban demand, grew at a very low rate during the first six months of the year.

The number of stalled industrial projects continue to grow.

The factories are running 30% below capacity.

And India has seen two deficient monsoons in a row.

So how is the economy still growing at 7.4%? The answer might very well lie in the way the GDP growth is calculated. The 7.4% economic growth that we are talking about here and which the economists, politicians and regulators also talk about, is essentially the real GDP growth. The real GDP growth is obtained by subtracting inflation from nominal GDP growth.

For example, if the nominal GDP growth is 11% and the inflation is 4%, then the real GDP growth is 7%, to put it in a very simple way. This is essentially done to ensure that the GDP numbers across different periods of time are comparable, by removing the inflation component from the growth numbers.

The inflation number used in this case is referred to as the GDP deflator and it deflates the nominal GDP growth to the real GDP growth. As the Chief Economic Adviser Arvind Subramanian said in a recent interview to a television channel: “They actually only measure the wholesale and consumer prices, the GDP deflator is just constructed.” The GDP deflator typically falls between the inflation measured by the wholesale price index and inflation as measured by the consumer price index. Also, given that it is a combination of both the consumer price index and the wholesale price index, it is the most broad based measure of inflation.

During the period July to September 2015, the nominal growth came in at 6%. The GDP deflator on the other hand was at − 1.4%. This was primarily because inflation as measured by the wholesale price index number has been in negative territory for a while now. For the months of July, August and September, it stood at −4.05%, −4.95% and −4.54%, respectively.

The consumer price inflation on the other hand stood at 3.78%, 3.66% and 4.41%, respectively. Given that, the GDP deflator falls somewhere in between the inflation as measured by the consumer price index and the inflation as measured by the wholesale price index, it was at −1.4%.

Real GDP as explained earlier is obtained by subtraction the GDP deflator from the nominal GDP. And this led to a real GDP growth of 7.4% (6% − (−1.4%). Given that the GDP deflator was in negative territory, instead of deflating the nominal GDP number, it has ended up inflating it. And this explains how an economic growth rate of 7.4% has been arrived at.

The question that crops up here is why has inflation as measured by the wholesale price index been in the negative territory? One reason for this has been a fall in commodity prices, which has benefited the Indian economy. India is a huge importer of commodities like oil. On the flip side, a fall in exports, stagnant consumer and industrial demand, low private investment, etc., are also reasons of falling inflation as measured by the wholesale price index.

Over and above this, the Reserve Bank of India governor, Raghuram Rajan recently talked about the capacity utilisation of the factories being at 70%. This has been falling from levels of over 75% in January to March 2013. This suggests a significant slack in the economy. And it means that businesses really do not have pricing power. This is reflected in the more or less flat corporate earnings.

All these reasons have led to a negative inflation number as measured by the wholesale price index. This negative number has led to a negative GDP deflator and that in turn has led to an inflated real GDP number.

In simple English many economic factors which are negative for the economy have ultimately ended up becoming positive for the real GDP number. That’s the long and short of it and perhaps explains why the economy is “supposedly” growing by 7.4%, even though all real economic indicators suggests otherwise.

Further, economists Pranjul Bhandari and Prithviraj Srinivas economists at HSBC Securities and Capital Markets India, have raised some doubt regarding the reliability of the GDP deflator. As they write in a research note: “Nominal GDP…grew at a much slower clip than real GDP…implying that deflators have fallen sharply into the negative territory. Parsing through details throws up more questions than answers. We find that growth in services deflator, which is infamous for high and sticky prices, was actually running below the industry deflator. This is odd because manufacturing and industry at large should be the prime beneficiaries of falling commodity prices and as such should run below services (which is largely non-tradable) inflation.”

What they mean here is that the inflation in services was higher than inflation in manufacturing. This seems odd given that manufacturing should have benefited more because of falling commodity prices.

Due to this anomaly the HSBC economists suggest that the “real growth is lower than the headline reading suggests.”

The column originally appeared on The Daily Reckoning on Dec 2, 2015


11 reasons why India growing at 7.4% is simply not believable

rupee

Data released by the ministry of statistics and programme implementation shows that India’s gross domestic product (GDP), a measure of the size of the economy, grew by 7.4% during the period between July to September 2015. These are fantastic numbers in a world where real economic growth is slowing down. Even China is finding it tough to grow at rates that it did in the past.

So what is driving India’s economy? Manufacturing grew by a 9.3%. Trade, hotel, transport, communication & services related to broadcasting grew by 10.6%.

And financial, insurance, real estate and professional services grew by 9.7%. These three segments which formed 62.6% of the total economy between July to September 2014, helped the economy grow by 7.4%. Agricultural, forestry and fishing grew by just 2.2%.

The question is how believable is this growth of 7.4%? The short answer is—not very. It is worth mentioning here that GDP is ultimately a theoretical construct.

Most real economic numbers suggest otherwise.

Let’s take a look at them one by one.

1) Exports have been falling eleven months in a row. In fact, between April and October 2015, exports have fallen by 17.6% to $154.29 billion, in comparison to the same period last year. Between April and October 2014, the exports had stood at $187.29 billion. A greater than 7% economic growth rate with falling exports is a little difficult to believe.

2) Corporate profitability continues to remain subdued. As a recent news-report in the Business Standard points out regarding the profitability for the period July to September 2015: “It was another muted quarter for India Inc, with aggregate profit growth at both the operating and net level growing at only under one per cent over a year-ago period. The sample is of 2,300 companies…The numbers are worse for the benchmark indices such as the Nifty, where operating and net profit are down between three-five per cent over the year-ago quarter, with aggregate numbers below expectations.”

3) Passenger vehicles sales, another good measure of economic recovery, have been subdued through most of this financial year, though there has been some recovery in October 2015, which doesn’t come under the July to September 2015 period, for which the economic growth number has been reported. Between September 2015 and September 2014, passenger vehicles sales went up by only 3.85%.

4) Motorcycle sales, a very good economic indicator in the Indian context, have fallen for most of the financial year, only to have recovered a little in October due to festival season sales. It remains to be seen whether the sales can be sustained for November 2015. Data from the Society of Indian Automobile Manufacturers (Siam) points out that motorcycle sales during the first six months of the year (April to September 2015) were down by 4.06% to 5.36 million units, in comparison to the same period last year.

5) Tractor sales have been falling for thirteen months in a row. Data from the Tractor Manufacturers Association shows that sales have fallen by 20% during the first six months of this financial year (i.e. April to September 2015). This is a clear example of weak agricultural growth.

6) The loan growth of banks continues to remain subdued. The sectoral deployment of credit data released by the Reserve Bank of India (RBI) shows that bank loans grew by 8.4% between September 2014 and September 2015. In fact, they grew by an even slower 8.1% between October 2014 and October 2015.

7) Along with this, the bad loans of banks continue to pile up. As a recent report in The Indian Express points out: “Already burdened by bad loans, 37 banks, led by public sector ones, have reported a 26.8 per cent rise in non-performing assets (NPAs) over the 12-month period ending September this year.”
The overall non-performing assets of banks as of September 2015 stood at Rs 3,36,685 crore. This was an increase of Rs 71,000 crore, according to numbers put together by credit rating firm CARE.

8) The number of stalled industrial projects went up during the period July to September 2015. As a recent research note by Morgan Stanley points out: “The stock of stalled projects climbed in the September quarter, while existing capacity is being underutilized. This has, not surprisingly, lowered interest in greenfield investments, with industrial credit loan growth stagnating in single-digits.” The bulk of the stalled projects belong to the manufacturing and infrastructure sectors. Further, there is a good anecdotal evidence to suggest that small and medium enterprises, a major source of job growth, continue to struggle.

9) The Reserve Bank of India governor Raghuram Rajan recently pointed out that factories were running 30% below capacity as of now. A research report by DBS points out that the capacity utilisation rate was at 80% in 2011-2012. This suggests a significant slack in the economy. How is manufacturing then growing by 9%, as suggested by the data released by the ministry of statistics and programme implementation?

10) The real estate sector, a major employer of people, continues to be in the doldrums, with new launches coming down and the number of unsold homes going up.

11) Further, for two years in a row India has had a deficient monsoon. In its end of season report, the India Meteorological Department (IMD), the nation’s weather forecaster, stated that rainfall over the country as a whole was 86% of its long period average (LPA). Thus years 2014 & 2015 was the fourth case of two consecutive all India deficient monsoon years during the last 115 years.”

IMD uses rainfall data for the last 50 years to come up with the long period average. If the rainfall is between 96% and 104% of the 50 year average, then it is categorised as normal. If it is between 90% and 96% of the 50 year average is categorised as below-normal. And anything below 90% is categorised as deficient.

If something has happened only four times in 115 years, there is clearly reason to worry, given that nearly half of India’s population is dependent on agriculture. Also, this has clearly slowed down consumer demand in much of rural India.

On the positive side a lot has been written on the 36% jump in indirect tax collections. This has been offered as an example of a revival in economic activity.

Nevertheless, much of this huge jump has come from the government increasing the excise duty on petrol and diesel and capturing much of the fall in oil prices. Excise duty collections have jumped by 68.6% during the course of this financial year.

In fact as a recent ministry of finance press release points out: “These collections reflect in part increase due to additional measures taken by the Government from time to time, including the excise increases on diesel and petrol, the increase in clean energy cess, the withdrawal of exemptions for motor vehicles, capital goods and consumer durables, and from June 2015, the increase in Service Tax rates from 12.36% to 14%. However, stripped of all these additional measures, indirect tax collections increased by 11.6% during April-October 2015 as compared to April-October 2014.”

As the Chief Economic Adviser Arvind Subramanian recently said in an interview: “Even if you take away all the new things, new taxes have been added, that number[indirect taxes number] is growing at a robust about 11.5 -12% and if that number is right, that means that the underlined economy is recovering.”

There are few other data points on the positive side. The commercial vehicle sales have been robust during the first six months of the financial year. At the same time consumption of petroleum products has also gone up by 8.5% between April and Septmber 2015.

While the underlying economy might be recovering, it is very difficult to believe that it is growing at 7.4%. In fact, Subramanian and Rajan suggested the same in a very roundabout sort of way in a recent joint interview to a television channel.

To conclude, once you take all the factors I have listed above into account, the economic growth (or GDP growth) number of 7.4%, doesn’t look believable at all.

(Vivek Kaul is the author of the Easy Money trilogy. He tweets @kaul_vivek)

(The column was originally published on Firstpost on December 1, 2015)

Mr Chidambaram, please don’t fudge data to say that Manmohan was better than Modi

Former finance minister P Chidambaram did a smart thing before the last Lok Sabha elections—he decided not to contest. His son Karti Chidambaram contested instead of him, in the Sivaganga constituency in Tamil Nadu. The junior Chidambaram got around 1.04 lakh votes in a five cornered contest and lost his deposit, having not managed to secure more than one-sixth of the votes polled.

Unlike other Congress leaders, the senior Chidambaram has managed to keep himself partly busy, by writing a Sunday column for The Indian Express. In this column, the former finance minister, tries to tell us every week how the ten year rule of the Congress led United Progressive Alliance (UPA) had been good for the country and how the economy has been in trouble since the Narendra Modi government took over.

The latest column is along similar lines. In this column Chidambaram tries telling us that the Congress led UPA government had left the country in a good shape and the Narendra Modi government has screwed up things, since taking over in May last year.

As Chidambaram writes: “Let us look at the hard data that would be relevant to ‘development’ and ‘jobs’. There are more red lights than green. Yet the GDP(Gross Domestic Product) is estimated to have grown at 7.4 per cent in 2014-15, although the RBI has warned of a downward revision.”

Long story short—Chidambaram seems to believe that the GDP may not have grown by 7.4% between April 1, 2014 and March 31, 2015. And honestly, he may be right about it.

The ministry of statistics and programme implementation released the Gross Domestic Product(GDP) number for 2014-2015 on February 9, 2015. A new method was used to calculate the GDP and as per this method, the GDP growth in the financial year 2014-2015 would come in at 7.4%. This was significantly higher than the 5.5% growth that had been forecast by the Reserve Bank of India, earlier.

The trouble is that the real numbers don’t show this economic growth. Car sales grew by a minuscule 3.9% in 2014-2015. Exports contracted by 1.23%. The total indirect tax collections at Rs 5,46,479 crore were 12.5% lower than the original target of Rs 6,24,902 crore. When it comes lending by banks, it grew by 8.6% between March 21, 2014 and March 20, 2015. In comparison, it had grown by 14% between March 22, 2013 and March 21, 2014.

The Economic Survey released by the ministry of finance today towards the end of February 2015 stated: “The stock of stalled projects at the end of December 2014 stood at Rs 8.8 lakh crore or 7 per cent of GDP.” Further, corporate profitability was dull as well in the latter half of the financial year (October 2014 to March 2015).

It is worth remembering that the numbers highlighted above are real numbers, unlike the GDP which is a theoretical construct. The real numbers make it difficult to believe that the economy grew by 7.4% in 2014-2015. And given that Chidambaram is right in saying what he has in his column. Or so it seems.

The interesting bit comes next, where Chidambaram writes: “I predicted that the economy will revive in 2013-14. It did, and when the UPA passed on the baton to the NDA in May 2014, the GDP had recorded a growth rate of 6.9 per cent in 2013-14.”

So, Chidambaram is basically saying that in 2013-2014, when the Congress led UPA government was in power, all was well. The economy grew by 6.9% and the Congress led UPA passed on a healthy economy to the Narendra Modi government.

Now what is wrong with this argument? Several things. First, you don’t need a PhD in Economics (or an MBA from Harvard, which Chidambaram has), to tell you that 7.4% economic growth (which happened in 2014-2015) is higher than the 6.9% economic growth (which happened in 2013-2014).

Secondly, what Chidambaram does not tell us is that the 6.9% number is also a revised number, which has been calculated as per the new GDP method released by the ministry of statistics and programme implementation. The economic growth as per the old method had been at 5%.

So the point is that Chidambaram does not believe the 7.4% economic growth number as per the new model. But he believes the 6.9% economic growth number which is also as per the new model. And therein lies his double standard.

If he believes in the 6.9% number then he has to believe in the 7.4% number as well because the method involved in calculating them is the same. And that being the case, 7.4% is higher than 6.9%.

(Vivek Kaul is the author of the Easy Money trilogy. He tweets @kaul_vivek)

The column originally appeared on Firstpost on May 25, 2015   

What do the new GDP numbers mean for the govt?

keynes_395
When the facts change, I change my mind. What do you do, sir?”Attributed to John Maynard Keynes.

The Controller General of Accounts releases fiscal deficit numbers towards the end of every month. The latest set of numbers released late last week show that the fiscal deficit for the first nine months of the financial year between April to December 2014 was at 100.2% of its annual target.
The fiscal deficit target for the current financial year is Rs 5,31,177 crore. The government ran a fiscal deficit of Rs 5,32,381 crore or 100.2% of the targeted fiscal deficit during the first nine months of the financial year. Fiscal deficit is the difference between what a government earns and what it spends.
In my columns so far I have remained sceptical on the ability of the government to meet its fiscal deficit target, given that the growth in its tax collections has been way off the mark than what it had assumed when it had presented the budget. But this might change in the days to come.
The reason for this is very simple—the fiscal deficit target that needs to be achieved is always expressed as a certain proportion of the gross domestic product(GDP) of the country. The GDP is a measure of all the goods and services produced in a country. It essentially tells how big the economy of a country is.
The GDP can be measured in multiple ways. As Diane Coyle writes in
GDP—A Brief But Affectionate History: “You can add up all the output of the economy, all the expenditure in the economy, or all the incomes.” Theoretically these numbers should match. But they never do given the discrepancies that creep in at the time of collection of data. In this column we will discuss things from the point of view of output of the various sectors in the economy.
The finance minister Arun Jaitley had set an absolute fiscal deficit target of Rs 5,31,177 crore when he presented the budget in July 2014. This was essentially 4.1% of the projected GDP of Rs 12,876,653 crore in 2014-2015.
If the projected GDP goes up, the fiscal deficit as a proportion of the GDP automatically starts to come down. Essentially this is what will happen.
Last week, the ministry of statistics and programme implementation
released a new methodology to measure GDP. It changed the base year for measuring GDP from 2004-2005 to 2011-2012. The structure of the economy keeps changing. Hence, the GDP calculations also need to keep pace with this change. Over and above that the data that the government has access to keeps improving over the years, and this also needs to be incorporated in the way the GDP is calculated.
As Crisil Research points out in a research note released on February 2, 2015: “This base revision incorporates the changing structure of the economy, especially rural India. The revised series for GDP…in addition to change in some estimation methods, now also incorporate information from new datasets, in particular, Census 2011, annual account of companies as filed with Ministry of Corporate Affairs (MCA), NSS Unincorporated Enterprise Survey (2010-11), NSS Employment-Unemployment Survey (2011-12), Agriculture Census (2010-11) and Livestock Census (2012), NSS All India Debt and Investment Survey (2013) and NSS Consumer Expenditure Survey (2011-12).”
This new GDP data essentially suggests that the Indian economy grew by 4.9% during 2012-13, and 6.6% during 2013-14. The earlier calculations had suggested that the Indian economy grew by 4.5% in 2012-2013 and 4.7% in 2013-2014.
While, there is not much difference in GDP growth in 2012-2013, between the new method and the old method, the difference in GDP growth in 2013-2014 is significant. One possible explanation for this lies in the fact that as per the new method of measuring GDP, the manufacturing sector grew by 5.3% in 2013-2014, whereas it had contracted by 0.7% as per the earlier method. A similar sort of dynamic seems to have played out with mining and quarrying sector as well. As per the old method the sector contracted by 1.4% in 2013-2014, whereas as per the new method the sector actually grew by 5.4%.
Also, trade, hotels, transport and communication grew by 3% as per the old method of measuring GDP. In the new method trade, repair, hotels and restaurants grew by 13.3%. Further, transport, storage, communication & services related to broadcasting grew by 7.3%.
The comparison does give us a drift of why the GDP growth was higher in 2013-2014 as per the new method. Nevertheless there are doubts being raised about this jump in growth from 4.7% to 6.6% in 2013-2014. The Chief Economic Adviser to the ministry of finance
Arvind Subramanian told Business Standard in an interview that: “India is perhaps unique in that GDP revisions result in lower numbers rather than the typically high upward revisions…The key 2011-12 estimate of GDP is actually two per cent lower than previously estimated.” Given that, the 2011-2012 GDP is down by 2%, the growth in the latter years has been faster.
Further, it needs to be remebered that 2013-2014 was a crisis year for the Indian economy where external capital flowed out of India and interest rates had to be jacked up. Imports also fell. As Subramanian put it: “Import of goods apparently declined 10 per cent; this, even after accounting for the squeeze on gold imports, is high. Typically, growth booms are accompanied by surges in import, not declines.” At the same time inflation was very high slowding down consumption. So, the other data goes against this upward revision in the GDP number for 2013-2014.
Further, what does this change mean for the current financial year’s fiscal deficit? The GDP numbers for 2014-2015 calculated as per the new method will be released on February 9, 2015. Subramanian feels that there won’t be much of a difference if the projected GDP growth as per the new method remains the same as is being currently expected. While we will have to wait for the actual numbers to come out, nevertheless if the GDP growth turns out to be faster than the 5.5% growth that had been calculated as per the old method, the denominator in the fiscal deficit to GDP ratio will actually go up and thus push down the ratio.
This will be good news for the government which is struggling to meet its fiscal deficit target. In fact, this change in methodology may also give the government a little more leaway to arrive at the fiscal deficit number for the next financial year, allowing it to spend more. The question though is whether the financial market will start believing in India’s new GDP numbers? That remains to be seen.
(The column originally appeared on www.equitymaster.com as a part of The Daily Reckoning on February 3, 2015)