Game theory in the stock market: On the Island of the Green-Eyed Tribe, blue eyes are taboo

green eyed cat
In response to
yesterday’s piece a friend pointed out that John Maynard Keynes’ “stock market as a beauty contest” parable is an example of common knowledge game in modern game theory. Game theory is essentially a study of strategic decision making.
Hearing his comment I almost fell from my chair. “
Ab game theory bhi padhna padega?” I wondered. But as good friends usually do, my friend mailed across some excellent reference material. (You can read the two pieces by Ben Hunt who writes the Epsilon Theory newsletter here and here).
In this piece I have summarized the two pieces written by Ben Hunt and tried to explain how the stock market is currently working from a game theory point of view and what are the learnings that we can draw from it.
First we need to understand what a common knowledge game is. In order to understand that we will go through the example of the island of the green eyed tribe. On this island people have eyes that are green in colour. Anyone having blue eyes, is supposed to leave the island in a canoe at dawn, the morning after he has found out.
However there are two problems. There are no mirrors on the island. So no one knows what is the colour of their eyes. Further, residents are not allowed to tell each other what is the colour of their eyes. So, if Ajay knows that the colour of Vijay’s eye is blue, he is not allowed to tell Vijay about it.
To summarise, the island of the green eyed tribe is a small island. Given this, every resident knows the eye colour of everyone else who lives on the island, but himself.
In a normal scenario, if the island has residents with blue eyes, they could continue to live on the island. This happens because they themselves do not know they have blue eyes and no one else can tell them about it.
Now let’s say a missionary lands up on the island and declares that at least one resident of the island has blue eyes. Further, let’s say only one resident on the island has blue eyes. So what will happen in this case? This individual, let’s call him Ajay, knows that everyone else has green eyes, so he comes to the conclusion that he must be the one with blue eyes. Hence, next morning he gets into a canoe and leaves the island.
Simple!
Now let’s complicate the situation a little more. Let’s say two residents, Ajay and Vijay, have blue eyes. What do you think will happen here? Ajay and Vijay have seen each other and each thinks that the other has blue eyes. They themselves do not know that they have blue eyes. Hence, Ajay thinks that Vijay will leave the island on a canoe the next morning and vice versa.
Next morning, neither Ajay nor Vijay has left the island. This leaves both Ajay and Vijay confused. But they soon figure out the situation. Ajay thinks that Vijay hasn’t left the island because he has seen someone else with blue eyes. At the same time Ajay knows that everyone else other than Vijay has green eyes. Hence, that leaves only him with blue eyes.
Vijay also realises the same thing. The next morning both Ajay and Vijay leave the island. As Ben Hunt writes in an excellent newsletter titled
A Game of Sentiment and dated November 3, 2013, “The generalized answer to the question of “what happens?” is that for any n tribe members with blue eyes, they all leave simultaneously on the nth morning after the Missionary’s statement.”
But that is something for economists who carry out game theory experiments to ponder on. What is the learning here for stock market investors? Before the missionary lands up on the island every resident of the island knows the colour of the eyes of every other resident on the island. But this is private information which is locked up in the minds of the residents.
The missionary comes and changes this situation. He does not turn the information locked up in the minds of residents into public information, meaning he doesn’t tell them loud and clear that Ajay and Vijay are the ones with blue eyes.
Nevertheless, he turns what is private information until then into common knowledge. And common knowledge is different from public information.
As Hunt writes in a newsletter titled
When Does the Story Break and dated May 25, 2014, “Common knowledge is simply information, public or private, that everyone believes is shared by everyone else. It’s the crowd of tribesmen looking around and seeing that the entire crowd heard the Missionary that unlocks the private information in their heads and turns it into common knowledge. This is the power of the crowd watching the crowd, and for my money it’s the most potent behavioral force in human society.”
Further, it takes time for the residents of the island to realize what they know. It doesn’t happen immediately. As Hunt writes “The truth is that an enormous amount of 
mental calculations and changes are taking place within each and every tribesman’s head as soon as the common knowledge is created. The more tribesmen with blue eyes, the longer the game simmers. And the longer the game simmers the more everyone – blue-eyed or not – questions whether or not he has blue eyes.”
In the example of Ajay and Vijay, it took them a day to realize that both of them have blue eyes. And once they did, they left the island the next morning, i.e two days after the missionary made the statement.
If there had been three people with blue eyes, it would have taken them three days and so on. That is how the dynamic works. So Ajay is watching Vijay and thinking that Vijay has blue eyes and hence, needs to leave the island. A similar dynamic is playing up in Vijay’s mind as well about Ajay.
The next day Vijay hasn’t left the island and Ajay realizes that Vijay is thinking the same thing about him, as he is thinking about Vijay. And once they have figured out they leave the island. So, nothing happens for two days and then they leave the island. In case of three people with blue eyes, nothing happens for three days and then they leave the island.
The point being it takes time for common knowledge to seep through and then there is immediate action.
If all that has left you wondering what all this has got to do with the stock market, allow me to explain. “If you haven’t observed exactly this sort of dynamic taking place in markets over the past five years, with nothing, nothing, nothing despite what seems like lots of relevant news, and then – boom! – a big move up or down as if out of nowhere – I just don’t know what to say. And I don’t know a single market participant, no matter how successful, who’s not bone-tired from all the mental anguish involved with trying to navigate these unfamiliar waters,” writes Hunt.
In the Indian context, the Sensex was yo-yoying over the last few years but has made a definitive move in 2014, with gains of nearly 33%. “And then boom,” is the best way to describe this move. That’s the power of the “crowd watching the crowd” for a while and then suddenly deciding to invest because the “common knowledge” of they thinking that everyone else is investing, seeps through.
That’s one part. The other part here is that of the “missionary” and the message he is sending out. The message will be believed depending on how credible the missionary is viewed to be and how loud is his voice. In the media this loudness and credibility is established by being seen at the right place. And that’s how the message is amplified.
As Hunt writes in
A Game of SentimentHow do we “see” a crowd in financial markets? Through the financial media outlets that are ubiquitous throughout every professional investment operation in the world – the Wall Street Journal, the Financial Times, CNBC, and Bloomberg. That’s it. These are the only four signal transmission and mediation channels that matter from a financial market CK (common knowledge) game perspective because “everyone knows” that we all subscribe to these four channels. If a signal appears prominently in any one of these media outlets (and if it appears prominently in one, it becomes “news” and will appear in all), then every professional investor in the world automatically assumes that every other professional investor in the world heard the signal.”
And this has an impact on the financial markets. In an Indian context one could add
The Economic Times to the list as well. Fund managers want to be featured in these publications because it increases their ability to influence the financial markets. The stories they want to tell people about explaining the various reasons behind what is an “easy money” driven bull market are more likely to be believed.
The big missionaries in the current scenario are the central banks. What they say is closely watched.  
As Gary Dorsch, Editor, Global Money Trends newsletter, wrote in a recent column “Bad economic news is treated as bullish news for the stock market, because it lead to expectation of more “quantitative easing.” And the easy money flows that are injected by central banks go right past goods and services (ie; the real economy) and are whisked into the financial markets, where it pushes up the prices of stocks and bonds. In simple terms, what matters most to the stock markets are the easy money injections from the central banks, and to a lesser extent, the profits of the companies whose stocks they are buying and selling.”
But that is something that fund managers are not very comfortable talking about.

This piece originally appeared on www.equitymaster.com on Nov 26, 2014
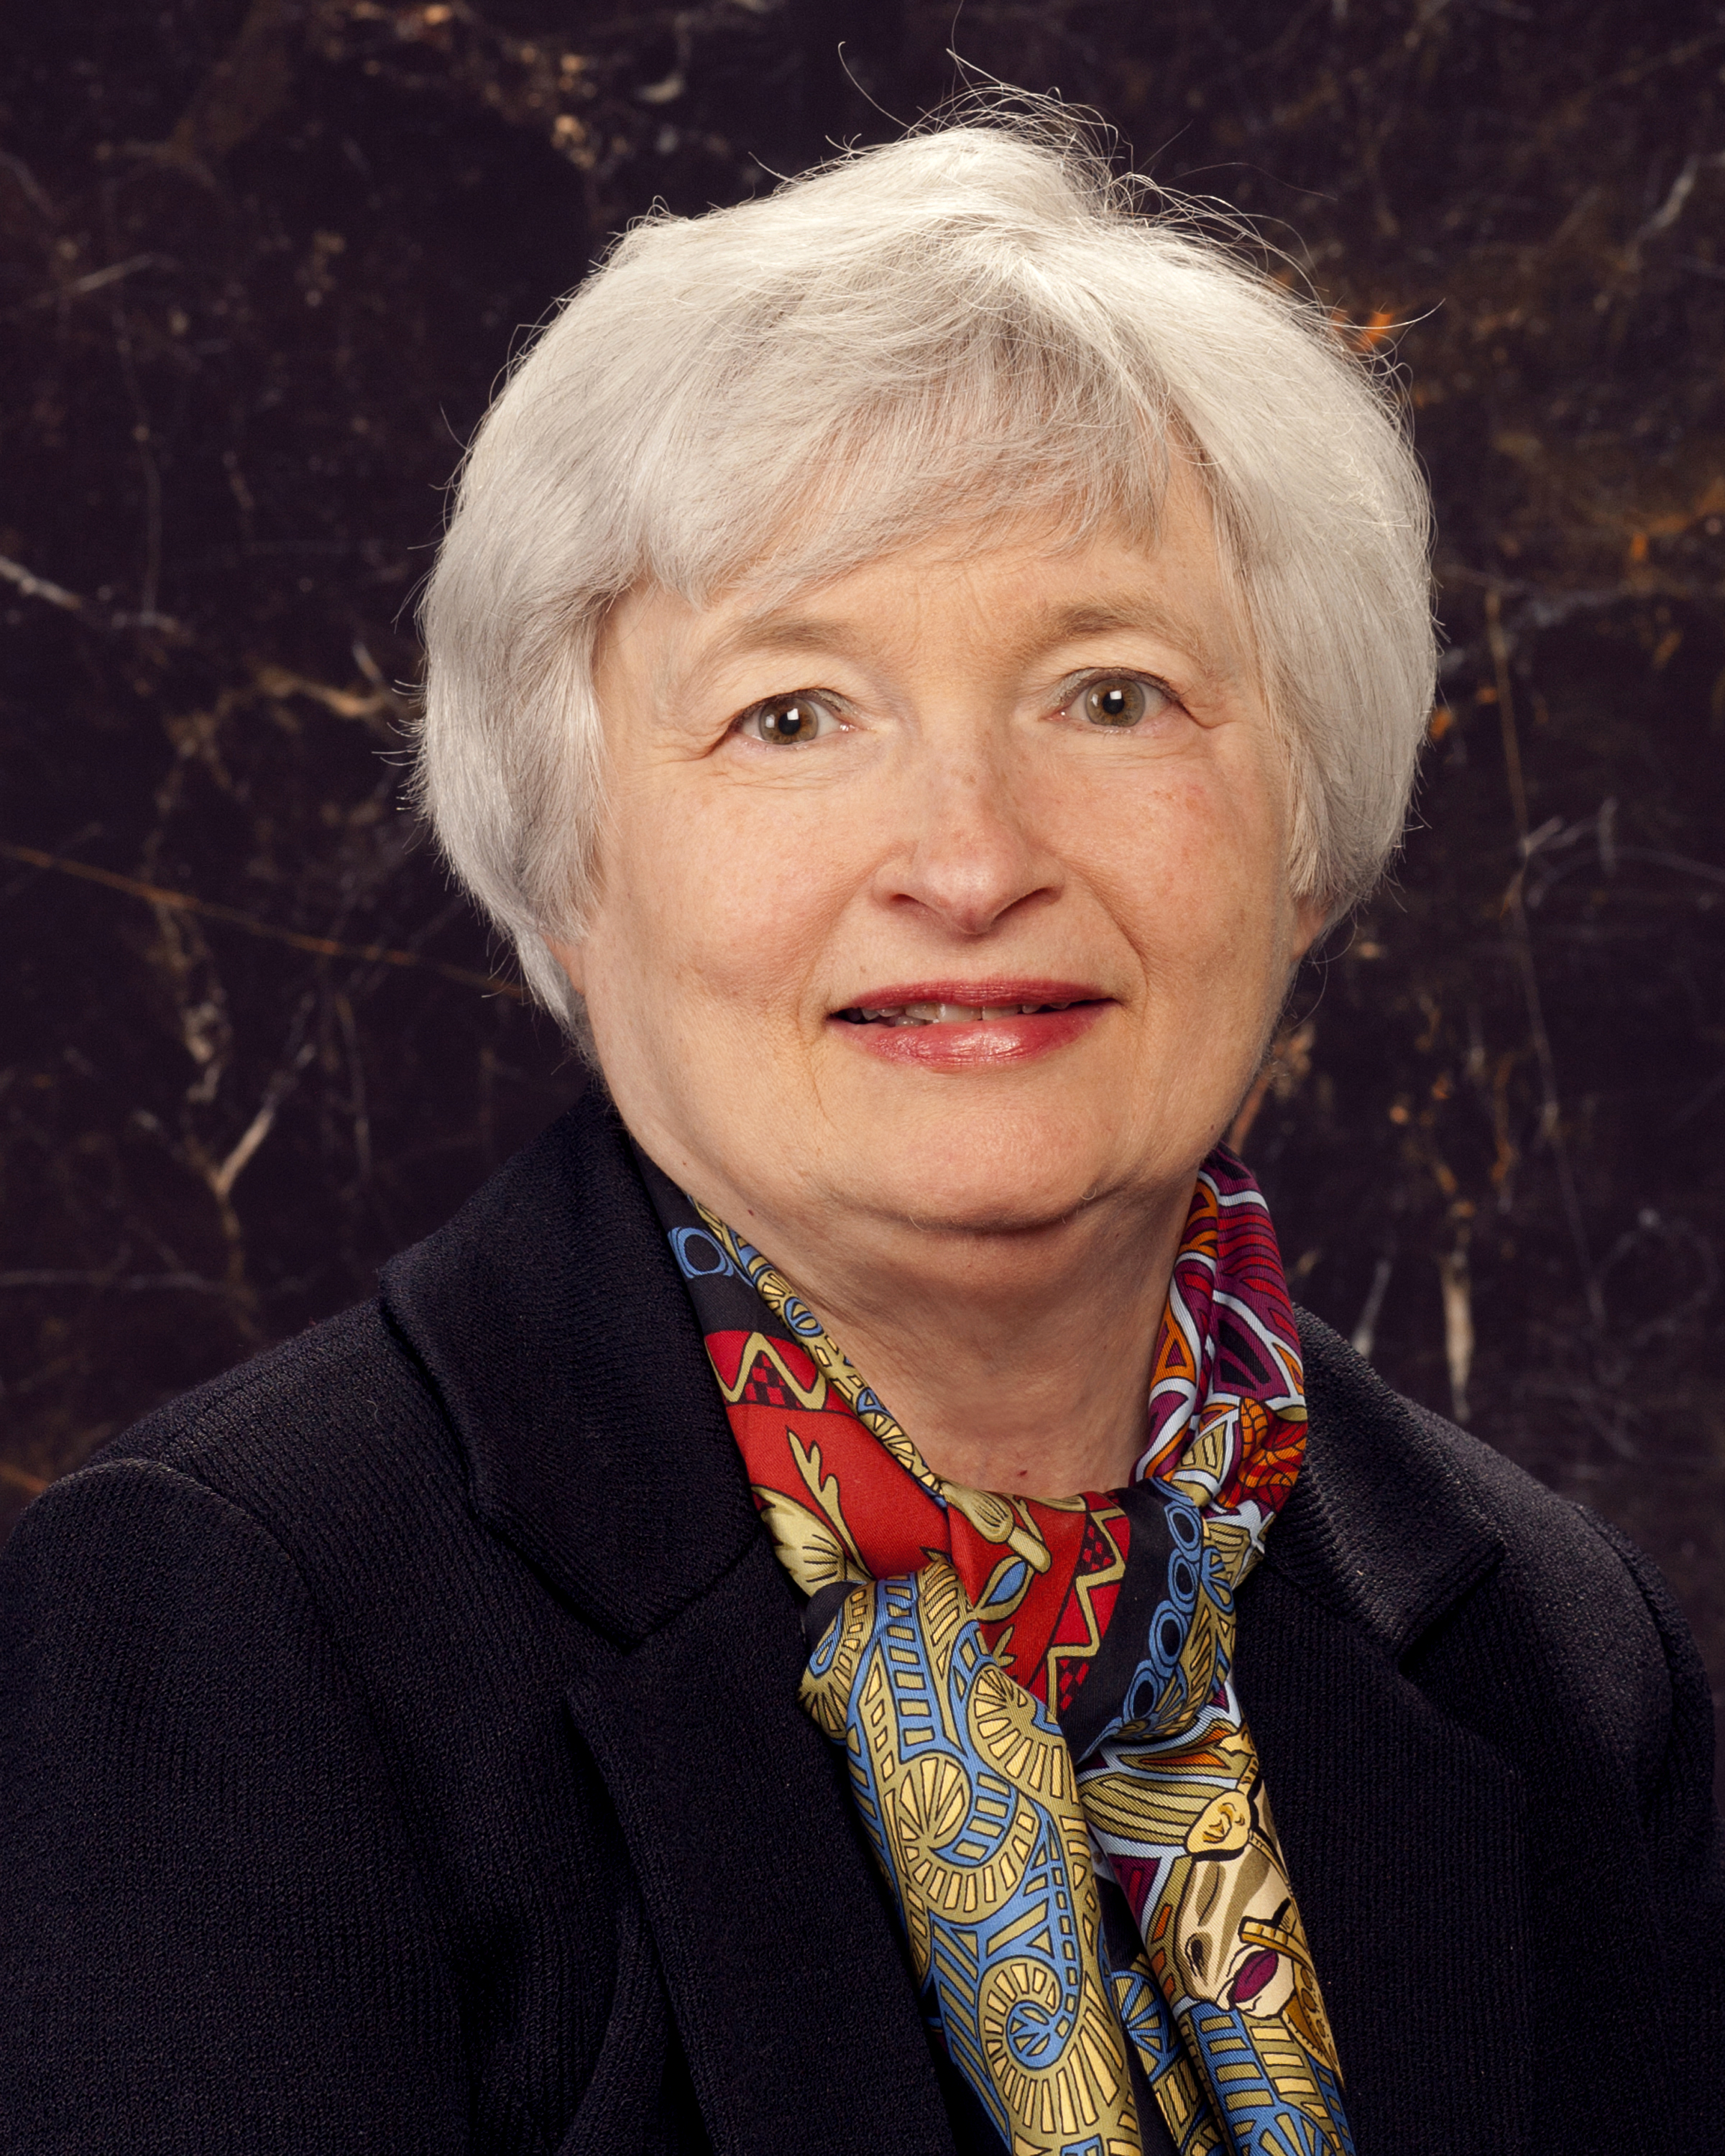
Central bankers are morons: Why bad economic news is treated as good news by stock market

yellen_janet_040512_8x10

Vivek Kaul


When it comes to investing in the stock market, there used to be two kinds of investors: those who invested on the basis of the fundamentals of a stock and and those who invested on the basis of non fundamentals.
Investors like Warren Buffett specialise in investing on the basis of fundamentals. These investors go through balance sheets, annual reports etc., in great detail, trying to figure out how well a company they want to invest in is doing in terms of sales, expenditure and profits.
On the other hand, the non fundamental investor most of the times is trying to do what John Maynard Keynes described best. John Lanchester writes about this “famous description” in his recent book
How to Speak Money” “He (i.e. the non fundamental investor) is looking at a photo of six girls and trying to pick, not which girl he thinks is the prettiest, and not which he thinks most people will think is the prettiest, but which most people will think most people will think is the prettiest…In other words the non-fundamentals investor isn’t trying to work out what companies he should invest in, or what company most investors will think they should invest in, but which company most investors will think most investors will want to invest in.”
Or as Keynes put it in his magnum opus
The General Theory of Employment, Interest and Money “It is not a case of choosing those [faces] that, to the best of one’s judgement, are really the prettiest, nor even those that average opinion genuinely thinks the prettiest. We have reached the third degree where we devote our intelligences to anticipating what average opinion expects the average opinion to be.”
And this is how the stock market investors were neatly divided with the majority of them trying to figure out “ what average opinion expected the average opinion to be”. This neat division was broken down in the aftermath of the current financial crisis which started in September 2008. The markets are now ruled by the central banks.
As Ben Hunt wrote in the Epsilon Theory investment letter dated August 5, 2014, and titled
Fear and Loathing on the Marketing Trail, 2014 “Today, everyone believes that market price levels are largely driven by monetary policy and that we are all being played by politicians and central bankers using their words for effect rather than direct communication.”
Monetary policy is essentially the process by which a central bank controls the amount of money in the financial system of a country. In the aftermath of the financial crisis, central banks of Western economies started printing money.
Economist John Mauldin in a recent column titled 
The End of Monetary Policy estimates that central banks have printed $7-8 trillion since the start of the financial crisis. It is worth pointing out here that this money is not actually printed, but created digitally, nonetheless “money being printed” is an easier way to talk about the whole thing.
Once this new money is created it is used to buy bonds, both private as well as government. This has been done to pump money into the financial system and ensure that there is enough money going around to keep interest rates low.
At low interest rates the hope was that people would borrow and spend more. This would create some demand and help economic growth. But that did not happen. What happened instead was that this newly created money found its way into financial markets all over the world.
This broke down the link between economic performance of a country and the performance of its stock market. The stock markets rallied anyway. This point was very well made recently by
Claudio Borio, the head of the Bank of International Settlement’s monetary and economic department: “Buoyant financial markets are out of sync with the shaky global economic and geopolitical outlook. Overall, it is hard to avoid the sense of a puzzling disconnect between the markets’ buoyancy and underlying economic developments globally. Financial markets are euphoric, in the grip of an aggressive search for yield, and yet investment in the real economy remains weak while the macro-economic and geopolitical outlook is still highly uncertain.”
This has led to a situation where bad economic news is treated as good news by the stock markets because the investors know that this will lead to central banks printing more money as they try and get economic growth going again.
As Gary Dorsch, Editor, Global Money Trends newsletter, wrote in a recent columnBad economic news is treated as Bullish news for the stock market, because it lead to expectation of more “quantitative easing.” And the easy money flows that are injected by central banks go right past goods and services (ie; the real economy) and are whisked into the financial markets, where it pushes up the prices of stocks and bonds. In simple terms, what matters most to the stock markets are the easy money injections from the central banks, and to a lesser extent, the profits of the companies whose stocks they are buying and selling.”
This single paragraph explains all the stock market rallies that have happened all over the world in the last few years. At the same time the “easy money” created by central banks has also helped boost corporate profits. As Dorsch puts it “The boom in corporate profits has been heavily subsidized by cheap and easy credit, which has allowed big companies to boost returns by paring down interest costs and buying back shares.” And this has also boosted stock market performance. The question is till when can this last? Do investors really believe that central banks will keep coming to their rescue forever? These are not easy questions to answer and on this your guess is as good as mine.
Hunt who writes the Epsilon Theory newsletter believes that “No one requires convincing that market price levels are unsupported by real world economic activity. Everyone believes that this will all end badly, and the only real question is when.”
Albert Edwards of Societe Generale is a little more direct about the issue. As he wrote in recent research note dated October 23, 2014: “The central banks for all their huffing and puffing cannot eliminate the business cycle. And they should have realised after the 2008 Great Recession that the longer they suppress volatility, both economic and market, the greater the subsequent crash. Will these morons ever learn?” He also quotes Guy Debelle, head of the BIS market committee, as saying that “investors had become far too complacent, wrongly believing that central banks can protect them, and many staking bets that are bound to “blow up” at the first sign of stress.”
The Federal Reserve of the United States has gradually been winding down its money printing programme. Currently it prints $15 billion every month. The Federal Open Market Committee is supposed to meet on October 28-29, later this month. The expectation is that the committee will wind up the money printing programme.
The stock market in the US has remained largely flat over the last two months. In case it starts to fall, once the Federal Reserve stops printing money, it is likely that the American central bank will start printing money again. As Christopher Wood wrote in the
Greed and Fear investment newsletter in November last year “The key issue is what might trigger a market correction. The market consensus continues to focus on the tightening in financial conditions triggered by “tapering”. Still such a hypothetical correction is not so big a deal to GREED & fear, since any real equity decline caused by tapering is likely to lead, under a Fed run by Janet Yellen, to renewed easing.”
So what is the real threat then? “The real threat to US equities is when the American economy fails to re-accelerate as forecast,” wrote Wood. And that is something worth worrying about.

The article originally appeared on www.FirstBiz.com on Oct 26, 2014

(Vivek Kaul is the author of the Easy Money trilogy. He tweets @kaul_vivek)


Global real estate bubble is back with a bang

bubbleVivek Kaul 
One of the major reasons for the current financial crisis were the multiple real estate bubbles which popped up in large parts of the world. These bubbles burst more or less at the same time. This had huge repercussions and the world is still battling with them.
But more than five years after the crisis started, the global real estate bubble is back with a bang.
In the United States, the 20 City S&P/ Case- Shiller Home Price Index, the leading measure of U.S. home prices,
 rose by 13.6% in October 2013, in comparison to a year earlier. This means that real estate prices in October 2013 had risen by 13.6% in comparison to the same period last year.
This is the highest gain in prices since February 2006, when prices had risen by 13.9% in comparison to the year earlier. Real estate prices in the United States, as measured by the 20 City S&P/Case- Shiller Home Price Index had peaked in April 2006.
Prices in London have also been going up at a very high rate. As Albert Edwards of Societe Generale writes in a recent note titled 
Here we go again…and once again no-one is listening “London house prices just rose 10% – in one month… We are in the midst of the mother of all housing bubbles, and although the rest of the country has yet to follow, it inevitably will do so – it always does.”
Similar housing bubbles are being seen in large parts of the world. As economist 
Nouriel Roubini wrote in a recent column “Now, five years later, signs of frothiness, if not outright bubbles, are reappearing in housing markets in Switzerland, Sweden, Norway, Finland, France, Germany, Canada, Australia, New Zealand, and, back for an encore, the UK (well, London). In emerging markets, bubbles are appearing in Hong Kong, Singapore, China, and Israel, and in major urban centers in Turkey, India, Indonesia, and Brazil.”
This is something that even Edwards of Societe Generale agrees with. As he writes in a recent note titled 
If UK Chancellor George Osborne is a moron, Fitch’s Charlene Chu is a heroine “To be sure the UK is nowhere near the most expensive, with some of the usual suspects such as Canada, Australia and New Zealand even worse.”
So what explains such fast rise in real estate prices all over the world? Most of the western world is going through a phase of very low economic growth. Given this incomes haven’t been rising. In fact, they have been falling. 
As Gary Dorsch, editor of Global Money Trends newsletterpoints out in his latest newsletter “For Middle America, real disposable income has declined. The Median household income fell to $51,404 in Feb ‘13, or -5.6% lower than in June ‘09, the month the recovery technically began. The average income of the poorest 20% of households fell -8% to levels last seen in the Reagan era.”
A similar case seems to be playing out in Great Britain as well, wherein anyone looking to buy his first house has to shell out nearly half his income as an EMI. As Edwards writes “The Nationwide Building Society data shows that the average first time buyer in London is paying over 50% of their take home pay in mortgage payments – and that is when interest rates are close to zero.”
Given this, it is only fair to say that there is a housing bubble on. And the only possible explanation for it is the easy money policy run by governments and central banks all over the Western world to revive economic growth. A lot of money has been printed in recent years to ensure that interest rates continue to remain at low levels. As Edwards puts it “The London housing bubble is no longer driven by Asian or eurozone buyers looking for safe havens. This bubble, like the one in the mid-noughties, is about excessively loose monetary policy and light touch regulation.”
What is true about London is true about other parts of the Western world as well. Of course, the usual explanations defending the rapid rise in real estate prices are being made as well. The top reason on this list is that there is only so much land going around, and, hence, real estate prices can only go up. Then there are the usual reasons of population pressures and economic growth pushing real estate prices upwards.
It needs to be pointed out here is that land is really not an issue in countries like United States and Australia. And this reflects in the numbers as well. As Alan S. Blinder writes in 
After the Music Stopped “The historical comparison reveals a stunning—and virtually unknown—fact: On balance, the relative prices of houses in America barely changed over more than a century! To be precise, the average annual relative price increase from 1890 to 1997 was just 0.09 percent.”
This is something that George A. Akerlof and Robert J. Shiller also point out in 
Animal Spirits. As they write “Moreover, real home prices in the United States rose only by 24% from 1900 to 2000, or 0.2% per year. Apparently land hasn’t been the constraint on home construction. So home prices have had negligible real appreciation from the source.” Real home prices are prices which have been adjusted for inflation.
In Europe, land is limited, but the population growth rate is limited as well. In 2013, it is estimated that the population in the European Union went up by 0.21%. Also, real estate prices do fall in places where land is limited. Take the case of Japan. As Akerlof and Shiller point out“Urban land prices have recently fallen in Japan (where land is every bit as scarce as it is in other countries). In fact they fell 68% in real terms in major Japanese cities from 1991 to 2006.”
The other justification being made is that real estate prices are still way below the peaks they achieved during the 2006-2008 period. The 
20 City S&P/ Case- Shiller Home Price Index is still 20.7% below the high it achieved in April 2006. Edwards has an explanation for this. As he writes “To those who say this is not a bubble because transactions or mortgage volumes are some long way off their 2007 peak, I say this is a classic case of anchoring. It’s exactly like 2007 when equity strategists compared equity valuations with the height of the 2000 bubble and concluded equities were cheap. Just because housing transactions and the volume of mortgage loans are below their peaks doesn’t mean we can’t be in the midst of another unsustainable house price bubble.”
To conclude, let me say that just because there is a global real estate bubble on, doesn’t mean that it will burst any time soon. As Roubini puts it “The global economy’s new housing bubbles may not be about to burst just yet, because the forces feeding them – especially easy money and the need to hedge against inflation – are still fully operative.”
The article originally appeared on www.firstpost.com on January 3, 2014
(Vivek Kaul is a writer. He tweets @kaul_vivek)

How money printing has made the rich richer

helicash
Vivek Kaul
 
Raghuram Rajan before he became the governor of the Reserve Bank of India, wrote a book called Fault Lines. This was one of the first books that offered reasons for the financial crisis and that went beyond the greed of Wall Street.
One of the reasons that Rajan discussed in great detail was income inequality. He argued that this was one of the major reasons behind the financial crisis.
The top 1% of the households accounted for only 7.9% of total American wealth in 1976. This would grow to 23.5% of the income by 2007. This was because the incomes of those in the top echelons was growing at a much faster rate.
The rate of growth of income for the period for those in the top 1% was at 4.4% per year. The remaining 99% grew at 0.6% per year. What is even more interesting is the fact that the difference is even more pronounced in the 1990s and the first decade of the twenty first century.
The incomes of those in the top echelons grew at a much faster rate since the 1990s. Between 1993 and 2000, when the dotcom bull run happened and when Bill Clinton was the President of the United States, the income of the top 1% grew at the rate of 10.3% per year, and for the remaining 99%, it grew at 2.7% per year.
Between 2002 and 2007, when George Bush Jr was the President, the income for the top 1% grew at the rate of 10.1% per year. For the remaining it grew at a minuscule 1.3% per year. In fact, the wealthiest 0.1% of the population accounted for 2.6% of American wealth in 1976. This had gone up to 12.3% in 2007.
But it was not only the CEOs and the super rich who were getting richer. Even those below them were doing quite well for themselves. In 1976, the top 10% of households earned around 33% of the national income, by 2007 this had reached 50% of the national income.
In fact in 1992, before the dotcom bull run started, the top 10% earned around 41% of the national income, by the time it ended, the number was at 47% of the national income. When George Bush took over as President the number was at 45% and by the end of his term in early 2008, it had galloped to 50%.
The rich were getting richer in America. One reason for this was the fact that those at the upper echelons of organisations were making more money than ever before. At a more basic level there was also a huge increase in “college premium”. This meant that people who had a college degree earned much more than those who had stopped studying at the high school level

The advent of technology had made a lot of low level jobs redundant. Earlier secretaries used to be required to type letters and responses, or to communicate within the various offices and branches of the firm. With the advent of computers and internet, people did their own typing. And that in turn meant lower pays at lower levels.
The solution to this increasing inequality of income to some extent was more and better education. But that is something that would take serious implementation and at the same time results wouldn’t have come overnight. They would take time.
Hence, the American politicians looked elsewhere to deal with this increasing inequality. There solution was to ensure that loans were easily available to people. Rajan explains this in 
Fault Lines. As he writes “Politicians have therefore looked for other ways to improve the lives of their voters. Since the early 1980s, the most seductive answer has been easier credit. In some ways, it is the path of least resistance…Politicians love to have banks expand housing credit, for all credit achieves many goals at the same time. It pushes up house prices, making households feel wealthier, and allows them to finance more consumption. It creates more profits and jobs in the financial sector as well as in real estate brokerage and housing construction. And everything is safe – as safe as houses – at least for a while.”
This availability of easy money led to a big real estate bubble, which finally morphed itself into the global financial crisis which has been on since late 2008. In the aftermath of the crisis economic growth slowed down. Central banks around the world, led by the Federal Reserve of United States, the American central bank, started to print money.
The idea was to flood the system with money, keep interest rates low and encourage people to borrow, to get the economy up and running again. But that did not happen or at least did not happen at the pace that central banks expected it to.
Low interest rates led to financial firms borrowing and investing money all over the world driving up various financial markets to all time high levels, including the American stock markets. As Gary Dorsch, an investment newsletter, 
writes in his latest newsletter dated December 4, 2013, “The US-stock market rally is now 57-months old, and over this time period, the S&P-500 index has climbed a “wall of worry,” rising +170% from its March 9th, 2009 low, and hitting an all-time high, above the 1,800-level.”
The idea was that once the stock market started to go up, the wealth effect would come into play i.e. people would feel rich and they would go shop. But as it turned out, the retail investors have stayed away from the market for a large part of the last four and half years and have only now started to come back to the market. As Dorsch puts it “But only this year, did it begin to earn the grudging respect of smaller retail investors. They’ve plowed $175-billion into equity funds so far this year, after withdrawing $750-billion in the previous six years.”
Meanwhile the rich got richer. As Dorsch  wrote in a
 newsletter dated October 3, 2013, “Over the past 1-½ years, the Fed has increased the…money supply by +10% to an all-time high of $12-trillion. In turn, traders have bid-up the combined value of NYSE and Nasdaq listed stocks to a record $22-trillion. That’s great news for the Richest-10% of Americans that own 80% of the shares on the stock exchanges.”
He also adds in his latest newsletter that “US-equity values have increased $14-trillion over the past 57-months. Across the Fortune-500 companies, the average chief executives pockets 204-times as much as that of their rank-and-file workers, that’s disparity is up +20% since 2009. Perversely, the compensation of the S&P-500 chieftains is often linked to the ruthless slashing of jobs and wages in order to increase the companies’ profitability. In theory, that boosts stock prices, and CEO’s collect about 90% of their compensation through the exercise of stock options.”
And this has meant that the rich have got richer, while the average income of the middle class and the poor has been falling, as jobs are being slashed. “For Middle America, real disposable income has declined. The Median household income fell to $51,404 in Feb ‘13, or -5.6% lower than in June ‘09, the month the recovery technically began. The average income of the poorest 20% of households fell -8% to levels last seen in the Reagan era,” writes Dorsch.
Due to this nearly more than 100 million Americans are receiving one or another form of welfare from the government. “According to the latest data from the Census Bureau, the US has already passed the tipping point and is officially a welfare society. Today, more Americans are receiving some form of means tested welfare than those that have full-time jobs. No, that’s not a misprint. At the end of 2011, the last year for which data are available, some 108.6-million Americans received one or more form of welfare. Meanwhile, there were just 101.7-million people with full-time jobs, including both the private and government sectors.The danger is the US has already developed a culture of dependency. No one votes to cut his own welfare benefits,” writes Dorsch.
And this is clearly not a healthy sign. The irony is that the American politicians helped by the Federal Reserve created a real estate bubble to address income inequality. Once that bubble blew up, they started printing money. And that in turn has led to more inequality. The solution has aggravated the problem.
The article originally appeared on www.firstpost.com on December 6, 2013 

(Vivek Kaul is a writer. He tweets @kaul_vivek) 

Once more! Fed is blowing bubbles to cover up growing inequality

Bernanke-BubbleVivek Kaul  
The Western central banks(primarily the Federal Reserve of United States and the Bank of England) have been printing money (or quantitative easing as they like to call it) at a very rapid rate since the start of the financial crisis in late 2008. The idea is to print and pump money into the financial system and thus ensure that there is a lot of money going around, leading to low interest rates.
At low interest rates people were expected to borrow and spend more. When they did that businesses would benefit and the economic growth would improve. But this theory hasn’t really worked as well as it was expected to.
The money that was and continues to be printee, has found its way into various financial markets around the world, leading to bubbles and at the same time benefiting those it wasn’t intended to. As Albert Grice of Societe Generale writes in a report titled 
Is the Fed blowing bubbles to cover up growing inequality…again? dated September 27, 2013 “Quantitative Easing(QE) has mainly helped the rich. The Bank of England admitted as much a year ago. Specifically it said that its QE programme had boosted the value of stocks and bonds by 25%, or about $970 billion. It then calculated that about 40 percent of those gains went to the richest 5 percent of British households.”
The situation is similar in the United States as well where the Federal Reserve prints $85 billion every month to keep interest rates low. As Gary Dorsch Editor, Global Money Trends newsletter, 
writes in his later newsletter dated October 3, 2013, “The Fed has always kept its foot pressed firmly on the monetary accelerator, and thus, keeping the speculative juices flowing. Over the past 1-½ years, the Fed has increased the…money supply by +10% to an all-time high of $12-trillion. In turn, traders have bid-up the combined value of NYSE and Nasdaq listed stocks to a record $22-trillion. That’s great news for the Richest-10% of Americans that own 80% of the shares on the stock exchanges.”
Hence, it is safe to say that bubbles across various financial markets have helped the rich get richer, which wasn’t the idea in the first place. Numbers confirm this story. As Emmanuel Saez, of University of California at Berkeley, points out in a note titled 
Striking it Richer: The Evolution of Top Incomes in the United States and dated September 3, 2013 “From 2009 to 2012, average real income per family grew modestly by 6.0%…However, the gains were very uneven. Top 1% incomes grew by 31.4% while bottom 99% incomes grew only by 0.4% from 2009 to 2012. Hence, the top 1% captured 95% of the income gains in the first three years.”
This rise in income inequality might be one reason why the Federal Reserve of United States continues to print money. As Edwards writes “while governments preside over economic policies that make the very rich even richer…the middle classes also need to be thrown a sop to disguise the fact they are not benefiting at all from economic growth.”
So how is the middle class offered a sop in disguise? This is done through an easy money policy of maintaining low interest rates by printing money. In the process, the home prices continue to go up and this ensures that the home owning middle class(which forms a significant portion of both the American and the British population) feels richer.
The S&P/Case-Shiller 20 City Home Index which measures the value of residential real estate in 20 metropolitan areas of the U.S., shows precisely that. 
Overall home price rose by 12.4% in July 2013, in comparison to July 2012. Home prices were up by 27.5% in Las Vegas. They were up 24.8%, 20.8% and 20.4%, in San Francisco, Los Angeles and San Diego, respectively.
A similar scenario seems to be playing out in Great Britain as well. As Edwards wrote in a report titled 
Fools dated September 19, 2013 “Evidence is mounting that easy money …in the UK housing market is leading to another explosion of prices, with London, as always, leading the way with double-digit house price inflation.”
Edwards further points out in another report titled 
If UK Chancellor George Osborne is a moron, Fitch’s Charlene Chu is a heroine dated June 4, 2013, that people have been unable to buy homes despite interest rates being at very low levels because the prices continue to remain very high. As he wrote “Young people today haven’t got a chance of buying a house at a reasonable price, even with rock bottom interest rates. The Nationwide Building Society data shows that the average first time buyer in London is paying over 50% of their take home pay in mortgage payments – and that is when interest rates are close to zero!”
Of course people who already own homes and form a major portion of the population are feeling richer. And thus income inequality is being addressed.
This mistake of propping up housing prices to make the middle class feel rich was one of the major reasons for the real estate bubble in the United States, which burst, before the start of the current financial crisis.
The top 1% of the households accounted for only 7.9% of total American wealth in 1976. This grew to 23.5% of the income by 2007. This was because the incomes of those in the top echelons was growing at a much faster rate.
The rate of growth of income for the period for those in the top 1% was at 4.4% per year. The remaining 99% grew at 0.6% per year. What is even more interesting is the fact that the difference was even more pronounced since the 1990s.
Between 1993 and 2000, the income of the top 1% grew at the rate of 10.3% per year, and the income of the remaining 99% grew at 2.7% per year. Between 2002 and 2007, the income for the top 1% grew at the rate of 10.1% per year. For the remaining it grew at a minuscule 1.3% per year. In fact the wealthiest 0.1% of the population accounted for 2.6% of American wealth in 1976. This had gone up to 12.3% in 2007.
But it was not only the super rich who were getting richer. Even those below them were doing quite well for themselves. In 1976, the top 10% of households earned around 33% of the national income, by 2007 this had reached 50% of the national income.
American politicians addressed this inequality in their own way by making sure that money was available at low interest rates. As Raghuram Rajan writes in 
Fault Lines: How Hidden Fractures Still Threaten the World Economy “Politicians have therefore looked for other ways to improve the lives of their voters. Since the early 1980s, the most seductive answer has been easier credit. In some ways, it is the path of least resistance…Politicians love to have banks expand housing credit, for all credit achieves many goals at the same time. It pushes up house prices, making households feel wealthier, and allows them to finance more consumption. It creates more profits and jobs in the financial sector as well as in real estate brokerage and housing construction. And everything is safe – as safe as houses – at least for a while.”
Of course this is really not a solution to the problem of addressing inequality. It only makes people feel richer for a short period of time till the home prices keep rising and the bubble becomes bigger. But eventually the bubble bursts.
The irony is that people refuse to learn from their mistakes. The same mistake of propping up home prices is being made all over again.

The article originally appeared on www.firstpost.com on October 3, 2013
(Vivek Kaul is a writer. He tweets @kaul_vivek)