Winter and Money Printing are Coming to India, In a Few Months

The Controller General of Accounts publishes the state of government finance at the end of every month. This data is published with a gap of one month. Hence, on 31st August, the data as of 31st July, was published.

This data, not surprisingly, doesn’t make for a good reading. The fiscal deficit, the difference between what a government earns and what it spends, for the period April to July 2020 stood at Rs 8.21 lakh crore. The fiscal deficit that the government had plans to achieve during the course of the current financial year (2020-21) stands at Rs 7.96 lakh crore. Hence, at the end of July, the actual fiscal deficit of the government was 103.1% of the budgeted one.

But given the state we are in this is hardly surprising. Nevertheless, there are several reasons to worry. Let’s take a look at it pointwise.

1) Tax collections have collapsed. Between April and July 2020, the gross tax revenue, which brings in a bulk of the money for the central government and which it shares with the state governments, is down 29.5% to Rs 3.8 lakh crore, in comparison to the same period in 2019.

Let’s look at the different taxes collected by the government between April and June this year and the last year.

They all fall down


Source: Controller General of Accounts.


As can be seen from the above chart, the collections of all major taxes are down big time.

Take the case of central goods and services tax. (GST) or the part of GST that ends up with the central government. During April to July 2019, the total collections of the central GST had stood at around Rs 1.41 lakh crore. During the same period this year the collections have fallen by 34% to Rs 92,949 crore. Other taxes have fallen along similar lines.

The fall in GST collections is a reflection of a massive slowdown in consumption. A slowdown in consumption ultimately reflects in a slowdown in income of individuals as well as incomes of companies. Ultimately, one man’s spending is another man’s income.

But there is something that the above chart does not show, the excise duty collections of the central government. They are up year on year by 23.8% to Rs 67,895 crore. This despite the fact that the consumption of petroleum products between April and July is down 22.5% in comparison to 2019.

So, how have excise duty collections gone up? The central government has increased the excise duty on petrol from Rs 22.98 per litre to Rs 32.98 per litre. The excise duty on diesel has been raised from Rs 18.83 per litre to Rs 31.83 per litre. Also, a substantial part of this duty is a cess, leading to a situation where the central government does not have to share the revenue earned through the cess with the state governments.

In the process, the central government has captured a bulk of the fall in oil prices.

2) As mentioned earlier, the central government needs to share a part of the money it earns with state governments. Between April and July it shared Rs 1.76 lakh crore with states, against Rs 2 lakh crore, during the same period last year. This is 12% lower, during a time when the states are at the forefront of fighting the covid-epidemic.

The ability of the state governments to raise taxes, after having become a part of the goods and services tax system, is rather limited. Take the case of petrol and diesel. The central government has raised excise duty by such a huge extent that the state governments aren’t really in a position to raise the value added tax or the sales tax on petrol and diesel, which they are allowed to charge, without having to face political repercussions for it.

3) The central government has more ways of raising money than the states. One such way is disinvestment of its stakes in public sector enterprises. This year the government plans to earn a whopping Rs 2.1 lakh crore through this route. The original plan included the plan to sell Air India. Whether that happens in an environment where the airlines business has been negatively rerated in the aftermath of covid, remains to be seen.

The other big disinvestment plan was that of the government selling its stake in the Life Insurance Corporation of India through an initial public offering. There are one too many regulatory hurdles that need to be removed, before a stake in India’s largest insurance company can be sold to investors. Long story short, it looks highly unlikely that the government will get anywhere near earning Rs 2.1 lakh crore this year, through the disinvestment front.

Having said that, the government can always resort to some accounting shenanigans, like getting one public sector enterprise to buy another, and pocketing that money. This is likely to happen in the second half of the year.

Over and above this, the government earns a lot of money from the dividends that it earns from public sector enterprises as well as banks and financial institutions. The target for this year is around Rs 1.55 lakh crore. Public sector banks will continue to remain on a weak wicket through this year, hence, their ability to pay dividends is rather limited.

The only way the government can make good this target is by raiding the balance sheet of the RBI for money. Also, the government is likely to raid the cash balances of public sector enterprises which have them, by asking them to pay special dividends.

4) The money that gets invested into various small savings schemes, which includes schemes like Post Office Savings Account, National Savings Time Deposits ( 1,2,3 & 5 years), National Savings Recurring Deposits, National Savings Monthly Income Scheme Account, Senior Citizens Savings Scheme, National Savings Certificate ( VIII-Issue), Public Provident Fund, KisanVikas Patra and Sukanya Samriddhi Account, net of the redemptions, is a revenue entry into the government budget.

This time it has been assumed that the government will get Rs 2.4 lakh crore through this route. Between April and July, Rs 38,413 crore or just 16% of the targeted money has come in. Last year, during the same period, 38% of a much lower target of Rs 1.3 lakh crore had been achieved. Clearly, this target is also going to be missed.

5)  Of course, the government understands this and which is why in early May it increased its borrowing target from Rs 7.8 lakh crore to Rs 12 lakh crore, by more than 50%. The government borrows money to finance its fiscal deficit.

What this means is that the government wants to at least keep the fiscal deficit to around Rs 12 lakh crore. The question is will that happen? Gross tax revenues are already down 30%. Of course, as the economy keeps opening up, this number will look better. Having said that, even if tax revenues are down by 15% as of the end of the year, we are looking at a shortfall of Rs 2.5 lakh crore for the central government. The other big entries of disinvestment and the net-revenue from small savings schemes, are also looking extremely optimistic in the current situation.

Even if the government achieves a fiscal deficit of Rs 12 lakh crore and the economy shrinks by around 10% this year, we will be looking at a central government fiscal deficit of 7% against the targeted 3.5%.

In this scenario, it is now more than likely that the RBI will resort to direct financing of government expenditure by printing money and buying government bonds. The government sells bond to finance its fiscal deficit.

This isn’t to say that the RBI hasn’t printed money this year. It has. But it has chosen to operate through the primary dealers. But the mask might come off in in the time to come and the RBI might decide to buy bonds directly from the government.

Winter and money printing are coming to India, in a few months.


25 Things PM Modi Did Not Tell You About the Indian Economy

narendra modi
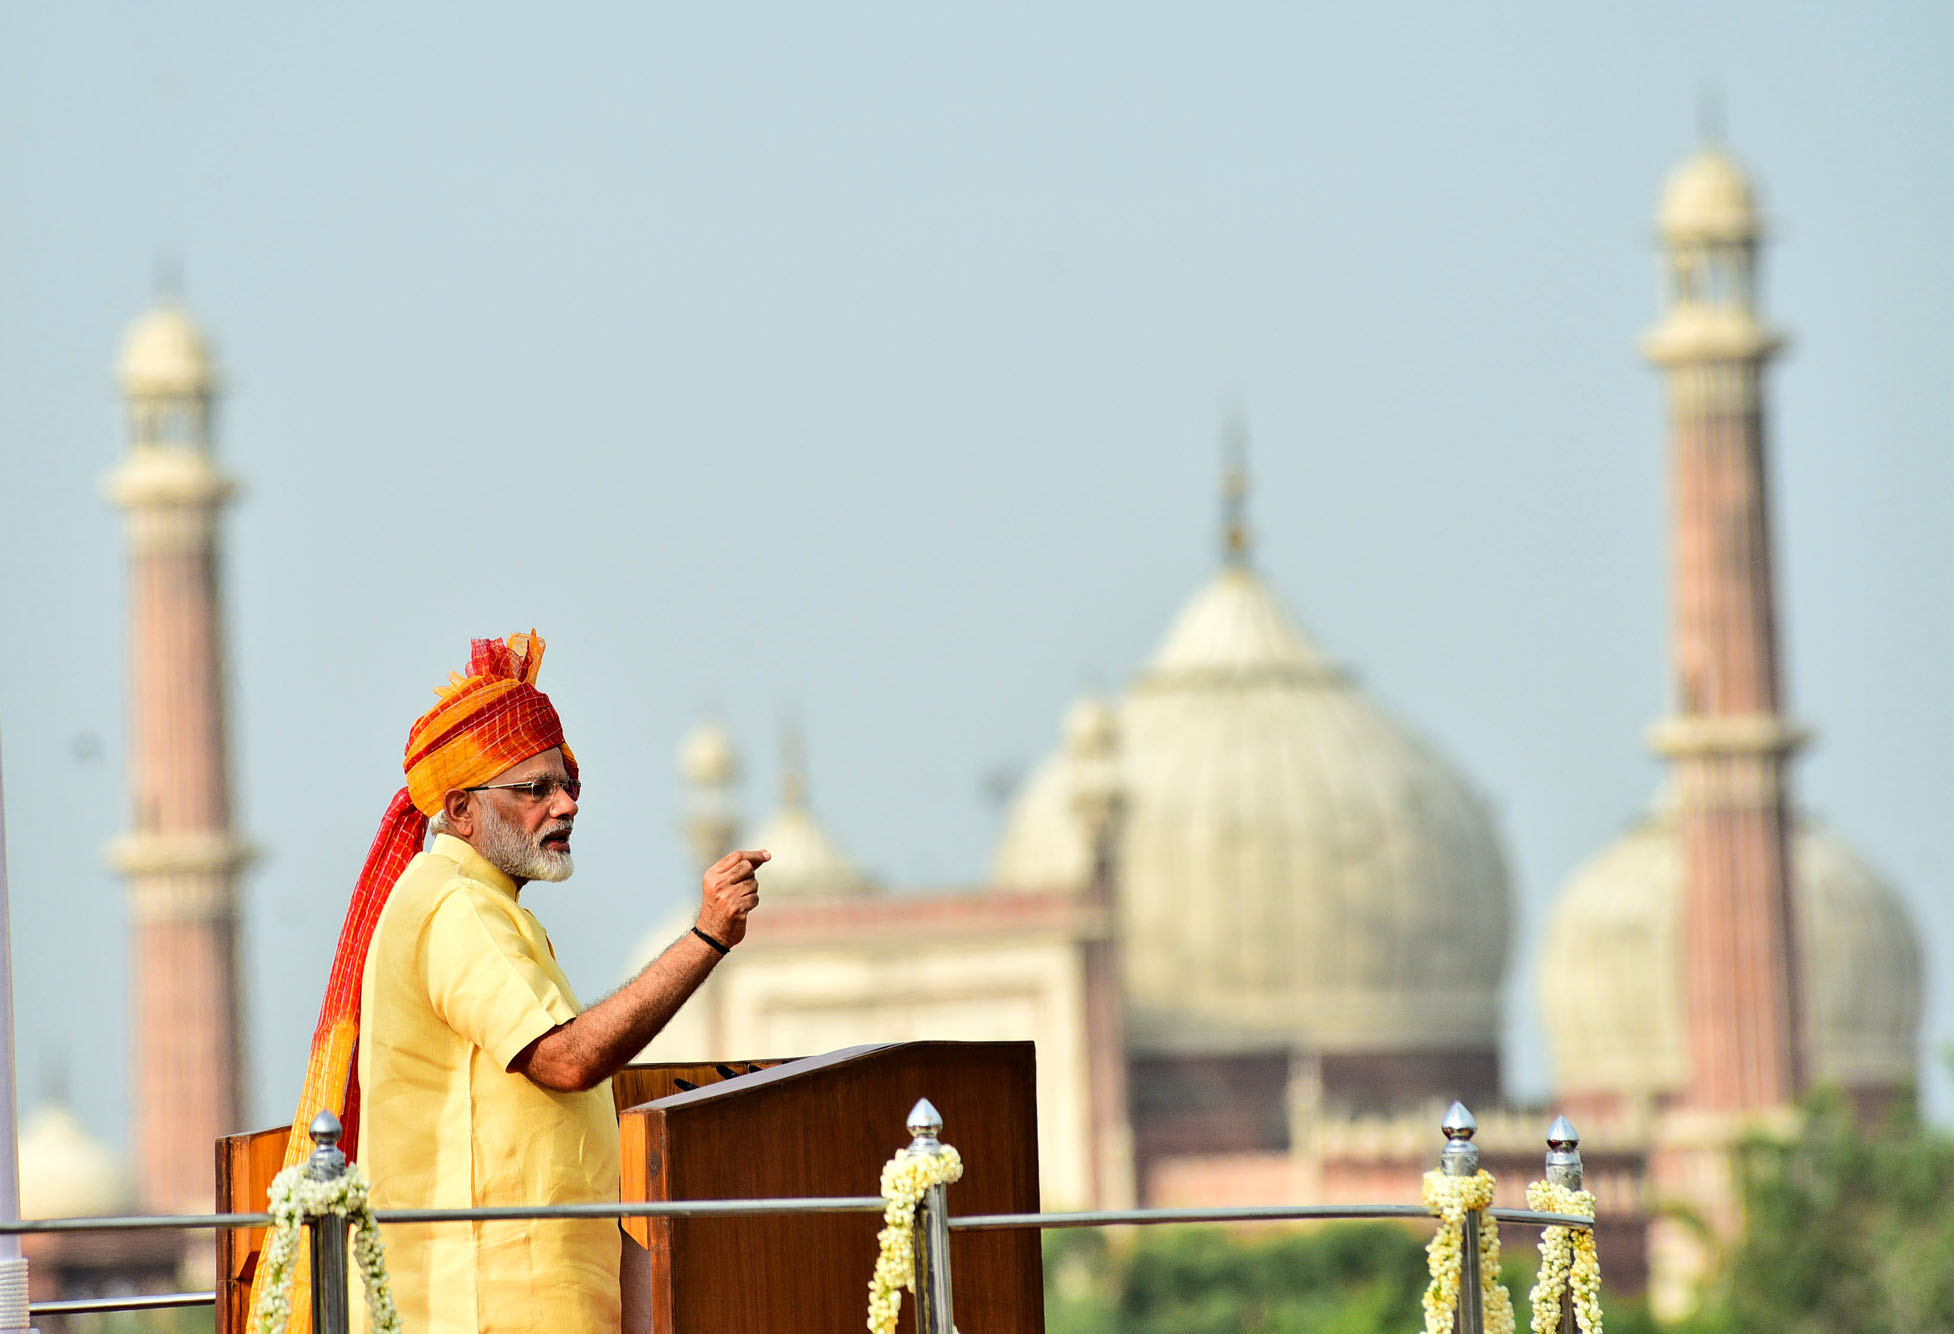
The Prime Minister, Shri Narendra Modi addressing the Nation on the occasion of 71st Independence Day from the ramparts of Red Fort, in Delhi on August 15, 2017.

In a speech last week, Prime Minister Narendra Modi, offered several data points to tell his fellow countrymen, that all is well with the Indian economy. And those who didn’t think so were essentially being needlessly pessimistic, he suggested.

Now only if he had bothered to look at data points beyond those he chose to offer, a totally different situation would have emerged. In this piece, I offer many data points to show that all is not well with the Indian economy.

1) Let’s start with the loans disbursed by banks during the course of this year. Let’s look at non-food credit to start with. These are the loans given out by banks after we have adjusted for food credit or loans given to the Food Corporation of India and other state procurement agencies, for buying rice and wheat directly from farmers at the minimum support price (MSP) for the public distribution system. Take a look at Figure 1.

Figure 1: 

The Figure 1 clearly shows that the total amount of non-food credit given by banks during the course of this year has been in negative territory. This basically means that on the whole banks haven’t given a single rupee of a loan. The situation is the worse it has been in five years. Non-food credit consists of loans given to agriculture, industry, services and retail sectors, respectively.

Let’s take a look at each of these sectors.

2) Let’s take a look at Figure 2, which plots the loans given by banks to agriculture and allied activities.

Figure 2: 

Loans given to agriculture and allied activities are in negative territory during the course of this year. Again, this basically means that on the whole banks haven’t given a single rupee of a loan to agriculture. In technical terms, their loan book to agriculture has shrunk. Is this possibly because of farm loans being waived off by state governments, that only time will tell.

3) Let’s take a look at Figure 3, which plots the loans given banks to industry.

Figure 3: 

Figure 3 makes it clear that loans given to industry by banks continue to shrink. This isn’t surprising given the huge amount of bad loans accumulated by banks on lending to industry. Banks still don’t trust the industry.

4) Let’s take a look at Figure 4, which plots the loans given by banks to the services sector.

Figure 4: 

This comes in as a major surprise, loans given to services have shrunk majorly during this financial year. Services constitute half of the Indian economy. If the firms operating in this sector are not interested in borrowing, then how can the Indian economy possibly be doing well?

5) Let’s take a look at Figure 5, which plots the retail loans given by banks during this financial year.

Figure 5: 

Retail loans are the only loans which have been in positive territory during the course of this year. Nevertheless, they have been more or less at the same level over the last few years.

This, despite the fact that interest rates have come down dramatically. If people are not willing to borrow more even at lower interest rates, how can things be alright with the Indian economy, is a question well worth asking.

Sadly, Prime Minister Modi, did not include any of these data points in his speech and presentation.

6) The latest Consumer Confidence Survey of the Reserve Bank of India (RBI) for September 2017, states: “Households’ current perceptions on the general economic situation remained in the pessimistic zone for four successive quarters, with the outlook worsening… The employment situation has been the biggest cause of worry for respondents, with sentiment plunging further into the pessimistic zone; the outlook on employment has also weakened.”

7) Take a look at Figure 6, which plots the cement production over the years.

Figure 6: 

Cement production is down this year, in comparison to the previous year. This tells us clearly that the construction and the real estate industry continue to be in trouble. These industries are huge employers of people, especially those who have low-skills.

8) The commissioning of new projects has slowed down. As Centre for Monitoring Indian Economy, which tracks this data, points out: “Projects worth Rs 512 billion were commissioned during the quarter ended September 2017. In the coming weeks this estimate is expected to rise. It could reach about Rs 700 billion. Even if this happens, this would be the lowest commissioning of projects during the Modi government’s tenure so far.” 

9) There has been a fall in new investment proposals. As Centre for Monitoring Indian Economy, which tracks this data, points out: “Projects worth Rs.845 billion were proposed during the quarter ended September 2017. This is the lowest level of intentions to invest seen in a quarter during the tenure of the Modi government.”

10) There has been a huge fall in the profit of companies. As Centre for Monitoring Indian Economy points out: “We infer this and other related nuggets of information from the financial statements of 1,127 listed companies… Profit before taxes of these companies fell by 27.9 per cent over their level a year ago.”

11) Take a look at Figure 7, which plots the trade deficit or the difference between exports and imports.

Figure 7: 

The trade deficit has jumped up majorly during the course of this financial year. This as I have explained beforehas primarily been on account of a jump in non-oil non gold non silver imports, in the aftermath of demonetisation. The unseen negative effects of demonetisation continue to impact the economy.

12) The growth in private consumption expenditure is at a six-quarter low. As the RBI Monetary Policy Statement pointed out: “Of the constituents of aggregate demand, growth in private consumption expenditure was at a six-quarter low in Q1 of 2017-18 [April to June 2017].”

13) As the RBI Monetary Policy Statement further pointed out: “India’s export growth continued to be lower than that of other emerging economies such as Brazil, Indonesia, South Korea, Turkey and Vietnam, some of which have benefited from the global commodity price rebound.”

14) Take a look at Figure 8 which plots the investment to GDP ratio.

Figure 8: 

The investment to GDP ratio has improved a little in the period of three months ending June 2017, but it continues to remain very low. As the RBI Monetary Policy Statement pointed out: “The implementation of the GST so far also appears to have had an adverse impact, rendering prospects for the manufacturing sector uncertain in the short term. This may further delay the revival of investment activity, which is already hampered by stressed balance sheets of banks and corporates.”

15) Now let’s take a look at Figure 9, which plots the growth of the non-government part of the GDP.

Figure 9: 

Figure 9 basically plots the growth of the non-government part of the economy, which typically constitutes 87 to 92 per cent of the economy. The growth of the non-government part of the economy has fallen to around a little over 4 per cent. This extremely important detail did not find a place anywhere in Prime Minister Modi’s speech.

If the non-government part of the economy is growing at such a slow rate, how will jobs for the one million youth entering the workforce every month, ever be created.

16) The situation becomes even more worrisome if we look at Figure 10.

Figure 10: 

As is clear from Figure 10, the growth rate of industry in general and manufacturing and construction in particular is at a five-year low. The manufacturing part of industry grew at 1.17 per cent during April to June 2017, whereas construction grew by 2 per cent during the same period.

This is a big reason to worry simply because manufacturing and construction have the potential to create new jobs. An estimate made by Crisil Research suggests that in construction 12 workers are typically required to create Rs 10 lakh worth of output. In case of manufacturing it is seven workers.

17) Take a look at Figure 11, which basically shows that labour intensive sectors have slowed down between January to June 2017.

Figure 11: 

As Crisil Research points out in a recent research note: “In the past two quarters, three sectors have grown much faster than GDP: 1) Trade, hotels, transport, communication and services related to broadcasting; 2) Electricity, gas, water supply and other utilities, and 3) Public administration, defence and other services. Of these, only the trade, hotels and restaurants sub-sector is labour intensive, requiring about 6 workers to produce Rs 10 lakh worth of output. But the share of this sub-sector in total output is low at ~12%. In contrast, a fast growing sector like public administration, defence and other personal services, despite having a larger share in output, has low labour intensity of only 3. And sectors with higher labour intensity – such as construction (12) and manufacturing (7) – have been undershooting overall GDP growth.”

It needs to be said here that public administration, defence and other personal services sector is basically a proxy for the government. And the government has stopped creating jobs.

18) Take a look at Figure 12.

Figure 12: 

Figure 12 plots the index of industrial production (IIP), a measure of the industrial activity in the country. It also plots manufacturing, which forms more than three-fourths of IIP. The growth of both these measures has been in low single digits for a while now and is clearly a reason to worry.

19) Take a look at Figure 13, which basically plots the consumption of petroleum products, over the years.

Figure 13: 

The consumption of petroleum products has more or less been flat in comparison to the last financial year. This is another good indicator of slowing economic growth.

20) Take a look at Figure 14, which plots the sale of commercial vehicles during the course of this financial year.

Figure 14: 

Commercial vehicle sales, which are a very good indicator of a pick-up in the industrial part of the economy. Commercial vehicle sales this year were lower than they were last year.

21) Take a look at Figure 15. It plots the fiscal deficit ratio of the government over the years.

Figure 15: 

As can be seen from Figure 15, in the first five months of the current financial year, 96 per cent of the annual fiscal deficit has already been crossed. Fiscal deficit is the difference between what a government earns and what it spends. Why is the fiscal deficit during the first five months of the year at such a high level? The answer lies in the fact that the economic growth is slowing down and the government is trying to drive up growth, by spending more.

22) Take a look at Figure 16.

Figure 16: 

It tells us that the increase in government expenditure has been a greater part of the increase in GDP over the last two years. For the period April to June 2015, the increase in government expenditure made up for around 1.3 per cent of the increase in GDP during that period. Since then it has jumped to 39.2 per cent between January to March 2017 and 34.1 per cent between April to June 2017.

So, the government is spending more and more in order to drive economic growth. This again shows that the government in its actions does believe that the economic growth is slowing down, but PM Modi won’t say so in his public posturing.

23) Take a look at Figure 17, it plots the bad loans ratio of public sector banks.

Figure 17: 

Figure 17, basically plots the gross non-performing advances ratio or simply put. the bad loans ratio of public sector banks, over the years. Bad loans are essentially loans in which the repayment from a borrower has been due for 90 days or more. There has been a huge jump in bad loans of public sector banks over the last two years.

On October 7, the Reserve Bank of India imposed restrictions on the banking activities of Oriental Bank of Commerce (OBC). OBC was the seventh public sector bank on which restrictions have been placed. Now, one-third of public sector banks have restrictions in place. And all is well with the Indian economy?

24) Take a look at Table 1.

Table 1:

Gross NPAs (in Rs Crore)Gross AdvancesGross non-performing advances ratio
Indian Overseas Bank35,0981,40,45924.99%
IDBI Ltd.44,7531,90,82623.45%
Central Bank of India27,2511,39,39919.55%
UCO Bank22,5411,19,72418.83%
Bank of Maharashtra17,18995,51518.00%
Dena Bank12,61972,57517.39%
United Bank of India10,95266,13916.56%
Oriental Bank of Commerce22,8591,57,70614.49%
Bank of India52,0453,66,48214.20%
Allahabad Bank20,6881,50,75313.72%
Punjab National Bank55,3704,19,49313.20%
Andhra Bank17,6701,36,84612.91%
Corporation Bank17,0451,40,35712.14%
Union Bank of India33,7122,86,46711.77%
Bank of Baroda42,7193,83,25911.15%
Punjab & Sind Bank6,2985833510.80%
Canara Bank34,2023,42,00910.00%

Source: Author calculations on Indian Banks’ Association data.(The table does not include the associate banks of the State Bank of India which were merged into it).

What does Table 1 tell us? It tells us that many public sector banks are in a big mess on the bad loans front. Banks like Indian Overseas Bank and IDBI with bad loans ratio of 24.99 per cent and 23.45 per cent, will pull down the performance of any big bank they are merged with.

Even the big banks like Union Bank of India, Bank of Baroda, Punjab National Bank and Canara Bank, have a bad loans ratio of 10 per cent or more. If and when weaker banks are merged with these banks, their performance will only deteriorate. The question to ask is, why are many of these banks still being allowed to operate?

25) The capacity utilisation of 805 manufacturing companies tracked by the RBI OBICUS survey fell to 71.2 per cent during the period April to June 2017. This is the lowest in seven quarters.

I guess I will stop at this. There are many other economic indicators which can be used to point out that all is not well with the Indian economy. (For more details on how PM Modi cherry picked data to build a positive economic narrative, you can click here and here). Of course, this is not to say that there are no positive economic indicators right now. But the negative indicators far outnumber the positive ones.

As I keep saying, the first step towards solving a problem is recognising that it exists. But that doesn’t seem to be the case with PM Modi. In his world, all is well.

The column originally appeared on Equitymaster on October 9, 2017.

Dear Mr Urjit Patel, Have You Ever Heard of Wasim Barelvi?

For a man who rarely and barely speaks, the Reserve Bank of India governor Urjit Patel spoke quite a lot in the press conference that happened after the first monetary policy of this financial year was presented on April 6, 2017.

In response to the question, “What do you think are the implications of the farm loan waiver schemes and is it a cause of concern for the RBI?”, Patel had this to say: “There are several conceptual issues, if one were to put one’s hat as an economist on. I think it undermines an honest credit culture, it impacts credit discipline, it blunts incentives for future borrowers to repay, in other words, waivers engender moral hazard. It also entails at the end of the day transfer from tax payers to borrowers. If on account of this, overall Government borrowing goes up, yields on Government bonds also are impacted. Thereafter it can also lead to the crowding out of private borrowers as higher government borrowing can lead to an increase in cost of borrowing for others. I think we need to create a consensus such that loan waiver promises are eschewed, otherwise sub-sovereign fiscal challenges in this context could eventually affect the national balance sheet.

Basically in one paragraph, Patel summarised all that is wrong about waiving off farmer loans or in fact, any loan. I had discussed most of these issues in my Diary dated April 5, 2017, last week.

The first issue that a waive-off of bank loans creates is that of a moral hazard. The economist Alan Blinder in his book After the Music Stopped writes that the “central idea behind moral hazard is that people who are well insured against some risk are less likely to take pains (and incur costs) to avoid it.”

This basically means that once the farmer sees a loan being waived off today, he will wait for elections in the future for the newer loans he takes on to be waived off as well. Essentially, he will see little incentive in repaying loans that he takes on in the future. Or as Patel put it: “it impacts credit discipline, it blunts incentives for future borrowers to repay”.

The second issue that a waive-off of bank loans creates is that it can lead to the crowding out of private borrowers. The state government waiving off the bank loans needs to compensate banks which had given these loans. In case of the Uttar Pradesh government which recently wrote off the loans, this amounts to Rs 36,359 crore. The government will have to borrow this amount in order to pay the banks simply because its earnings are lesser than its expenditure.

When a government borrows more, it leaves a lesser amount of money for others to borrow. This can push up interest rates and as Patel aptly puts it, “higher government borrowing can lead to an increase in cost of borrowing for others”. What also needs to be taken into account here is the fact that the Uttar Pradesh government waive-off might inspire other state governments to waive-off farmer loans as well. This will mean greater government borrowing and a higher crowding out effect.

It will also lead to the overall fiscal deficit of the nation (i.e. fiscal deficits of state governments plus that of the central government) going up. Fiscal deficit is the difference between what a government earns and what it spends during the course of a year. The difference between the earning and the spending is met through borrowing.

If several state governments waive-off bank loans and borrow more, it will lead to the national fiscal deficit going up. As Patel puts it: “sub-sovereign fiscal challenges in this context could eventually affect the national balance sheet.”

So far so good. It is nice to see the RBI governor speak out against what is essentially bad economics and can screw up the economic and financial situation of the nation. Nevertheless, the question is where has all this forthrightness been when it comes to the issue of corporate defaults and loan write-offs?

As is well known, corporates have defaulted on several lakhs of crore of bank loans over the years. These defaulters have been treated with kid gloves. Over the years, a huge amount of corporate loans have been written off. It needs to be mentioned here that loans written off are different from loans being waived off, at least theoretically.

This is something I discuss in detail in my new book India’s Big Government—The Intrusive State and How It is Hurting Us. The loans written off are no longer be a part of the balance sheet of the bank, even though they can be recovered in the future. There is no chance of recovery in case of a loan that is waived off. Hence, theoretically there is a difference between a write-off and a waive-off.

Let’s try and understand this issue in a little more detail. Let’s first take the case of the State Bank of India. As of April 1, 2015, the bank had Rs 56,725 crore of bad loans, or gross NPAs. During the course of the year, Rs 4,389 crore of bad loans was recovered. At the same time, the bank wrote off Rs 15,763 crore of bad loans. The loans written off would no longer be a part of the balance sheet of the bank, even though they could be recovered in the future.

As we can see in case of the State Bank of India, the total amount of the loans written off during the year was more than three times the total amount of the loans recovered. That tells us the sad state of the loan recovery process. There were also fresh bad loans that were added to the balance sheet of the bank during the course of the year, and by March 31, 2016, the total bad loans of the bank had slipped to Rs. 98,173 crore.

Or take a look at Table 1 which shows the overall scenario comparing write-offs and recoveries.

Table 1: Write-offs versus recoveries of public sector banks

Write-offs versus recoveries of public sector banks

YearWrites-Offs
(in Rs. Crore)
Recoveries
(in Rs. Crore)
2015-201659,54739,534
2014-201552,54241,236
2013-201434,40933,698
2012-201327,23119,832

Source: Reserve Bank of India

As is clear from Table 1, write-offs of public sector banks have been greater than their recoveries. And the absolute difference between the two has only gone up over the years. A bulk of these loans are corporate loans. Hence, it is safe to say on the basis of this data that a large portion of corporate loans which are written-off are over the years, are practically waived-off because banks are really not able to recover these loans.

Hence, if the issue of moral hazard comes up with farmer loan waive-offs, it also comes up with corporate loan write-offs. And given that a large portion of what is technically a write-off is actually a waive-off, the case for moral hazard in this case is really very strong. The RBI governor Patel could have talked about this as well, given that he has been in office for more than seven months now.

Over and above this, corporate loan write-offs have led to the situation of diminishing bank capital. This has led to the central government having to recapitalise the public sector banks over the years. Between 2009 and now, the amount of money put in has been greater than Rs 1,30,000 crore. This money is ultimately borrowed by the government and leads to crowding out, higher interest rates and a weaker national balance sheet. All these issues pointed out by Patel in case of farm loan waive-offs apply to corporate write-offs as well.

But a word hasn’t been spoken against them.

In the Diary dated March 22, 2017, I had quoted the British author George Orwell. In his book Animal Farm, Orwell writes: “All animals are equal, but some animals are more equal than others.” The point being, if there is a moral hazard for the farmer, there is also one for corporates. And if the RBI governor has pointed out one, he should have pointed out the other as well.

Over the weekend, I came across a very interesting couplet which makes the same point has George Orwell did in the Animal Farm, but rather more forcefully.

As Wasim Barelvi, probably the greatest Urdu poet alive today, writes:

Garib lehron par pehren bithaye jaate hain
samundaron ki talashi koi nahi leta”.

(I couldn’t come across a good translation of this couplet. Hence, I am leaving it untranslated. But its basic meaning is the same as the line from Orwell’s Animal Farm, quoted earlier).

The column originally appeared on April 10, 2017 on Equitymaster

Why Waiving Off UP Farm Loans is a Bad Idea, Nevertheless…

In the run-up to the assembly elections in Uttar Pradesh, the Bhartiya Janata Party had promised that it would waive off crop loans taken by the small and marginal farmers of the state.

Political parties promising to waive off crop loans is nothing new. Before the 2009, Lok Sabha elections, the Congress led United Progressive Alliance government had carried out a similar exercise.

The question, as always, is how much is it going to cost and where is the money going to come from? The State Bank of India in a research report expects the cost of waiving off crop loans to small and marginal farmers to come at around Rs 27,419.7 crore. How have they arrived at this estimate? The total loans given by banks to the agriculture sector in Uttar Pradesh stands at Rs 86,241 crore.

As the SBI report points out: “According to RBI data (2012), 31% of the direct agriculture finance went to marginal and small farmers (landholdings upto 2.5 acres). Taking this as a proxy for Uttar Pradesh as well, approximately Rs 27,419.70 crore will have to be waived off in case loan waiver scheme is implemented for the small and marginal farmers for all banks (scheduled commercial banks, cooperative banks and primary agricultural cooperative societies).”

The SBI estimate suggests that the loan waive off will cost around Rs 27,420 crore. The banks which had given these loans will have to be compensated for this waive off. The union agriculture minister Radha Mohan Singh in a series of tweets on March 17,2017, made it clear that the union government wasn’t picking up the tab. In one of the tweets he said that, if any state government waives off the loans of small and marginal farmers using the state treasury, the move should be welcomed. Hence, from the looks of it, if the loans are waived off, the Uttar Pradesh government will have to pick up the tab.

Take a look at Figure 1. It shows the fiscal deficit of the Uttar Pradesh government over the years. A government is said to run a fiscal deficit if its revenue is less than its expenditure. This difference the government makes up through borrowing money.

As can be seen from Figure 1, the fiscal deficit of the state has risen at a much faster pace than its gross domestic product over the years. While, the state GDP has jumped by 59.3 per cent between 2011-2012 and 2015-2016, the fiscal deficit has jumped from 2.13 per cent of the state GDP to 5.57 per cent of the state GDP, at a much faster pace.

Figure 1:

YearGross Fiscal DeficitState GDP at current prices (in Rs crore)Fiscal Deficit as a percentage of GDP
2016-2017*49,96112,36,655^^4.04%^
2015-2016**64,31711,53,7955.57%
2014-201532,51310,43,3713.12%
2013-201423,6809,441462.51%
2012-201319,2408,22,9032.34%
2011-201215,4307,24,0492.13%

*budget estimate
**revised estimate
Source: /or GSDP, the RBI’s Database on Indian Economy.
For deficit, budget.up.nic.in and RBI Reports on State Finances
^Source: www.business-standard.com
^^ Calculated on the basis of 4.04 per cent and Rs 49,961 crore fiscal deficit estimates.

In 2016-2017 which is the current financial year, the fiscal deficit of the state government is expected to be at 4.04 per cent of the state GDP. In absolute terms it was expected to be at Rs 49,961 crore. If the Uttar Pradesh government waives off the loans during the course of this financial year, then the fiscal deficit in absolute terms would shoot to Rs 77,381 crore (Rs 49,961crore plus Rs 27,420 crore of the waive off), assuming that expenditure and revenue assumptions made at the beginning of the year, hold true. This works out to 6.26 per cent of the state’s gross domestic product and is a really high figure.

So, the question is can Uttar Pradesh government afford this? The answer clearly is no. Can the union government in Delhi afford it? The answer is yes. Rs 27,420 crore is not a large amount for it. But if it goes ahead and finances this write off, similar demands will be raised by other states as well. And given that the Bhartiya Janata Party governments now govern large parts of the country, it will be very difficult for the union government to say no.

Over and above the one-time cost to the state government, there is also the question of moral hazard. The economist Alan Blinder in his book After the Music Stopped writes that the “central idea behind moral hazard is that people who are well insured against some risk are less likely to take pains (and incur costs) to avoid it.”

This basically means that once the farmer sees a loan being waived off today, he will wait for elections in the future for the newer loans he takes on to be waived off as well. Essentially, he will see little incentive in repaying loans that he takes on in the future.

As the SBI Chairperson Arundhati Bhattacharya said recently: “We feel that in case of a (farm) loan waiver there is always a fall in credit discipline because the people who get the waiver have expectations of future waivers as well. As such future loans given often remain unpaid… Today, the loans will come back as the government will pay for it but when we disburse loans again then the farmers will wait for the next elections expecting another waiver.”

All this makes tremendous sense. But given that we live in the age of whataboutery, you, dear reader, may comeback and ask us: “But what about the fact that banks have written off lakhs of crore of loans that they gave to corporates? If they can do that, why can’t they waive off Rs 27,420 crore?”

This is a very good question for which I really don’t have a straightforward answer. In situations like these I suggest, dear reader, that you read George Orwell. As he famously wrote in the Animal Farm: “All animals are equal, but some animals are more equal than others”.

The point is that if there is a moral hazard for the farmer, there is also one for the corporates.

For today, we will leave it at that.

The column was originally published on March 22, 2016

Fiscal Deficit for First Four Months of 2016-2017 is Highest in Eight Years

At the end of every month the Controller General of Accounts (CGA) declares the fiscal deficit of the government, up until the previous month of the financial year. Fiscal deficit is the difference between what a government earns and what it spends.

Hence, as of August 31, 2016, the CGA declared the fiscal deficit number for the period April to July 2016. During the period the fiscal deficit of the central government was at Rs 3,93,487 crore. This was at 73.7 per cent of the annual target for the financial year and is the highest in eight years.

Fiscal deficit a percentage of annual target 

Take a look at the above chart. It shows the fiscal deficit as a percentage of the annual target, for the first four months of the financial year, over a period last twelve years. It is clear that only in July 2007 and July 2008, was the fiscal deficit as a percentage of the annual target, at a higher level in comparison to where it is at during the course of this financial year. The year 2008 was the year when the financial crisis started and the government tried to beat the impending slowdown by spending much more than it what normally did during the first four months of the year.

Another point that needs to be mentioned here is that expenditure of the government is front loaded whereas a major chunk of its revenues start to come in only in the second half of the year. Even with this disclaimer, the fiscal deficit for the first four months of this financial year is worrying, given that one of the biggest expenditure items of the year, the extra salaries and pensions that the government needs to pay to its current and former employees after accepting the recommendations of the Seventh Pay Commission, kicks in only from August 2016.

This higher fiscal deficit is also visible in the gross domestic product number for the first three months of the financial year (April to June 2016). One way of measuring the gross domestic product (GDP) is to calculate the total expenditure by adding the consumption expenditure, the government expenditure, investments and the net exports (exports minus imports).

For the three-month period between April to June 2016, the government expenditure went up by 18.8 per cent (in real terms). This helped the GDP grow by 7.1 per cent. Without this push from the government, the growth would have been much slower at 5.7 per cent, as per Nomura.

The trouble is that the government doesn’t have an unlimited amount of money and if it is spending money without earning it first, it’s bound to push up its fiscal deficit. A higher fiscal deficit comes with its own set of problems, from higher inflation to higher interest rates.

Further, if the government wants to achieve the fiscal deficit target of 3.5 per cent of the GDP, that it set at the time of presenting the budget, it will have to be a little more aggressive about raising its revenues.

Take the case of the disinvestment target for 2016-2017. It has been set at Rs 56,500 crore. The way it has worked in the previous years is that the government has waited all through the year for the stock market sentiment to improve. And then towards the end of the year, the Life Insurance Corporation of India, has been encouraged to buy what the government has had to sell.

In 2015-2016, of the disinvestment target of Rs 69,500 crore, only around Rs 25,312.6 crore was earned. Of this amount, a major chunk came from the Life Insurance Corporation of India. From the looks of it, something similar may happen this year as well. The Life Insurance Corporation picking up shares being sold by the government is hardly genuine disinvestment, with the money moving from one arm of the government to another.

It is worth pointing out here that timing the market by trying to sell when the stock market is peaking, is very difficult to achieve. And the same applies to the government as well. An ideal strategy would be sell the government stake in companies, little by little almost every month. This wait for the market to pick up is not the best way to operate. The moment any disinvestment of shares stops being an event, will be the day, this strategy will really take off.

Further, given its ambitions in the infrastructure sector, the Modi government needs to look at newer ways of raising revenue. One such way is by selling land. As the Economic Survey of 2015-2016 points out: “Most public sector firms occupy relatively large tracts of land in desirable locations. Parts of this land can be converted into land banks.”

These land banks can then be sold in order to raise revenues for the government. This money can go into a sort of an infrastructure fund which can be used to finance the ambitious plans of the government when it comes to roads and railways.

Of course, for this to happen, the reluctance of the bureaucrats to sell land has to be overcome. This reluctance, the Economic Survey comes in large part from the “the fear of ‘causing pecuniary gain’ to the other side.” And this fear will not be so easy to get rid of.

(The column originally appeared in Vivek Kaul’s Diary on September 6, 2016)