Indian Economic Growth Data Has Gone the Chinese Way—It’s Not Believable

narendra_modi
The Central Statistics Office (CSO) has declared the economic growth, as measured by the growth in gross domestic product (GDP), for the period October to December 2015. During the period India grew by 7.3%.

The economic growth for the period July to September 2015 has also been revised to 7.7%, against the earlier 7.4%. The economic growth for the period April to June 2015 was also revised to 7.6%, against the earlier 7%.

The CSO also said that the “growth in GDP during 2015-16 is estimated at 7.6 per cent as compared to the growth rate of 7.2 per cent in 2014-15”.

The question to ask here is that why doesn’t it feel like India is growing at greater than 7%? Before I answer this question let me reproduce a paragraph from author and economic commentator Satyajit Das’ new book The Age of Stagnation: “In a 2007 conversation disclosed by WikiLeaks, Chinese premier Li Keqiang told the US ambassador that GDP statistics were ‘for reference only’. Li preferred to focus on electricity consumption, the volume of rail cargo, and the amount of loans disbursed.”

This was promptly dubbed as the Li Keqiang index, by the China watchers.

Over the years, lot of doubts have been raised about the official Chinese economic growth data. And many analysts now like to look at high speed economic indicators to figure out the ‘actual’ state of the Chinese economy.

The Indian GDP data also seems to have reached a stage where it is ‘for reference only’. And we probably now need our own version of the Li Keqiang index, to figure out how different the actual economic growth is from the official number.

It is worth understanding here that GDP ultimately is a theoretical construct. One look at the high speed economic indicators clearly tells us that India cannot be growing at greater than 7%.

Let’s first take a look at the data points that constitute the Li Keqiang index. The electricity requirement for the period April to December 2015 has gone up by only 2.5% to 8,37,958 million Kwh, in comparison to the period between April to December 2014.

How does the earlier electricity requirement data look? The electricity requirement between April to December 2014 had gone up by 8.3% to 8,16,848 Kwh, in comparison to the period April to December 2013. What this clearly tells us is that the demand for electricity has gone up by a very low 2.6% during the course of this financial year, in comparison to 8.3% a year earlier. This is a clear indicator of lack of growth in industrial demand. As industrial demand picks up, demand for electricity also has to pick up.

And how about railway freight? Between April to December 2015, revenue earning railway freight grew by 1% to 8,16,710 thousand tonnes, in comparison to April to December 2014. Between April to December 2014, revenue earning railway freight had grown by 5% to 8,08,570 thousand tonnes, in comparison to April to December 2013.

The railways transports coal, pig iron and finished steel, iron ore, cement, petroleum etc. A slow growth in railway freight is another great indicator of lack of industrial demand.

This brings us to the third economic indicator in the Li Keqiang index, which is the amount of bank loans disbursed, an indicator of both consumer as well as industrial demand. The bank loan growth for the period December 2014 to December 2015 stood at 9.2%. Between December 2013 to December 2014 the loan growth had stood at a more or less similar 9.5%. Bank loan growth has been in single digits for quite some time now. In fact, growth in loans given to industries stood at 5.3% between December 2014 and December 2015.

And what is worrying is that bad loans of banks have jumped up. Bad loans of banks stood at 5.1% of total advances as on September 30, 2015, having jumped from 4.6% as on March 31, 2015. The stressed loans of public sector banks as on September 30, 2015, stood at 14.2% of the total loans.

Hence, for every Rs 100 of loans given by public sector banks, Rs 14.2 has either been declared to be a bad loan or has been restructured. In March 2015, the stressed assets were at 13.15%.

Estimates suggest that over the last few years nearly 40% of restructured loans have gone bad. This clearly means that banks have been using this route to kick the bad loan can down the road. It also means that many restructured loans will go bad in the time to come.

Hence, the Indian economic growth story is looking ‘really’ weak when we look at the economic indicators in the Li Keqiang index. There are other high frequency economic indicators which tell us clearly that economic growth continues to be weak.

Exports have been falling for 13 months in a row. Between April and December 2015, exports fell by 18% to $196.6 billion. Non petroleum exports between April and December 2015 were down by 9.4% to $173.3 billion. The bigger point is that is how can the economy grow at greater than 7%, when the exports have fallen by 18%? In 2011-2012, exports grew by 21% to $303.7 billion. The GDP growth for that year was 6.5%. How does one explain this dichotomy?

Between April and December 2015, two wheeler sales went up by 1.05% to 1.42 crore, in comparison to a year earlier. Two-wheeler sales are an excellent indicator of consumer demand throughout the country. And given that the growth has been just 1.05%, it is a very clear indicator of overall consumer demand remaining weak.

In fact, the rural urban disconnect is clearly visible here. Motorcycle sales are down by 2.3% to 97.61 lakhs. Scooter sales are up 11.5% to 39 lakhs. Scooters are more of an urban product than a rural one. This is a clear indicator of weak consumer economic demand in rural and semi-urban parts of the country. Tractor sales fell by 13.1% between April to December 2015 to 4.12 lakh. This is another  indicator of the bad state of rural consumer demand.

One data point which has looked robust is the new car sales data. New car sales during the period April to December 2015, grew by 7.9% to 19.22 lakhs, in comparison to a year earlier. Between April to December 2014, new car sales had grown by 3.6% to 17.82 lakhs. The pickup in new car sales is a good indicator of robust consumer demand in urban areas.

Over and above this, not surprisingly, corporate earnings continue to remain dismal. If all the data that I have pointed up until now was positive, corporate earnings would have also been good.

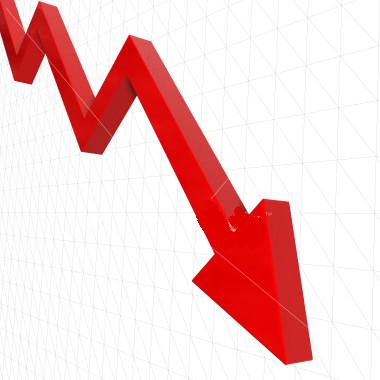
The larger point is that if so many high frequency economic indicators are not in a good state, how is the economy growing at greater than 7% and how is it expected to grow by 7.6% during the course of this year. What is creating economic growth?

It is worth pointing out here that sometime early last year, the CSO moved to a new method of calculating the GDP. Since then robust economic growth numbers have been coming out, though the performance of high frequency economic indicators continues to remain bad. In fact, some economists have measured the economic growth rate between April and September 2015, as per the old method, and come to the conclusion that the growth is in the range of 5-5.2%, which sounds a little more believable.

To conclude, there is no way the Indian economy can possibly be growing at greater than 7%. Honestly, Indian economic growth data now seems to have gone the Chinese way—it’s totally unbelievable. And since we like to compete with the Chinese, at least on one count we are getting closer to them.

And there is more to come on this front in the time to come.

Stay tuned!

The column was originally published on the Vivek Kaul Diary on February 9, 2016

Economic growth is just 200 years old

deflation
We live in a day and age where economic growth is taken for granted. China was growing at greater than 10% per year for a long time. In the recent past, the growth has slowed down to around 7% per year. If Chinese growth keeps slowing down, the world growth will also slow down.

The United States has grown at around 3% per year, over the long term. The world’s largest economy is now growing at a much slower pace. Economic growth in India has also slowed down over the last few years. And all this has got economists and people who follow such things worried.

Nevertheless, in the context of history, economic growth is a very recent phenomenon, and is just around 200 years old. As John Plender writes in Capitalism—Money, Morals and Markets: “The economist Angus Maddison calculated that in the period from 1500 to 1800, world domestic product per capita[income] grew at an annual average compound rate of just 0.04 percent—one-thirtieth of what has been achieved since 1820.”

While some economists have issues with the methodology Maddison used to arrive at the economic growth number, most agree with the broader point he makes. In fact, economic growth even before 1500 was nothing home to write about.

Why was this the case? There was a great fear of creative destruction that new inventions would unleash. As Daron Acemoglu and James A. Robinson write in Why Nations Fail—The Origins of Power, Prosperity and Poverty: “The fear of creative destruction is the main reason why there was no sustained increase in living standards between the Neolithic and Industrial revolutions. Technological innovation makes human societies prosperous, but also involves the replacement of the old with the new, and the destruction of the economic privileges and political power of certain people.”

Acemoglu and Robison take the example of the Roman Emperor Vespasian, who ruled between AD 69 and 79. The Emperor was approached by a man who had invented a device to cheaply transport heavy columns to the Capitol, the citadel of Rome. This cost the government a lot of money. By adopting the new invention, the government could have saved a lot of money.

The Emperor rejected the invention and declared: “How will it be possible for me to feed the populace?” The invention was rejected because it would have disturbed the way things stood at that point of time. The new device would have put many people out of work. As Acemoglu and Robinson explain: “The innovation was turned down because of the threat of creative destruction, not so much because of its economic impact…Vespian was concerned that unless he kept people happy and under control it would be politically destabilizing.”

A similar logic was used to put many inventions in the cold storage, including few in the textile industry, in the pre-industrial revolution era. The industrial revolution started in Great Britain in the second half of the eighteenth century and gradually spread to other parts of the Europe and the United States.
A major reason why the Industrial Revolution flourished was because governments no longer tried to stop creative destruction. They took it in their stride.  Further, as people and governments saw the benefits of economic growth that new inventions and creative destruction brought in, their approach towards economic activity changed as well. As Plender writes: “Economic activity was no longer perceived as a zero-sum game in which one man’s profit was another’s loss and thus morally questionable. It became easier to make great fortunes from industry and commerce than from land.”

To conclude, there is a lesson in this for Indian government. The only way sustained economic growth can be unleashed is by encouraging new ideas and inventions. This will only happen if the ease of doing business in this country improves. And on that front, there is a lot that still needs to be done.
The column originally appeared in the Bangalore Mirror on August 26, 2015

(Vivek Kaul is the author of the Easy Money trilogy. He tweets @kaul_vivek)

Should a bad monsoon be such a big worry?

monsoon
The India Meteorological Department (IMD) puts out a weekly press release on the monsoon. As per the latest press release: “For the country as a whole, cumulative rainfall during this year’s monsoon has so far upto 01 July been 13% above the Long Period Average (LPA).” The nation’s weather forecaster uses rainfall data for the last 50 years to come up with the long period average.

Hence, the rainfall between June 1 and July 1, 2015, has been 13% above the 50 year average. This is surprising given that IMD has forecast a deficient monsoon this year. In early June it said that the monsoon will be 88% of the long-term average. The IMD also said that the probability of a deficient monsoon was as high as 66% The nation’s weather forecaster uses rainfall data for the last 50 years to define what is normal.

If the rainfall forecast for the year is between 96% and 104% of the 50 year average, then it is categorised as normal. A forecast of between 90% and 96% of the 50 year average is categorised as below-normal. And anything below 90% is categorised as deficient.

The monsoon season is still under progress, hence, whether IMD’s monsoon forecast turns out to be correct remains to be seen. The question that crops up here is-what is the past forecasting record of IMD like? The economists Kaushik Das and Taimur Baig of Deutsche Bank Research have written a report on this. The accompanying chart from Das and Baig’s research report makes for a very interesting reading.


Difference between IMD’s provisional forecast and actual rainfall outcome

Data Source:IMD, Deutsche Bank
As the economists point out: “The chart…shows the variance between the IMD’s provisional forecast (released in April each year) and the actual rainfall outcome during June- September. While IMD’s forecast record has improved since 2010, it becomes clear from the chart below, that the big misses have been more when actual rainfall has been deficient, rather than being excess. The forecast misses for the years 2002, 2004 and 2009 ” which were characterized by severe drought “are particularly striking.”” Time will tell which way the IMD prediction goes this year.

One of the economic worries that cropped out of a deficient monsoon being forecast was that the rural economy will grow at a much slower pace this year than the past. The logic for this is fairly straightforward.

Data from the World Bank shows that only 35.2% of agriculture land in India is irrigated. This means that the remaining land is dependent on rains. And when the monsoon is deficient, it leads to a lower production of agricultural crops.

A lower production of agricultural crops leads to lower income for a section of the farmer. This brings down the spending capability of the farmers, which in turn impacts economic growth in rural India.

Nevertheless, there is more to this argument. India Ratings and Research in an interesting new report conclude that rural income in India over the years has shifted away from agriculture. The accompanying table makes for a very interesting reading. As analysts Sunil Kumar Sinha and Devendra Kumar Pant point out: “A glance at NDP data over the years shows that the share of agriculture in rural NDP has consistently been declining. It declined to 38.9% in FY05 from 70.5% in FY71. Ind-Ra”s calculation shows that the share of agriculture in rural NDP declined further to 29.9% in FY13 considering the changes that Indian economy has witnessed since then.” NDP is essentially the net domestic product and is obtained by subtracting depreciation from the Gross Domestic Product (GDP). GDP measures the economic output of the nation.

Share of Non-agriculture in Rural NDP more than 2/3rd

aInd-Ra projectionData Source:CSO, Ind-Ra
Now what does this mean in simple English? As Sinha and Pant write: “More than two-thirds of the rural income now is non-agricultural income.” The situation has more or less reversed from where it was at the start of the 1970s. Agricultural income made for 70.5% of rural income in 1970-71. Now it is around 29.9%.

What this further means is that the impact of monsoon on rural income has come down over the years. As Sinha and Pant point out: “higher growth of the industrial and services sector in rural areas over the years than of agriculture has increased the share of non-agriculture in rural NDP. This is not surprising because new industrial establishments are increasingly coming up in rural areas due to land/space constraints… industrial expansion in the country is contributing more to the rural economy than urban economy.”

What this clearly tells us is that the impact of monsoon on rural income and in the process rural consumption has been over rated over the years. While there is a link clearly, it is not as strong as it was in the past. And that is an important learning.

The column originally appeared on The Daily Reckoning on July 7, 2015

What we can learn about Indian economic growth from the Second World War


On May 29, 2015, the ministry of statistics and programme implementation declared the gross domestic product (GDP) growth numbers for the last financial year 2014-2015, as well as the period between January and March 2015. The GDP is a measure of the size of an economy, and the GDP growth is essentially a measure of economic growth.
The GDP growth for 2014-2015 came in at 7.3%, whereas the GDP growth between January and March 2015 stood at 7.5%. The trouble is that these numbers which are theoretical constructs don’t seem believable once we start looking at real economic numbers.
Bank lending remains subdued. So do car sales. Corporate profitability is at a one decade low. And exports are stagnant. Capacity utilization continues to remain bad. And so does investment. In fact, the Reserve Bank of India governor, Raghuram Rajan even said the following, in an interaction he recently had with the media: “In the eyes of the rest of the world, it is a discrepancy why we feel the need for rate cuts when the economy is growing at 7.5%. Most economies growing at 7-7.5% are just going gang-busters and the issue there would be to restrain rather than accelerate growth.”
It seems that the Indian GDP number may have become a victim of what economists call the “survivor bias”. Before I get into explaining this bias some background information is necessary. In late January earlier this year, the ministry of statistics and programme implementation released a new method to calculate the GDP.
In the old method of calculating the GDP one of the key sources of information about the private sector was the RBI Study on company finances, which took into account financial results of around 2500 companies. The new GDP series uses the database of ministry of corporate affairs (MCA).
As Deep N Mukherjee of India Ratings recently wrote in a column on Firstpost: “The new series justifiably attempts to increase the coverage of the corporate sector and has used the MCA21 database maintained by the ministry of corporate affairs. Approximately 14 lakh companies are registered with MCA, of which 9.8 lakh companies are active. Post filtering for data availability, 5 lakh companies have been analysed and used for GDP estimation for 2011-12 and 2012-13.”
On the face of it, this sounds like a good thing to do. The trouble is that since 2013-2014, the number of companies on the database has come down to 3 lakhs.
“This is an outcome of companies not reporting possibly because they are closing down their operations. Thus, if out of 5 lakh companies 2 lakh have not reported, it should normally set alarm bells ringing about the economy. How the current methodology addresses this ‘survivor bias’ in the data is not clear,” writes Mukherjee.
And what is survivor bias? Let me recount a story from the Second World War in order to explain this. During the Second World War, the British Royal Air Force (RAF) wanted to protect its planes from the German anti-aircraft guns and fighter planes. In order to do that it wanted to attach heavy plating to its airplanes.
The trouble was that the plates that were to be attached were heavy and hence, they had to be strategically attached at points where bullets from the Germans were most likely to hit.
An analysis revealed that the bullets were hitting a certain part of the plane more than the other parts. As Jordan Ellenberg writes in How Not to Be Wrong: The Hidden Maths of Everyday Life: “The damage[of the bullets] wasn’t uniformly distributed across the aircraft. There were more bullet holes in the fuselage, not so many in the engines.”
This essentially suggested that the area around the fuselage was getting hit the most by bullets and that is the area that had to be plated. Nevertheless, the German bullets should also have been also hitting the engine because the engine “is a point of total vulnerability”.
A statistician named Abraham Wald realised that things were not as straight forward as they seemed. As Ellenberg writes: ‘The armour, said Wald, doesn’t go where bullet holes are. It goes where bullet holes aren’t: on the engines. Wald’s insight was simply to ask: where are the missing holes? The ones that would have been all over the engine casing, if the damage had been spread equally all over the plane. The missing bullet holes were on the missing planes. The reason planes were coming back with fewer hits to the engine is that planes that got hit in the engine weren’t coming back.” They simply crashed.
As Gary Smith writes in Standard Deviations: Flawed Assumptions Tortured Data and Other Ways to Lie With Statistics: “Wald…had the insight to recognize that these data suffered from survivor bias…Instead of reinforcing the locations with the most holes, they should reinforce the locations with no holes.”Wald’s recommendations were implemented and ended up saving many planes which would have otherwise gone down.
Interestingly, survivor bias is a part of lot of other data as well and leads to wrong analysis at times. Take the data for judging the performance of mutual funds over a long period of time. The numbers typically end up overstating the returns earned primarily because something’s missing. As Ellenberg writes: “The funds that aren’t. Mutual funds don’t live forever. Some flourish, some die. The ones that die are, by and large, the ones that don’t make money. So judging a decade’s worth of mutual funds by the ones that still exist at the end of ten years is like judging our pilot’s evasive manoeuvres by counting the bullet holes in the planes that come back.” Hence, it makes sense to be sceptical about any mutual fund study that shows high returns. The first question you should be asking is whether the study has taken the performance of dead funds into account or not.
Now how is this linked to the Indian GDP? It is possible that the data being used to calculate the Indian GDP is not taking into account the fact that out of the five lakh companies on the MCA database around two lakh companies have not reported their numbers and may have possibly been shutdown. And if that is the case the corporate growth numbers are possibly being overstated and in the process pushing up the overall GDP number as well.
The economists need to be able to crack this puzzle and tell us the real story.

The column originally appeared on The Daily Reckoning on June 10, 2015 

Why economic growth cannot be taken be for granted

safety-of-chit

Mrs. Lintott: Now. How do you define history Mr. Rudge?
Rudge: Can I speak freely, Miss? Without being hit?
Mrs. Lintott: I will protect you.
Rudge: How do I define history? It’s just one fuckin’ thing after another.

Alan Bennett, The History Boys


Economists these days do not give much importance to economic history. As Cambridge University economist Ha-Joon Chang writes in
Economics—The User’s Guide: “Many people consider economic history [emphasis in the original], or the history of how our economies have evolved, especially pointless. Do we really need to know what happened two, three centuries ago.”
Nevertheless, a good understanding of economic history is necessary to ensure that we don’t take things for granted. Take the case of economic growth. In the times that we live in we take rapid economic growth for granted. But for much of humankind that wasn’t the case. As best-selling author and economist Tim Harford put it in a column “Economic growth is a modern invention: 20th-century growth rates were far higher than those in the 19th century, and pre-1750 growth rates were almost imperceptible by modern standards.”
Chang makes this point in his book. Between 1000AD and 1500AD, per capita income, or the income per person, grew by 0.12% per year in Western Europe. What this means is that the average income in 1500 was only 82% higher than that in 1000. “To put it into perspective, this is a growth that China, growing at 11 per cent a year, experienced in just six years between 2002 and 2008. This means that, in terms of material progress, one year in China today is equivalent to eighty-three years in medieval Western Europe,” writes Chang.
Further, at 0.12% Western Europe was growing at a very fast pace in comparison to other parts of the world. Asia and Eastern Europe during the same period grew at 0.04% per year. Hence, by 1500 the per capital income in these parts of the world would have been 22% higher than that in 1000.
Things did not improve in the centuries to come. Between 1500 and 1820, the per capita income in Western Europe averaged at 0.14% per year, which wasn’t very different from 0.12% per year, earlier. Some countries like Great Britain and Netherlands which were busy building a global empire and had also got a central bank going, grew a little faster at 0.27% and 0.28% respectively. So by modern standards the world was in a depression between 1000AD and 1820AD.
Things improved over the next 50 years. Between 1820 and 1870, the per capita income for Western Europe grew by 1% per year, which was significantly higher than anything the world had seen earlier.
One reason for this turbo-charged growth was the start of the industrial revolution. In the years leading to 1820 many new production technologies were invented. “In the emergence of these new production technologies, a key driver was the desire to increase output in order to be able to sell more and thus make more profit,” writes Chang.
Along with this, the evolution of banks and the financial system also helped. “With the spread of market transactions, banks evolved to facilitate them. Emergence of investment projects requiring capital beyond the wealth of even the richest individuals prompted the invention of the
corporation, or limited liability company, and thus the stock market,” writes Chang. And this helped enterprises raise the money required to start a business, something which is at the heart of capitalism.
After 1870, the production technologies kept improving. The economist Robert Gordon divides invention and discoveries into three eras. The second era came between 1870 and 1900 and according to him had the maximum impact on the economy in particular and the society in general.
As he writes in a research paper titled 
Is US Economic Growth Over? Faltering Innovation Confronts the Six Headwinds “Electric light and a workable internal combustion engine were invented in a three-month period in late 1879…The telephone, phonograph, and motion pictures were all invented in the 1880s. The benefits…included subsidiary and complementary inventions, from elevators, electric machinery and consumer appliances; to the motorcar, truck, and airplane; to highways, suburbs, and supermarkets; to sewers to carry the wastewater away,” writes Gordon.
Based on Gordon’s research paper, Martin Wolf wrote in the Financial Times: “Motor power replaced animal power, across the board, removing animal waste from the roads and revolutionising speed. Running water replaced the manual hauling of water and domestic waste. Oil and gas replaced the hauling of coal and wood. Electric lights replaced candles. Electric appliances revolutionised communications, entertainment and, above all, domestic labour. Society industrialised and urbanised. Life expectancy soared.”
In fact, Gordon makes an interesting observation regarding this increase in productivity by comparing motor power to a horse. As he writes: “Motor power replaced animal power. To maintain a horse every year cost approximately the same as buying a horse. Imagine today that for your $30,000 car you had to spend $30,000 every year on fuel and repairs. That’s an interesting measure of how much efficiency was gained from replacing the horses.”
And all these inventions drove economic growth. As Bill Bonner told me in an interview I did with him a few years back: “Trains were invented 200 years ago. Automobiles were invented 100 years ago. Aeroplanes came on the scene soon after. Electricity – fired by coal, oil…and later, atomic power – made a big change too. But all the major breakthroughs date back to a century or more. Even atomic power was pioneered a half century ago. Since then, improvements have been incremental…with diminishing rates of return from innovations.”
These game changing inventions are now a thing of the past. Harford explained this to me through a couple of brilliant examples when I interviewed him for The Economic Times a few years back. As he told me: “The 747 was a plane that was developed in the late 1960s. The expectation of aviation experts is that the Boeing 747 will still be flying in the 2030s and 2040s and that gives it a nearly 100 year life span for its design. That is pretty remarkable if you compare what was flying in 1930s, the propeller aeroplanes. In the 1920s they didn’t think that it was possible for planes to fly at over 200 miles an hour. There was this tremendous progress and then it seems to have slowed down.”
The same seems to be true for medicines. “Look at medicine, look at drugs, antibiotics. Tremendous progress was made in antibiotics after 1945. But since 1980 it really slowed down. We haven’t had any major classes of antibiotics and people started to worry about antibiotic resistance. They wouldn’t be worried about antibiotic resistance if we thought we could create new antibiotics at will,” Harford added.
So the basic point is that growth of economic productivity has petered out over the last few decades because game changing inventions are a thing of the past. These game changing inventions changed the Western countries (i.e. the US and Europe) and helped them rise at a much faster rate than rest of the world. But that might have very well been a fluke of history.
Nevertheless, what these game changing inventions did was that they led to the assumption that economic growth will continue forever. But will that turn out to be the case? As Gordon wrote in his research paper: “Economic growth has been regarded as a continuous process that will persist forever. But there was virtually no economic growth before 1750, suggesting that the rapid progress made over the past 250 years could well be a unique episode in human history rather than a guarantee of endless future advance at the same rate.”
And this might very well come out to be true. The core of Gordon’s argument is that modern inventions are less impressive than those that happened more than 100 years back. “Attention in the past decade has focused not on labor-saving innovation, but rather on a  succession of entertainment and communication devices that do the same things as we could do before, but now in smaller and more convenient packages. The iPod replaced the CD Walkman; the smartphone replaced the garden-variety “dumb” cellphone with functions that in part replaced desktop and laptop computers; and the iPad provided further competition with traditional personal computers. These innovations were enthusiastically adopted, but they provided new opportunities for consumption on the job and in leisure hours rather than a continuation of the historical tradition of replacing human labor with machines,” writes Gordon.
And that isn’t happening anymore.

The column originally appeared on The Daily Reckoning on May 14, 2015