Has Arun Jaitley Been Reading India’s Big Government?

indias-big-goverment-book

Self-employment is the new buzzword in the Narendra Modi government. And it is going to rescue the one million youth that are entering the workforce every month. Or at least that is what we are being told.

As finance minister Arun Jaitley recently told ET Now“Bulk of the jobs in India are created by SMEs, by the micro industries, by self employment. Gone are the days where only the government sector created jobs in the government or the organised sector created jobs.”

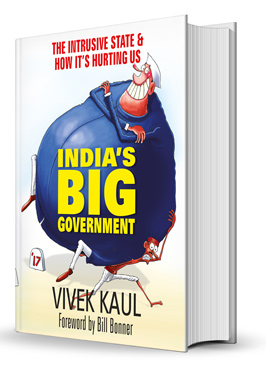
This statement sort of makes me feel that Mr Jaitley has been reading my book India’s Big Government. (The good news is that the book is available at a huge discount on Amazon till Friday, 27th October. The Kindle version is going at Rs 199, against a maximum retail price of Rs 749, and the paperback is going at Rs 499, against a maximum retail price of Rs 999.). What Jaitley said in his statement are some of the points that I make in the book as well:

  • The government (includes all forms from central government to state government to central public sector enterprises etc.) do not create jobs anymore.
  • Globally, the small and medium enterprises as they grow bigger, end up creating a bulk of the jobs.
  • In India, the unorganised/informal sector creates a bulk of the jobs. This is something that the Economic Survey of 2015-2016 points out: “The informal sector should… be credited with creating jobs and keeping unemployment low.”

The thing is that there is nothing new in this. Self-employment may have become the new buzzword with ministers of the Narendra Modi government, but it has been around for a while.

As the report titled Ease of Doing Business: An Enterprise Survey of Indian States: “A major challenge in India has been the preponderance of employment in very small enterprises. Formal sector jobs that exhibit high productivity and pay high wages are limited. According to the latest Economic Census, conducted during 2013 and the first quarter of 2014, of 131 million workers in industry and services, 44.4% were employed in Own Account Enterprises (OAE), which are managed exclusively by their owners and do not employ a single regular worker. Establishments with five or fewer workers, including the OAE, employed 69.5% workers and those with nine or fewer workers employed 79% workers. In other words, establishments with 10 or more workers employed just 21% of the workers in industry and services.”

The above paragraph says multiple things. Let’s look at them one by one.

  1. According to the latest Economic Census, conducted during 2013 and the first quarter of 2014, of 131 million workers in industry and services, 44.4% were employed in Own Account Enterprises (OAE), which are managed exclusively by their owners and do not employ a single regular worker.

    Own account enterprises form a bulk of total Indian firms in services and industry. What does this mean? It basically means that anyone who does not find a job, drifts towards self-employment. Further, he starts small and continues to remain small.

    Jaitley in his interview said that in order to promote self-employment “you have to have a skilling campaign which is going on.” Skilling is very important, given that the Indian education system doesn’t exactly make people employable. This is a point that I make in great detail in India’s Big Government.

    The trouble is that skilling is not happening at the scale that it needs to. Let’s take a look at how things panned out in 2016-2017. The different ministries in the government had accepted a target of training 99,35,470 individuals. Of this, only 19,58,723 or around less than one-fifth had been trained up to December 2016.

    As I keep pointing out, nearly 1.2 crore individuals are entering the workforce every year. This means a bulk of them continue to remain unskilled. At this rate a huge number of people who are and will enter the workforce over the next few years, will continue to remain unskilled. And given that their chances of creating social mischief remain high.

    One challenge the government (and even the private sector) is facing as it tries to scale up skilling quickly is the shortage of individuals who can impart skill training. To get around this, to some extent, the talent and experience of the retired personnel of the army as well as the railways could be used. Between them, the army and the railways have many personnel who introduce, maintain and upgrade electrical and mechanical equipment of various kinds for their own use.i

  2. Establishments with five or fewer workers, including the OAE, employed 69.5% workers and those with nine or fewer workers employed 79% workers. In other words, establishments with 10 or more workers employed just 21% of the workers in industry and services.

    This basically means that most Indian firms start small and continue to remain small. (Again, this is a point that I have made multiple times). So, just saying that small and medium enterprises create jobs, is not enough. They create many sasjobs only if they grow bigger, which in India is clearly not the case with close to 80 per cent of the firms employing less than ten workers.

    So, self-employment and small and medium enterprises creating jobs, are solutions if they are allowed to grow bigger. Currently, that is not the case due to various reasons like rigid labour laws, the lack of ease of doing business and so on.

In the recent past, the informal sector has been declared to be a bad thing because it does not pay its share of taxes. The question is, does it really need to pay taxes? The own-account enterprises form a large part of this sector. And people running these firms, clearly do not make enough money to be paying taxes. Take a look at Table 1.

Table 1: Self Employed/Regular wage salaried/Contract/Casual Workers according to
Average Monthly Earnings (in %) All India 

Table 1 clearly shows that 96 per cent of the self-employed make up to Rs 2,40,000 a year. Income up to Rs 2,50,000 per year does not come under tax bracket. This basically means that a large section of the informal sector in India simply does not pay tax because it does not earn enough to pay tax.

As economist Jim Walker of Asianomics wrote in a research note sometime back: “There is nothing intrinsic that says that the informal economy is a less effective or beneficial source of activity than the formal economy.” This is something that the Modi government needs to understand.

In its quest for more taxes, it is working towards destroying large parts of the informal economy, which is a huge part of Indian economy.

Yes, self-employment is important. But then the government is saying one thing and doing exactly the opposite thing. What explains this dichotomy?

The column originally appeared in Equitymaster on October 23, 2017.

The Real Returns from Real Estate Have Been Very Low

250px-Underconstruction_Building

The best way to challenge myths is to look at data. The trouble is that India’s real estate sector is very opaque and does not give us enough data points to do a proper job of analysing it. In the process, the myth that any real estate investment yields massive amounts of returns at all points of time, continues to persist.

Thankfully, now we have some data which we can use. Sometime back, the National Housing Bank (NHB), the regulator of housing finance companies, launched a revamped RESIDEX, a housing price index. The index claims to offer home prices of 50 cities across the nation though I could find data for only 49. In this column, I look at data referred to as HPI@Assessment Prices based on the information furnished by banks and other lending agencies regarding home prices.

This should help us get some idea about which way the real estate prices have gone over the last few years. And for the first time we should be able to calculate the actual city wise returns. This should give all the real estate bhakts out there some idea of how their investments have done over the years.

As I said at the beginning, the NHB RESIDEX has price data for 50 cities. Let’s take a look at Table 1. It shows the per year returns of these cities between June 2013 and March 2017. It also shows the one-year return between March 2016 and March 2017. While the NHB RESIDEX claims to have data from 50 cities, I could find data only for 49 cities.

Also, even though it has data from 50 cities, it can’t claim to be a pan India index given that many of the cities represented separately are essentially the satellite cities of some of the bigger cities like Mumbai, Delhi and Kolkata. Further, some of the bigger cities in states haven’t found representation in the index. These include Jamshedpur in Jharkhand, Madurai in Tamil Nadu, Jalandhar in Punjab, Allahabad and Varanasi in Uttar Pradesh.

Nevertheless, the index is a good start which can give us a good sense which way the real estate market in India is headed. Also, it will give us a good idea of how well or badly has the real estate market in India performed, over the last few years. Typically, this sort of information is rarely available in the public domain and will allow us to settle once and for all, how good an investment real estate has been over the last few years.

Table 1: 

Name of the cityReturn per year between June 2013 and March 2017 (in %)One-year return between March 2016 and March 2017 (in %)
1Mumbai6.72.8
2Delhi-2.65.8
3Bengaluru7.37.5
4Kolkata6.52.9
5Chennai7.110
6Pune7.29.5
7Nagpur5.611.2
8Nashik2.5-0.25
9Kalyan Dombivali8.67.4
10Mira Road-Bhayander5.112.9
11Navi Mumbai3.4-8.9
12Panvel2.9-7.1
13Thane7.12
14Vasai Virar3.22.3
15Chakan60.7
16Pimpri Chinchwad5.23.5
17Coimbatore-0.8-10.5
18Ahmedabad0.56.8
19Surat3.53.6
20Vadodra1.67.9
21Rajkot2.50.3
22Gandhinagar-7.8-11.1
23Kanpur8.311.3
24Lucknow4.71.9
25Meerut13.56
26Ghaziabad2.99.7
27Greater Noida4.30
28Noida2.70
29Howrah10.515.6
30New Town Kolkata4.2-7.8
31Bidhanagar excluding Rajarhat5.4-1.8
32Chandigarah(Tricity)2.1-5.4
33Ludhiana4.80
34Faridabad3.712.3
35Gurugram4.87.4
36Jaipur5.2-1.5
37Bhiwadi1.6-14
38Indore6.26.9
39Bhopal3.20.4
40Vizag10.324.7
41Vijaywada8.81.2
42Kochi6.84.1
43Thiruvananthapuram7.7-0.5
44Hyderabad4.12.2
45Patna2.6-7.1
46Guwahati48.2
47Dehradun04.8
48Ranchi-2.6-17.7
49Bhubaneswar1.57.5

Source: Author calculations on data obtained from https://residex.nhbonline.org.in/NHB_Residex.aspx 

Table 1 makes for a very interesting reading. If we look at returns per year across different cities from June 2013 onwards, very few cities have given a return of greater than 10 per cent year, which is what is needed, in order to meet the regular expenses for upkeep of real estate, along with beating the rate of inflation. Regular expenses would include the maintenance charge that needs to be paid to the housing society every month and a property tax that needs to be paid every year. Of course, the home could be put on rent, the rental yield would work out to around 2 per cent per year. (rental yield is essentially annual rent divided by the market price of the home). If you had bought the home on a loan, then interest would have to be paid on the loan. But a tax deduction would also be available.There are only three cities which have given a return of greater than 10 per cent per year (Meerut, Howrah and Vizag), since June 2013.

In fact, the median rate of return on real estate investment across the 49 cities is 4.3 per cent per year. As John Allen Paulos writes in Beyond Numeracy: “The median of a set of numbers is the middle number in the set.”

Hence, it is easy to see that unless a massive amount of black money has been invested in real estate, the returns have been meagre across the country since June 2013. This is the point from which the NHB RESIDEX data is available, in case you are wondering, dear reader, as to why have we taken this as a cut off.

The situation has gotten worse in the one-year period between March 2016 and March 2017. The median rate of return has fallen to 2.8 per cent. In fact, if we remove Vizag where one year return has been close to 25 per cent return during this period, the median rate of return falls to 2.55 per cent. Money in a savings bank account would have yielded more.

This basically means that real estate returns across the country have been subdued lately. In fact, between March 2016 and March 2017 prices have fallen in 13 out of the 49 cities under consideration. This is if we just look at prices. If we take other expenses into account (maintenance charges, property tax, interest paid on a home loan after adjusting for the tax benefit and inflation etc.) into account, the real returns would be negative in many other cases.

Of course, this logic works on weighted average prices for cities and individual experiences may have been different. Also, the logic could have been completely different if black money was being invested to buy real estate.

Hence, real estate as an investment hasn’t gone anywhere in the last four years and the situation has only worsened in the last one year. Having said that prices are not falling. This, despite the sales crashing in the aftermath of demonetisation.

Recently, the real estate consulting firm PropEquity released some interesting data. As per the data, for the period between January and May 2017, the housing sales fell by 41 per cent to 1.1 lakhs, across 42 major cities. During the same period in 2016, the housing sales had stood at 1.87 lakh.

But as we have seen the median price hasn’t really fallen between March 2016 and March 2017. While, real estate hasn’t made for a great investment for a while now, it hasn’t reached a stage where those actually wanting a home to live in, can buy one, in most cities. What are the reasons for the same?

a) Those who have already invested in real estate have a substantial amount of black money invested in it. The trouble is that if they sell right now, there isn’t much they can do with the black money that they will get in the form of cash after the sale. This is because black money generated by real estate finds its way into real estate all over again. But given the very low returns that real estate has given over the last few years, there is no point in doing that.

b) In some cases, the investors are sitting on losses and they are waiting for prices to rise before they will sell. As Richard Thaler writes in Misbehaving-The Making of Behavioural Economics: “Roughly speaking, losses hurt about twice as much as gains make you feel good.” This basically leads to a tendency among investors who are facing losses on their investment to continue to hold on to the losses, until they reach the positive territory again. This leads to a slow correction in prices.

c) In some other cases, investors are anchored on to the high returns that their friends, relatives and acquaintances, had made during the go go years of real estate between 2002 and 2011. They are waiting for that era to return. We wish them luck.

d) Up until last year, home loans taken to finance self-occupied homes, were allowed a deduction of up to Rs 2 lakh for the interest paid on the home loan against taxable income.

For home loans taken to finance non-self-occupied homes, any amount of interest on the home loan could be deducted to arrive at taxable income. This was allowed as long as the real rent (if the home was rented out) or the notional rent (if the home wasn’t rented out, but the rent the home owner was likely to earn if he would rent it out), was adjusted against it.

Typically, given the high home prices, the interest paid on a home loan these days, is many times the rent a home is likely to earn, if rented out. This essentially ensures that by buying a second home (or a third or a fourth or fifth home…), individuals could create a massive tax deduction and bring down their taxable income dramatically. The corporate crowd used this anomaly with great success by buying second and third homes, as they went up the hierarchy.

This basically ensured that even if the investment was not yielding any returns in terms of price increase, the tax arbitrage available was good enough to stay invested.

In his budget speech, the finance minister Arun Jaitley limited all such deductions (for self-occupied as well as other homes financed through home loans) to Rs 2 lakh. This has basically ensured that the market for homes to be create a tax deduction has now effectively come to an end. Whether this has an impact on prices remains to be seen.

To conclude, without a genuine price correction the mess in the real estate sector is likely to continue. Investors have sustained the sector for many many years now. It’s time the real estate companies realised this. If they want to continue to make money in the years to come, it’s time they addressed the genuine home buyers as well.

Until that happens, we don’t see any acche din for this sector.

Note: This originally appeared as a part of the Vivek Kaul Letter on July 14, 2017.

The column originally appeared on July 17, 2017, on Equitymaster.

Post Demonetisation Real Estate Sales Have Collapsed, But Prices Haven’t

250px-Underconstruction_Building

It has been a while since I wrote anything on real estate and the only reason for it is the sheer lack of data on the sector.

Recently, the real estate consulting firm PropEquity released some interesting data and that gave me sufficient reason to write one more piece on real estate.

As per the data, f or the period between January and May 2017, the housing sales fell by 41 per cent to 1.1 lakhs, across 42 major cities. During the same period in 2016, the housing sales had stood at 1.87 lakh.

The interesting thing is that the launch of new homes has also come down considerably. For the first five months of the current year, which are under consideration here, the launch of new homes fell by 62 per cent to 70,450 units. During the same period in 2016, the launch of new homes had stood at around 1.86 lakh.

The new home launches are a good indicator of the appetite investors have for real estate. And that has clearly come down big time. So, what is happening here? One, people are not buying ready to move in homes from builders. And two, they aren’t interested in under-construction property, where investment returns tend to be very high, either.

Why has that been the case? Typically, a significant portion in any real estate deal tends to be carried out in black. When going about a real estate deal, a significant part of the transaction is in the form of cash which changes hands, and for which there is no record. This cash may be black money where no taxes have been paid. Or it could even be white money, where taxes have been paid, but which is now becoming black.

For most of the period January to May 2017, there wasn’t enough sufficient cash going around in the financial system. This was because of the demonetisation announced on November 8, 2016, by the prime minister Narendra Modi.

Take a look at Figure 1. It plots the gap between the currency under circulation as on November 4, 2016 (a few days before demonetisation) and at the end every week between January and May 2017.

Figure 1:

What does Figure 1 tell us? On January 6, 2017, the currency in circulation was around 50 per cent of the currency in circulation as on November 4, 2016. This meant that the gap was also around 50 per cent. Since then, the currency in circulation has kept increasing every week, as the RBI has printed and pumped money into the financial system, and this has led to the gap coming down. Hence, as on May 26, 2017, the currency in circulation was at around 83 per cent of the currency in circulation as on November 4, 2016. Given this, the gap had come down to around 17 per cent.

So, what does this tell us? It tells us that there wasn’t enough cash going around in the financial system for people to carry out transactions in cash. Given this, people were not in a position to pay the black part of any real estate transaction in cash. This essentially meant that real estate transactions collapsed and were down by 41 per cent during the first five months of the year.

It also tells us that many of those who wanted to sell real estate just sat on it, instead of carrying out the transaction in 100 per cent white amount, as was the hope post demonetisation.

By the end of March 2017, the financial system had nearly 75 per cent of the currency in circulation as on November 4, 2016. The point being that there was enough money to go back to making black payments as a part of real estate transactions. But that doesn’t seem to have happened, with new home launches down by a whopping 62 per cent during the period.

One answer for that might lie in a change that finance minister Arun Jaitley made in this year’s budget. Up until last year, home loans taken to finance self-occupied homes, were allowed a deduction of up to Rs 2 lakh for the interest paid on the home loan against taxable income.

For home loans taken to finance non-self-occupied homes, any amount of interest on the home loan could be deducted to arrive at taxable income. This was allowed as long as the real rent (if the home was rented out) or the notional rent(if the home wasn’t rented out, but the rent the home owner was likely to earn if he would rent it out), was adjusted against it.

Typically, given the high home prices, the interest paid on a home loan these days, is many times the rent a home is likely to earn, if rented out. This essentially ensures that by buying a second home, individuals could create a massive tax deduction and bring down their taxable income dramatically. The corporate crowd used this anomaly with great success by buying second and third homes, as they went up the hierarchy. And after buying these homes, they kept it locked, thus creating a shortage for homes available for rent.

In his budget speech, the finance minister Arun Jaitley limited all such deductions (for self occupied as well as other homes financed through home loans) to Rs 2 lakh. This has basically ensured that the market for homes to be create a tax deduction has now effectively come to an end.

This is another factor which has basically ensured that the demand for finished homes as well as under-construction property has come down dramatically during the first five months of this year.

Regular readers would know that I have been recommending this for a few years now. In an era of exceptionally high home prices, why should the government be encouraging people to buy homes in order to benefit from a massive tax deduction. Also, those who buy more than one home, aren’t exactly poor. Hence, why pander them like this? So, finally after many years this anomaly has thankfully been done away with.

This brings us to the last and the most important point of the piece. While, the sales and prospective sales of real estate have come down dramatically, what has the impact been on the prices front?

The National Housing Bank relaunched its real estate index RESIDEX yesterday. As per the press release: “NHB RESIDEX for January-March,2017 revealed that price indices for residential properties based on actual market prices for ongoing construction prices have increased over the previous quarter in 24 of the 47 cities covered in the Index including in Jaipur, Chennai, Lucknow, Guwahati, Howrah, Hyderabad, Bidhannagar etc. In Delhi, Faridabad, Chandigarh, Patna and Nashik etc, prices have come down.”

What this tells us is that the broader trend in prices across India hasn’t gone anywhere post demonetisation. On the whole prices haven’t changed much What does this tell us? It tells us that builders have great staying power. The amount of money that they have made and stashed away in the real estate bull run between 2002 and 2011, allows them a tremendous staying power.

Also, many real estate companies are fronts for politicians and there is no point for them in annoying politicians by cutting prices and selling homes. Instead of selling homes at lower prices, the builders would rather sit on it, and which is what they are doing.

The trouble with this is that the longer they do this, the longer the time correction of prices will last i.e. the prices may not go down in nominal terms, but if we take inflation into account over the years, they would have gone down substantially.

The thing is that this time correction is not enough. If the real estate market has to revive, actual real estate prices need to fall. Yeah, I know I have been repeating this like a cuckoo clock over the years, but that is the only way out of the mess that prevails.

Postscript: In the next edition of the Vivek Kaul Letter, I will be discussing the newly launched NHB RESIDEX index in detail. For the first time, there is some detailed price data that has been made available across multiple cities. And that should make for an interesting piece of analysis and reading. Do keep a lookout.

The column originally appeared on Equitymaster on July 11, 2017.


Farm loan waive offs are really not a solution, only temporary relief

Farm_Life_Village_India

On June 11, 2017, Devendra Fadnavis, the chief minister of Maharasthra, decided to follow his Uttar Pradesh counterpart, Yogi Adityanath, in waiving-off loans to farmers in Maharashtra. The loans of small and marginal farmers have been waived off with immediate effect.

As far as other farmers are concerned, a committee has been set up to decide on a criteria for a further waive off. Initial estimates being made in the media suggest that this loan waiver will cost the Maharashtra government anywhere between Rs 25,000 crore to Rs 30,000 crore.

The union finance minister Arun Jaitley has refused to finance farm loan waive offs of the state governments. Given this, the government of Maharashtra will have to finance this waive off on its own, in order to repay the banks which have given these loans.
How will this impact the finances of the government of Maharashtra? In 2017-2018, the government of Maharashtra was expected to run a fiscal deficit of Rs 37,789 crore or 1.53 per cent of the GDP. Fiscal deficit is the difference between what a government earns and what it spends. (The source of all the numbers reflecting the financials of the Maharashtra government is http://www.prsindia.org/uploads/media/State%20Budget%202017-18/Maharashtra%20Budget%20Analysis%202017-18.pdf)

The loan waive offs to the farmers is expected to cost the farmers Rs 25,000 crore to Rs 30,000 crore. The state will have to finance this through borrowing more and this will add to the fiscal deficit of the state. At the upper level of Rs 30,000 crore, this would mean that the fiscal deficit would jump to Rs 67,789 crore or 2.74 per cent of the state gross domestic product (GDP), if everything else remains the same.

Even with the farm loan waiver the state’s fiscal deficit will be well within the 3 per cent limit that had been prescribed by the 14th Finance Commission. Having said that this borrowing will not do any good to the overall borrowings of Maharashtra.

In 2017-2018, the total debt of the government of Maharashtra is expected to be a little over Rs 4.13 lakh crore. The farm loan waiver will add another Rs 30,000 crore to this. In absolute terms, Maharashtra is the most indebted among all states in the country.

Though when expressed as a percentage of the state’s GDP, this comes to around 18 per cent of the state’s GDP, which is not very high in comparison to other states.

While the finance minister Arun Jaitley has stayed away from financing the farm loan waive offs of state governments, the question is does it really matter? The central government actually guarantees the debt taken on by the state government. Hence, in effect, the borrowings of the state governments are also effectively liabilities of the central government.

The only thing that Jaitley’s stance does is that it keeps the fiscal deficit of the central government under control. But the overall fiscal deficit of the central government and the state governments does go up, and that is the figure that matters.

The overall fiscal deficit of states has been a reason for worry in the recent past. In 2013-2014, the overall fiscal deficit of the state governments stood at 2.2 per cent of the GDP. This jumped to 3.6 per cent of the GDP in 2015-2016 before falling to 2.9 per cent of the GDP in 2016-2017.

With states like Maharashtra and Uttar Pradesh before it, waiving off loans to farmers, the overall fiscal deficit of the states, will go up again in 2017-2018. More states are expected to follow suit. Demands are already being made in states like Punjab and Tamil Nadu for farm loan waivers. Given that several states have already waived off loans to farmers, other states will find it difficult not to waive off loans, as and when the demands start coming in.

This will push up the overall fiscal deficit of the nation.

When governments borrow more, they crowd out private borrowing and in the process, push up interest rates. While, the likelihood of something like this happening immediately are low because the growth in private borrowing remains slow. But as and when the economy picks up, there will be a problem.

Also, newsreports suggest that farmers have now started defaulting on their loans in expectation of the government of the state that they live in, waiving off their loan. In economics, this is termed as a moral hazard.

The economist and former Vice-Chairman of the Federal Reserve of the United States, Alan Blinder, writing in After the Music Stopped, says that “the central idea behind moral hazard is that people who are well insured against some risk are less likely to take pains (and incur costs) to avoid it”. In this context, it means farmers defaulting on their loans in expectation of them being waived off. It also leads to a deterioration in the credit culture, with farmers being expected their debts to be waived off even in the future.

Also, waive offs do not solve any of the structural problems of Indian agriculture. The biggest problem of Indian agriculture is that it employs many more people than it should. Agriculture employs close to half of India’s workforce and contributes around 14 per cent of the GDP. Clearly, people need to be moved away from agriculture. But for that low-skill jobs need to be created elsewhere, which is not happening.

Further, the average plot size on which agriculture is carried out over the years, has fallen dramatically over the years, making agriculture unviable in many cases. But it’s not easy to buy or sell agri land, given the change in land usage norms, or even otherwise. This makes it difficult for farmers to unlock some value of their land and raise the capital for doing something else.

Also, it does not help that infrastructure to sell and store agriculture produce in the country remains pathetic. Take the case of pulses. 2016-2017 was a year of bumper production in pulses, with the production going up by more than 35 per cent. But with very little storage facilities, farmers have had to make distress sales and the price of pulses has fallen by 19.5 per cent in May 2017, in comparison to the same period last year.

Unless, these wrongs are set right, waive offs of loans to farmers are only going to offer temporary relief to the farmers, and things will be soon back to as they were earlier.

The column appeared in www.business-standard.com on June 14, 2017

Digital Transactions Were Growing Faster Before Demonetisation

The finance minister Arun Jaitley recently said: “Through demonetisation, the government created a new normal, with a big step in removing the earlier scenario of cash economy and shadow economy.”

If this is true then there should have been a substantial jump in digital transactions in the recent past. If people are not carrying transactions in the cash economy, then they should be carrying out transactions digitally. But is that true?

Let’s first look at the number of digital transactions (i.e. volume of digital transactions) that have happened every month between November 2016, when the demonetisation of Rs 500 and Rs 1,000 notes was announced, and May 2017, the latest monthly data available. All the digital data used in the column deducts the transactions carried out through Real Time Gross Settlement system simply because it is not a retail mode of digital transactions, which is primarily what we are looking at here. The minimum amount that can be transferred through this mode is Rs 2 lakh.

Take a look at Figure 1. This basically plots the total number of digital transactions that have happened between November 2016 and May 2017.

Figure 1: 

As is clear from Figure 1, the volume of digital transactions peaked in December 2016, when the impact of demonetisation was at its peak. With very little currency available to carry out transactions, people had no option but to use digital modes of settling transactions. In May 2017, the total number of digital transactions was down by 11.4 per cent in comparison to December 2017. This clearly tells us that fewer people are using digital modes of transactions in comparison to the period right after demonetisation.

Now take a look at Figure 2. In this we look at the total value of digital transactions carried out every month between November 2016 and May 2017.

Figure 2: 

From Figure 2, it is clear that the total value of digital transactions peaked in March 2017, and has fallen by 20.2 per cent since then. Past data shows that the digital transactions tend to increase in the last month of the financial year as people settle their dues and pay their taxes. Having said that, the total value of digital transactions in May 2017, was higher than that in December 2016. But with volume of transactions being lower, what this means that people who were already on the digital bandwagon are spending more digitally. And that is one piece of good news for a government looking to increase the proportion of digital transactions in the overall economy.

This comparison just tells us how things have evolved on the digital front after demonetisation. How do things look, if were to stretch the timeline a little more? Let’s compare May 2017 data with May 2016 data (In this case I have ignored the data for United Payments Interface and Unstructured Supplementary Service Data (USSD). I could not find this data for May 2016 and May 2015. This will not have any impact on the overall result because the USSD form of digital payment is close to zero and can be effectively ignored.

When it comes to UPI even in May 2017 with all the push and promotion by the government, it made up for 1.1 per cent of the total digital transactions by volume and 0.1 per cent by value (of course we have ignored RTGS here).

Take a look at Table 1. It has the total digital transactions both by volume and value, over the years.

Table 1:

Digital transactionsMay 2017May 2016May 2015
Volume (in millions)831.5726.3491.2
Value (in Rs billion)20,901.515,364.612,173.9

Source: Author calculations on Reserve Bank of India data 

What does Table 1 tell us? Between May 2016 and May 2017, the total number of digital transactions (i.e. volume) went up by 14.5 per cent. In value terms, the digital transactions jumped by 36 per cent. So, doesn’t this tell us that demonetisation had a positive impact on the digital transactions? Before we jump to that conclusion, let’s look at how the situation was between May 2016 and May 2015, when there was no demonetisation to contend with.

Between May 2015 and May 2016, the total number of digital transactions grew by 47.9 per cent in volume terms, which was significantly faster than the increase between May 2016 and May 2017. Of course, the low-base effect is at work, but even with that the jump in percentage terms was significantly more last year.

This also tells us clearly the negative effect that demonetisation has had on the overall economy, with the larger section of the economy going slow on spending. This ultimately reflects in the slower jump in digital transactions.

How do things look in terms of value? In terms of value, the jump between May 2015 and May 2016 stood at 26.2 per cent, which is lower than the jump between May 2016 and May 2017. (I did not look into data from May 2014 and before, because the structure of the digital data changes dramatically, with the importance of ECS increasing in comparison to NACH today).

What does this tell us? It tells us that demonetisation has led to those who were already on the digital mode to spend more digitally. It also tells us that the better-off haven’t been impacted much by demonetisation. Nevertheless, the main aim of demonetisation was to increase the total number of digital transactions (the dream of a cashless society i.e.), which was happening anyway and seems to have slowed down after demonetisation.

The fact that digital transactions in India were growing at fast pace even before demonetisation, isn’t surprising given that India is one of the youngest nations in the world. More than 54 per cent of India’s population is under 25 years of age. Youth take on to new technology faster than others. Hence, the digital transactions in India will continue to grow in the years to come, as they had before demonetisation.

This brings us back to the question was demonetisation necessary? The useful idiots of Narendra Modi (with due apologies to Thomas Sowell who coined the term for a different context) through their WhatsApp forwards and analysis in the media, would like us to believe that. But as more and more data comes out, it is becoming more and more clear that demonetisation was a more or less whimsical decision carried out without any due-diligence. Of course, it needs to be defended now.

The column originally appeared on Equitymaster on June 12, 2017.