Why exports have fallen 12 months in a row

deflation

This is something I should have written last week but with all the focus on the Federal Reserve of the United States, the analysis of India’s export numbers had to take a backseat.

Merchandise exports (goods exports) for the month of November 2015 were down by 24.4% to $20 billion. Take a look at the following table. What it tells us is that the performance on the exports front has been much worse during the second half of 2015. During the first six months of the year the total exports fell by 16.4% in comparison to the same period in 2014. Between July and November 2015, exports have fallen by 19.7%, in comparison to July and November 2014.

MonthExports (in $ billion) in 2015

Exports (in $ billion) in 2014

% fall
January23.926.911.15%
February21.525.415.35%
March23.930.321.12%
April22.125.613.67%
May22.32820.36%
June22.326.515.85%
July23.125.810.47%
August21.326.820.52%
September21.828.924.57%
October21.325.917.76%
November2026.524.53%

Why have the exports fallen so dramatically? A major reason for the same lies in the fact that oil prices have been falling for a while now. At the beginning November 2014, the price of Indian basket of crude oil was at around $81 per barrel. Since then price of oil has fallen to $34 per barrel, a fall of around 58%.

But how does that impact Indian exports? India imports 80% of the oil that it consumes. Given this, any fall in the price of oil is usually welcome. The oil marketing companies need to spend fewer dollars in order to buy oil. At least that is the way one looks at things in the conventional sort of way. What most people don’t know is that in October 2014, petroleum products were India’s number one export at $5.7 billion. Several Indian companies run oil refineries which refine crude oil and then export petroleum products.

In November 2014, petroleum products were India’s second largest export at $ 4.7 billion. In November 2015, the export of petroleum products was down by 53.9% to $2.2 billion, in comparison to a year earlier. Also, petroleum is now India’s third largest exports behind engineering goods and gems and jewellery. This is a clear impact of the fall in price of oil price.

How do things look if we were to take a look just at exports of non-petroleum products? Exports of non-petroleum products in November 2015 was down by 18.3% to $17.8 billion. This doesn’t look as bad as fall of 24.4% of the overall exports, but is bad nonetheless.

How are India’s other major exports doing? Engineering goods are currently India’s number one export. In the last one year they have fallen 28.6% to $4.7 billion. Gems and jewellery are India’s number two export. In the last one year they have fallen 21.5% to $2.9 billion.

A simple explanation here is that the global economy as a whole has not been doing well and that is bound to have an impact on Indian exports as well.  When other countries are not doing well, they import less and this has had an impact on Indian exports.

As Dharmakirti Joshi and Adhish Verma economists at Crisil Research write in a research note titled Exports, Hex, Vex: “Global growth recovery has been slow and uneven. In its latest world economic outlook released in October, the International Monetary Fund (IMF) downgraded its global growth forecast for 2015 to 3.1% from 3.3% earlier. The World Trade Organisation has predicted stagnant trade growth at 2.8% in 2015, which implies annual trade growth would be below 3% for the fourth consecutive year compared to over 7% in the pre-financial crisis period…This suggests global trade has fallen more than world growth, implying trade intensity of world GDP has declined – a worrying phenomenon for export-dependent economies.

But have Indian exports just because global growth and in the process global trade have slowed down? As Joshi and Verma write: “For instance, while world real GDP growth improved from 3.2% in 2009-2011 to 3.4% in 2012-2014, India’s real growth of exports came down from 11.1% to 4.1%. This suggests the decline isn’t merely cyclical; there are structural elements at play as well. The cyclical component of exports will move up when cyclical factors (world GDP growth, prices) turn favourable, but structural factors, if not addressed, will continue to act as a drag on India’s export performance. Falling competitiveness is one of the structural factors restricting export growth. For key export items such as gems & jewellery and textiles, revealed comparative advantage has come down over the years.”

So Indian exports have come down also because their competitiveness vis a vis goods from other nations has gone down over the years. It’s not just about slowing global economic growth.

How are things looking on the imports front? Imports in the month of November 2015 fell by 30.3% to $29.8 billion. This is primarily on account of a huge fall in oil imports due to plummeting oil prices. Oil imports during November 2015 fell by a whopping 45% to $6.4 billion.

If we ignore oil imports from the total imports number, how do things look? Total imports ignoring oil were down by 24.5% to 23.4 billion in November 2015 in comparison to a year earlier. In fact, if we look at non-oil non-gold imports things get interesting. Non-oil non-gold imports for the month of November 2015 have fallen by 22.1% to $19.8 billion. This number is a very good reflection of how consumer demand as well industrial demand is holding up and still hasn’t recovered. And things clearly aren’t looking good on this front.

The column originally appeared on The Daily Reckoning on Dec 21, 2015
Janet Yellen raises interest rates. What happens next?

yellen_janet_040512_8x10

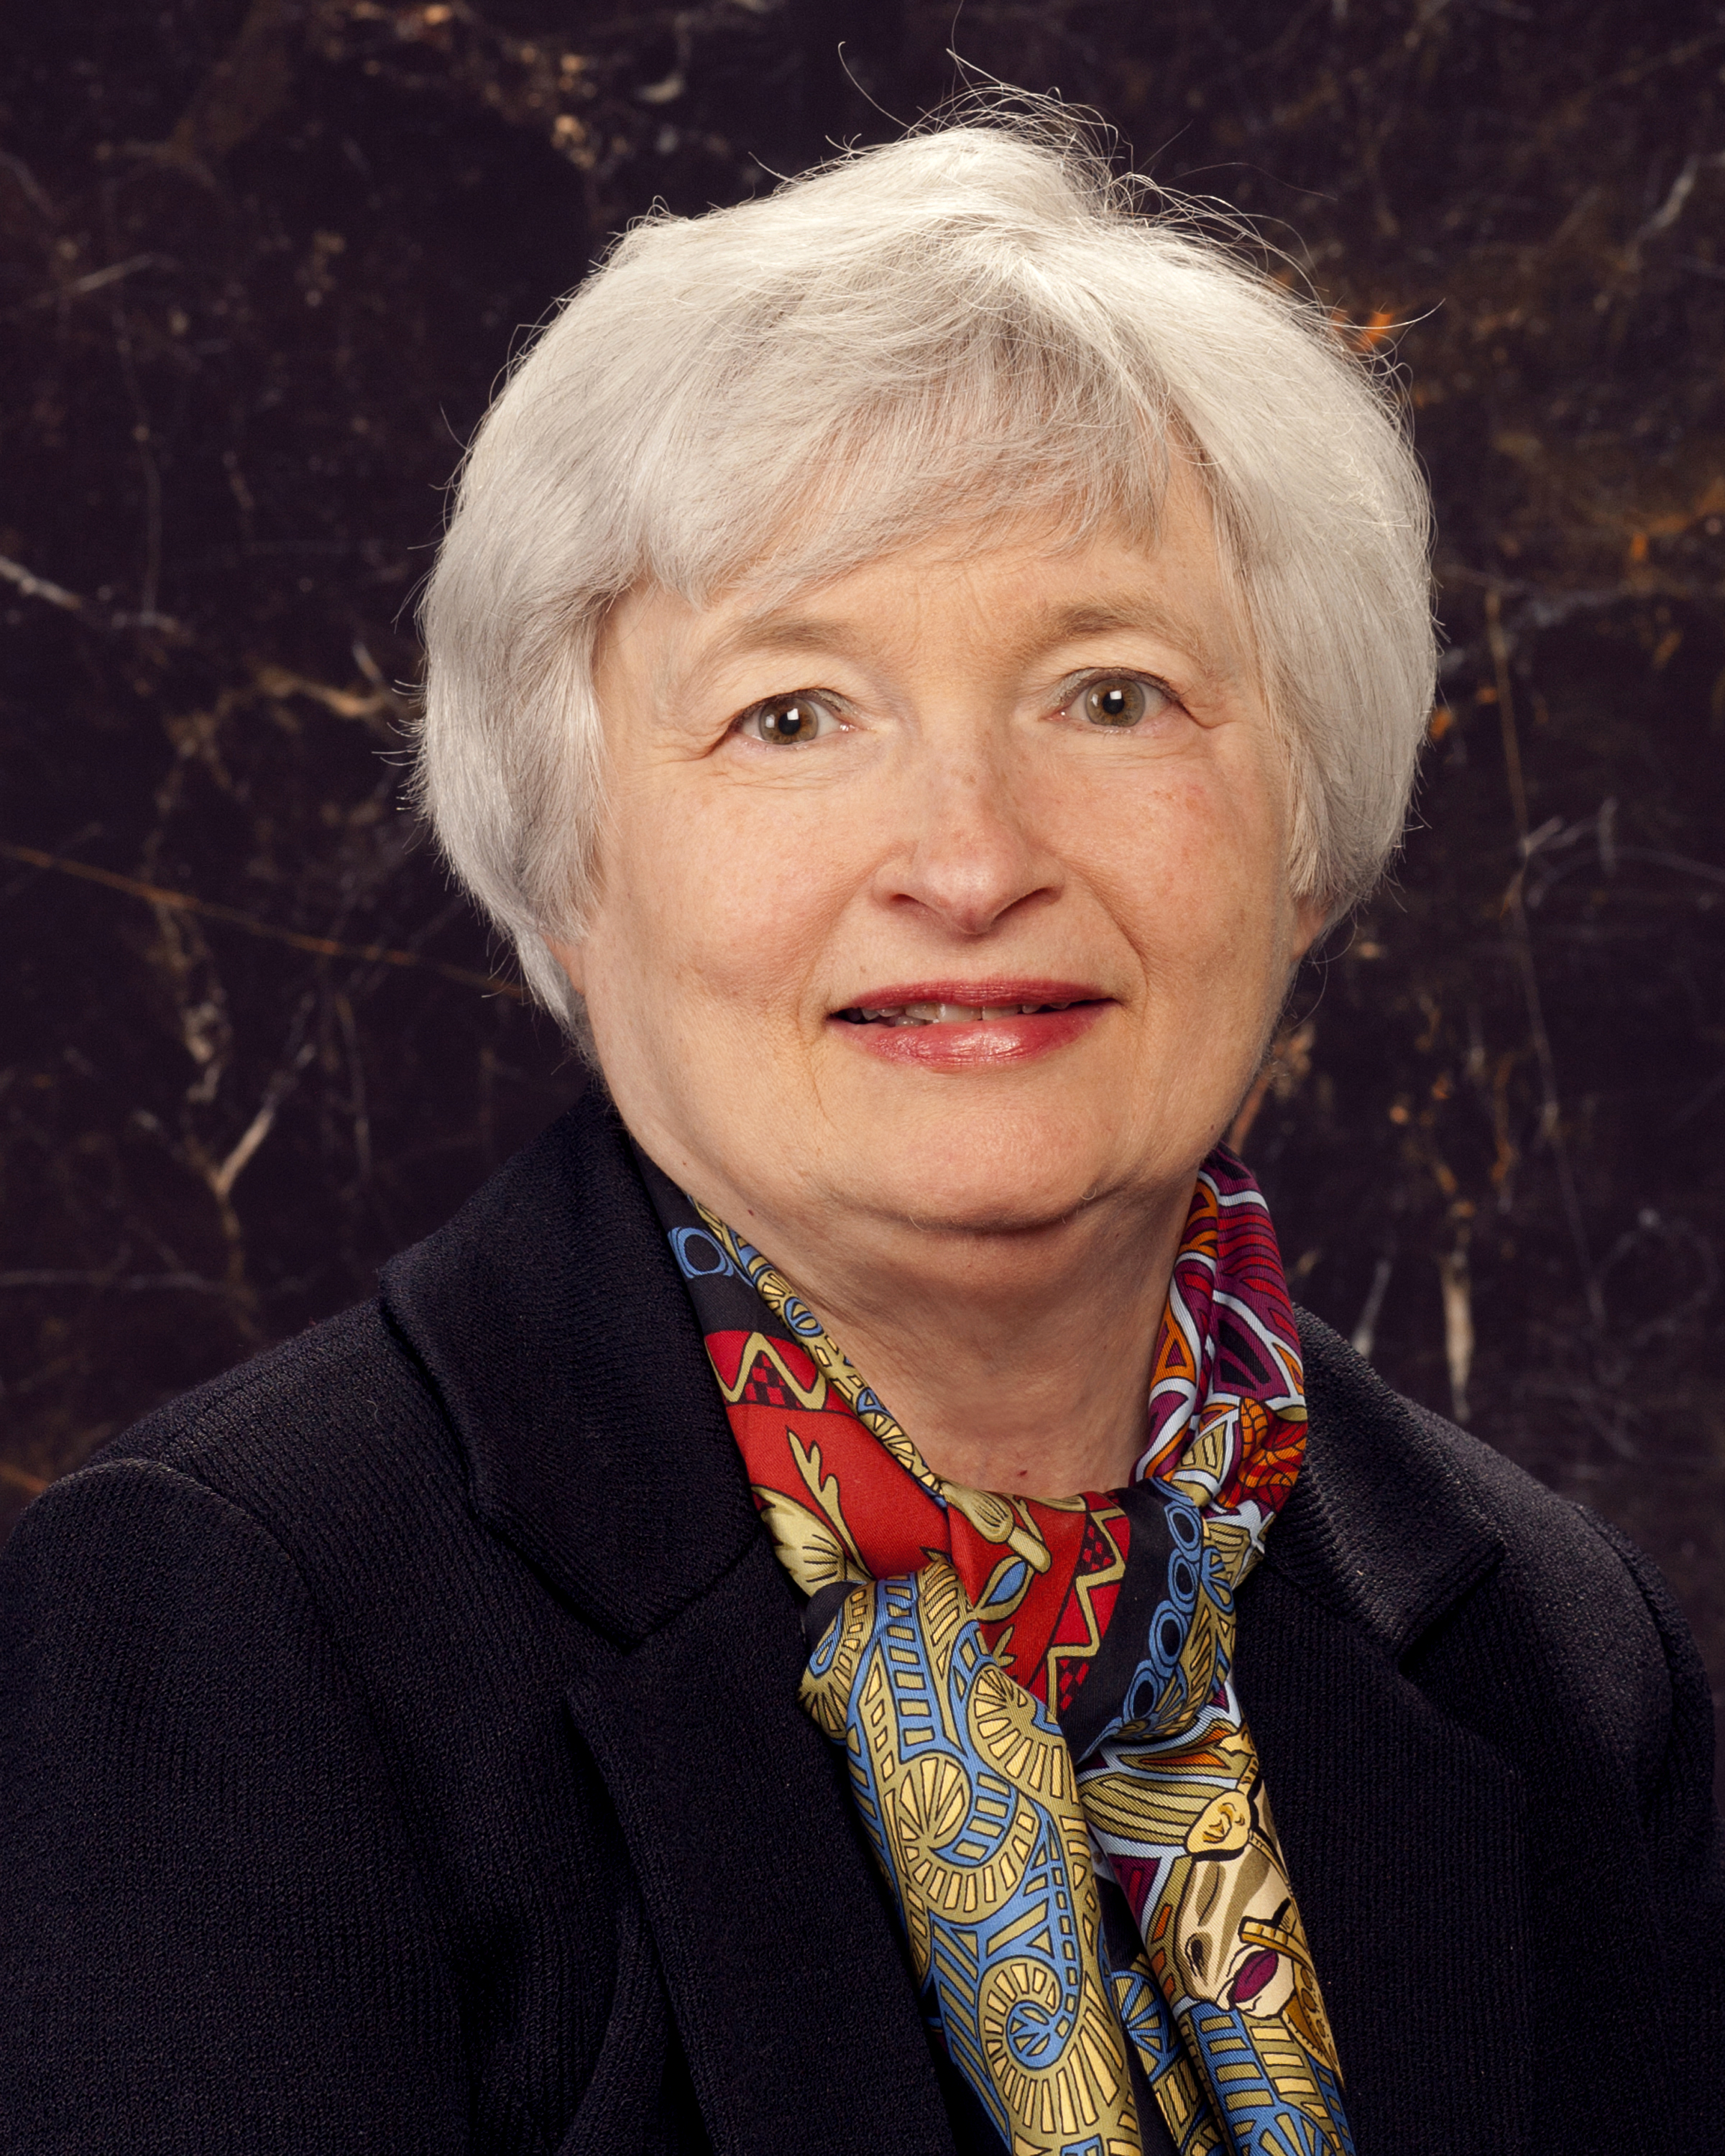
In the column dated December 16, 2015, I had said that the Federal Reserve of the United States would raise the federal funds rate, at the end of its meeting which was scheduled on December 15-16, 2015. That was the easy bit given that Janet Yellen, chairperson of the Federal Reserve of the United States, had more or less made this clear in a speech she made on December 3, 2015.

The Federal Open Market Committee(FOMC) of the Federal Reserve of the United States raised the federal funds rate by 25 basis points (one basis point is one hundredth of a percentage) to be in the range of 0.25-0.5%. Earlier, the federal funds rate moved in the range of 0-0.25%. FOMC is a committee within the Federal Reserve which runs the monetary policy of the United States

The federal funds rate is the interest rate at which one bank lends funds maintained at the Federal Reserve to another bank on an overnight basis. It acts as a sort of a benchmark for the interest rates that banks charge on their short and medium term loans. This is the first time that the FOMC has raised the federal funds rate since mid-2006.

I had also said that the Yellen led FOMC would make it very clear that the increase in the federal funds rate would happen at a very gradual pace. The statement released by the FOMC said that it expects the “economic conditions will evolve in a manner that will warrant only gradual increases in the federal funds rate; the federal funds rate is likely to remain, for some time, below levels that are expected to prevail in the longer run.”

As Yellen put it in central banking parlance in the press conference that followed the Federal Reserve meeting: “The monetary policy will continue to remain accomodative”. In fact, the members of the FOMC expect the federal funds rate to be at 1.4% in a year, 2.4% in two years and 3.3% in three years.

If the federal funds rate has to be at 1.4% one year down the line, then it means that the FOMC will have to raise the federal funds rate by around 25 basis points each (one basis point is one hundredth of a percentage) four times next year. This seems to be a little difficult given that the presidential elections are scheduled in the United States next year. Also, there are other problems that this could create.

The low interest rate policy was unleashed by the Federal Reserve in the aftermath of the financial crisis which started in September 2008, when Lehman Brothers, the fourth largest investment bank on Wall Street went bust. The hope was that both households and corporations would borrow and spend more and in the process, economic growth would return.

What has happened? The household debt to gross domestic product(GDP) ratio has been falling since the beginning of 2009 as can be seen from the accompanying chart.


The household debt to GDP ratio has fallen from around 98% of the GDP at the beginning of 2009, around the time the financial crisis had just started to around 79.8% of the GDP now. What this tells us is that the household debt as a proportion of the total economy has come down. This despite low interest rates being prevalent when at least theoretically people should have borrowed and spent more money.

Take a look at the following chart. It shows that the proportion of the disposable income that Americans are paying to service their debts has also improved. In end 2007, Americans were spending 13.1% of their disposable income to service debt. It has since fallen to 10.1%, though it has jumped a little in the recent past. But the broader trend is clearly down.

What these two graphs tell us clearly is that the household debt in the United States has come down in the aftermath of the financial crisis. So if households have not been borrowing who has? The answer is corporates.

As Albert Edwards of Societe Generale wrote in a research note in November: “The primary driver for the rapid rise in bank lending…has been borrowing by US corporates and we all know they have been using the Fed’s free money not to invest in capacity expanding expenditures, but rather to buy back mountains of their own shares…Corporate debt borrowing at an $674bn annual rate [is] closing in rapidly on the all-time borrowing splurge of 2007!

In another note released after the FOMC decision to raise the federal funds rate Edwards writes that “the real rate of corporate borrowing is even greater than was seen during the late 1990s tech bubble.”

American corporates have borrowed at rock bottom interest rates not to expand their capacities by building more factories among other things, but to buy back their shares. When a corporate buys back and extinguishes its own shares, fewer number of shares remain in the open market. This pushes up the earnings per share of the company. This in turn pushes up the share price. A higher earnings per share leads to a higher market price.

As a result of all this borrowing, the US corporate debt has reached 70% of the GDP, around the level it was at the time the financial crisis started. A Goldman Sachs research note points out that between 2007 and now, the total borrowing of the US corporates has doubled.

Nevertheless, all this money needs to be repaid. And this will become increasingly difficult with sales of US corporates falling. As Edwards writes in his latest research note: “It doesn’t help that both corporate profits and revenues are now falling…Nominal business sales have been contracting all year. Originally, it was put down to unseasonably cold weather – but the chilly data has just not gone away, as a combination of unit labour costs and weak pricing power have led to a typical late cycle decline in profit margins.”

If the Federal Reserve keeps increasing the federal funds rate, the interest rate that American corporates need to pay on their debt will keep going up as well.

The interest rate that the American corporates have been paying on their debt has fallen from 6% in 2009 to around 4% in 2015. A higher interest rate would mean a further fall in the profit made by American companies. Lower earnings would lead to lower stock prices and lower broader index levels.

And this is not something that the Federal Reserve would want. A falling stock market because of higher interest rates would jeopardise the American economic recovery.

As Yellen said in her speech earlier this month: “Household spending growth has been particularly solid in 2015, with purchases of new motor vehicles especially strong….Increases in home values and stock market prices in recent years, along with reductions in debt, have pushed up the net worth of households, which also supports consumer spending. Finally, interest rates for borrowers remain low, due in part to the FOMC’s accommodative monetary policy, and these low rates appear to have been especially relevant for consumers considering the purchase of durable good.”

Once we factor in all this, it is safe to say that the Federal Reserve will go really slow at increasing interest rates. In fact, I don’t see it increasing the federal funds rate to 1.4% by the end of next year. This means good news for Indian stock and bond markets, at least for the time being.
The column originally appeared on The Daily Reckoning on December 18, 2015

What the media did not tell you about the economy this month

newspaperAn old adage in journalism goes: “if it bleeds, it leads”. But this doesn’t seem to apply to bad economic news. Allow me to elaborate. Let’s start with new car sales. New car sales are a reliable economic indicator which tell you whether the economy is starting to pick up.

People buy a car only when they feel certain about their job prospects. Further, once car sales pick up, sale of steel, tyres, auto-components, glass etc., also starts to pick up. New car sales have a multiplier effect and hence, are a good indicator of economic growth. At least that’s how one would look at things theoretically.

The jump in the new car sales numbers was on the front page of the Mumbai edition of the leading pink paper where it was reported that sales saw a double digit growth in November 2015. Car sales in November 2015 went by 11.4% to 2,36,664 units, in comparison to November 2014. That is indeed a good jump and does indicate at some level that the consumer sentiment is improving.

But we need to take into account the fact that Diwali this time was in November and that always pushes up car sales. The December 2015 new car sales number will be a proper indicator of whether car sales have actually recovered or not.

Now contrast this with merchandise exports (goods exports) which fell by 24.4% to $20 billion in November 2015, in comparison to the same period last year.

Over and above this, the exports have been falling for the last twelve months. This piece of news was buried in the inside pages of the Mumbai edition of the leading pink paper. Exports are a very important economic indicator. Countries which have driven their masses out of poverty have done so by having a vibrant export sector.

Getting back to car sales. It is important to ask how important car sales are in the Indian context.  As per the 2011 Census, 4.7% of the households owned cars in India. At the same time 21% of households owned two-wheelers (scooters, motorcycles and mopeds (yes, they still get made and sold).

This tells us very clearly that two-wheeler sales are a better economic indicator in the Indian context than car sales. Many more people own two-wheelers than cars. Further, many more people are likely to buy two wheelers than cars given the fact that two-wheelers are more affordable.

And how are two-wheeler sales doing? Not too well. Two wheeler sales in the month of November 2015 went up just 1.47% to 13,20,561 units, in comparison to November 2014. The motorcycle sales went up by 1.57% to 8,66,705 units. Scooter sales went up by 2.45% to 3,96,024 units. And moped sales fell by 6.16% to 57,832 units.

In fact, the increase in two-wheeler sales in November 2015 in comparison to November 2014 stood at just 19,130 units. Whereas the increase in car sales was at 24,226 units. The increase in car sales was greater than two wheeler sales. And this is indeed very surprising, given that total two wheeler sales in November 2015, were 5.6 times the car sales.

You won’t find this very important point having been made in the pink papers. What does this tell us? It tells us that a large part of India is still not comfortable making what is for them an expensive purchase. It also tells us that the consumer demand at the level of the upper middle class (for the lack of a better term), which can afford to buy a car, is much better than it is for others.

The question is why is did the business media miss out on this? A possible explanation is that most of the business media these days is run out of Delhi. And in Delhi everyone owns a car, at least that’s the impression you are likely to get if you work in the media in Delhi. So car sales are important, two wheeler sales are not. But that is really not the case even in Delhi.

As TN Ninan writes in The Turn of the Tortoise—The Challenge and Promise of India’s Future: “In Delhi, according to data collected for the 2011 Census, 20.7 per cent owned cars and 38.9 per cent owned two-wheelers…In a conscious middle-class entity like Gurgaon, neighbouring Delhi…the credit rating agency CRISIL assessed that 30 per cent of households owned cars [and] 38.9 per cent owned two-wheelers.”

Long story short—two wheeler sales are a better economic indicator than car sales. What this also tells us is that any piece of positive news will be played up and highlighted on the front page whereas any piece of negative news will be buried in the inside pages. Why does this happen? Why did the media almost bury the news of very low growth in two-wheeler sales?

Satyajit Das has an explanation for this in his terrific new book The Age of Stagnation—Why Perpetual Growth is Unattainable and the Global Economy is in Peril: “Bad news is bad for business. The media and commentariat, for the most part, accentuate the positive. Facts, they argue, are too depressing. The priority is to maintain the appearance of normality, to engender confidence.”

Also, given that a business newspaper (or for that matter any newspaper) makes money from advertisements and not the price the buyers pay to buy a newspaper, this isn’t surprising.

Of course, you dear reader, need not worry, as long as you keep reading The Daily Reckoning.

The column originally appeared on The Daily Reckoning on December 17, 2015

Yellen led Federal Reserve will raise interest rates, but very gradually

yellen_janet_040512_8x10
Up until now every time the Federal Open Market Committee has had a meeting, I have maintained that Janet Yellen, the Chairperson of the Federal Reserve of the United States, will not raise interest rates. The latest meeting of the FOMC is currently on (December 15-16, 2015) and I feel that in all probability Janet Yellen and the FOMC will raise the federal funds rate at the end of this meeting.

The federal funds rate is the interest rate at which one bank lends funds maintained at the Federal Reserve to another bank on an overnight basis. It acts as a sort of a benchmark for the interest rates that banks charge on their short and medium term loans.

So why do I think that the Yellen led FOMC will raise the interest rate now? Two major economic indicators that the FOMC looks at are unemployment and inflation. Price stability and maximum employment is the dual mandate of the Federal Reserve.

There are various ways in which the bureau of labour standards in the United States measures unemployment. This ranges from U1 to U6. The official rate of unemployment is U3, which is the proportion of the civilian labour force that is unemployed but actively seeking employment.
U6 is the broadest definition of unemployment and includes work­ers who want to work full-time but are working part-time because there are no full-time jobs available. It also includes “discouraged workers,” or people who have stopped looking for work because the economic conditions the way they are make them believe that no work is available for them.

U6 touched a high of 17.2 percent in October 2009, when U3, which is the official unemployment rate, was at 10 percent. Nevertheless, things have improved since then. In October and November 2015, the U3 rate of unemployment stood at 5% of the civilian labour force. The U6 rate of unemployment stood at 9.8% and 9.9% respectively. This is a good improvement since October 2009, six years earlier.

In fact, the gap between U3 and the U6 rate of unemployment has narrowed down considerably. As John Mauldin writes in a research note titled Crime in the Job Report with respect to the unemployment figures of October 2015: “The gap between the two measures [i.e. U3 and U6] is now the smallest in more than seven years, a sign that slack in the labour market is diminishing. And as the Fed weighs a potential rate hike, what may be more important is the number of people working part-time who would prefer to work full-time – that number posted its biggest two-month decline since 1994. Janet Yellen has referred to this number as often as she has to any other specific number. It is on her radar screen.”

In fact, Janet Yellen seems to be feeling reasonably comfortable about the employment numbers. As she said in a speech dated December 2, 2015: “The unemployment rate, which peaked at 10 percent in October 2009, declined to 5 percent in October of this year…The economy has created about 13 million jobs since the low point for employment in early 2010.

Another indicator that has improved is the number of people who want to work full time but can’t because there are no jobs going around. As Yellen said: “Another margin of labour market slack not reflected in the unemployment rate consists of individuals who report that they are working part time but would prefer a full-time job and cannot find one–those classified as “part time for economic reasons.” The share of such workers jumped from 3 percent of total employment prior to the Great Recession to around 6-1/2 percent by 2010. Since then, however, the share of these part time workers has fallen considerably and now is less than 4 percent of those employed.”

On the flip side what most economists and analysts don’t like to talk about is the fact that the labour force participation rate in the United States has fallen. In November 2015 it stood at 62.5%, against 62.9% a year earlier. It had stood at 66% in September 2008, when the financial crisis started.
Labour force participation rate is essentially the proportion of population which is economically active. A drop in the rate essentially means that over the years Americans have simply dropped out of the workforce having not been able to find a job. Hence, they are not measured in total number of unemployed people and the unemployment numbers improve to that extent.

This negative data point notwithstanding things are looking up a bit. With the U3 unemployment rate down to 5% and U6 down to less than 10%, companies, “in order to entice additional workers, businesses may have to think about paying more money,” writes Mauldin.

And this means wage inflation or the rate at which wages rise, is likely to go up in the days to come. The wage inflation will push up general inflation as well as buoyed by an increase in salaries people are likely buy more goods and services, push up demand and thus push up prices. At least that is how it should play out theoretically.

As Yellen said in a speech earlier this month: “Less progress has been made on the second leg of our dual mandate–price stability–as inflation continues to run below the FOMC’s longer-run objective of 2 percent. Overall consumer price inflation–as measured by the change in the price index for personal consumption expenditures–was only 1/4 percent over the 12 months ending in October.”

But a major reason for low inflation has been a rapid fall in the price of oil over the last one year. How does the inflation number look minus food and energy prices? As Yellen said: “Because food and energy prices are volatile, it is often helpful to look at inflation excluding those two categories–known as core inflation…But core inflation–which ran at 1-1/4 percent over the 12 months ending in October–is also well below our 2 percent objective, partly reflecting the appreciation of the U.S. dollar. The stronger dollar has pushed down the prices of imported goods, placing temporary downward pressure on core inflation.”

In fact, the fall in the price of oil has also brought down the fuel and energy costs of businesses. This has led to a fall in the prices of non-energy items as well. “Taking account of these effects, which may be holding down core inflation by around 1/4 to 1/2 percentage point, it appears that the underlying rate of inflation in the United States has been running in the vicinity of 1-1/2 to 1-3/4 percent,” said Yellen.

In fact, a careful reading of the speech that Yellen made on December 2, clearly tells us that she was setting the ground for raising the federal funds rate when the FOMC met later in the month.

On December 3, 2015, Yellen made a testimony to the Joint Economic Committee of the US Congress. In this testimony she exactly repeated something that she had said a day earlier in the speech. As she said: “That initial rate increase would reflect the Committee’s judgment, based on a range of indicators, that the economy would continue to grow at a pace sufficient to generate further labour market improvement and a return of inflation to 2 percent, even after the reduction in policy accommodation. As I have already noted, I currently judge that U.S. economic growth is likely to be sufficient over the next year or two to result in further improvement in the labour market. Ongoing gains in the labour market, coupled with my judgment that longer-term inflation expectations remain reasonably well anchored, serve to bolster my confidence in a return of inflation to 2 percent as the disinflationary effects of declines in energy and import prices wane.”

This is the closest that a Federal Reserve Chairperson or for that matter any central governor, can come to saying that he or she is ready to raise interest rates. My bet is that the Yellen led FOMC will raise rates at the end of the meeting which is currently on.

Nevertheless, this increase in the federal funds rate will be sugar coated and Yellen is likely to make it very clear that the rate will be raised at a very slow pace. This is primarily because the American economy is still not out of the woods.

The economic recovery remains fragile and heavily dependent on low interest rates. Net exports (exports minus imports) remain weak due to a stronger dollar. Yellen feels that this has subtracted nearly half a percentage point from growth this year.

In this environment economic growth in the United States will be heavily dependent on consumer spending, which in turn will depend on how low interest rates continue to remain. As Yellen said in her recent speech: “Household spending growth has been particularly solid in 2015, with purchases of new motor vehicles especially strong….Increases in home values and stock market prices in recent years, along with reductions in debt, have pushed up the net worth of households, which also supports consumer spending. Finally, interest rates for borrowers remain low, due in part to the FOMC’s accommodative monetary policy, and these low rates appear to have been especially relevant for consumers considering the purchase of durable good.”

This again is a clear indication of the fact that the federal funds rate in particular and interest rates in general will continue to remain low in the years to come.

As Yellen had said in a speech she made in March earlier this year: “However, if conditions do evolve in the manner that most of my FOMC colleagues and I anticipate, I would expect the level of the federal funds rate to be normalized only gradually, reflecting the gradual diminution of headwinds from the financial crisis.”

I expect her to make a statement along similar lines either as a part of the FOMC statement or in the press conference that follows or both.

(The column originally appeared on The Daily Reckoning on December 16, 2015)

Oil@35: The govt has captured most of the oil price fall

Fostering Public Leadership - World Economic Forum - India Economic Summit 2010
In the column published on December 10
, I had discussed why the oil price has been falling and is now below $40 per barrel. Data from the Petroleum Planning and Analysis Cell (PPAC) shows that the price of the Indian basket of crude oil as on December 11, 2015, was at US$ 35.72 per barrel. In the last one month the price of oil has fallen by around 16%.

In the column published on December 10, I discussed the reasons behind the falling oil price and why the trend is likely to continue at least in the short run. In today’s column I will discuss how falling oil prices will impact India.

The biggest beneficiary of lower oil prices is the government. The oil marketing companies sell certain oil products like kerosene and domestic cooking gas at below the cost price. The government subsidises them for this. In the budget for this financial year, the government had assumed a total subsidy of Rs 30,000 crore. This included Rs 22,000 crore subsidy for domestic cooking gas and Rs 8,000 crore kerosene subsidy. There are no under-recoveries on petrol and diesel anymore.

Oil prices have fallen by close to 35% since the beginning of this financial year. Given this, chances are that the Rs 30,000 crore allocation towards oil subsidy should work just fine. In the past, the government used to share the total under-recoveries occurred by oil marketing companies at various points of time during the course of the year.

From what I could gather looking at government press releases, this practice seems to have been stopped since the beginning of this financial year. If the total under-recovery number on the sale of kerosene and cooking gas was available, I could have said with greater confidence that the Rs 30,000 crore put aside for oil subsidies would be enough. (The point again shows how difficult it is in India to do write stuff based on data).

Hence, with oil prices falling, the total expenditure of the government should remain under control. In the past, with rising oil prices, the government ended up under-budgeting for under-recoveries. This led to higher expenditure, a higher fiscal deficit and higher borrowing to finance the fiscal deficit. This is unlikely to happen this time around. Fiscal deficit is the difference between what a government earns and what it spends. A higher fiscal deficit pushes up interest rates as the government borrows more and this is not good for the economy.

Further, the government hasn’t passed on the benefit of falling oil prices to the end consumers. The price of petrol in Mumbai as on April 2,2015, was Rs 67.53 per litre. Currently petrol sells at an almost similar price of Rs 67.55 per litre.

During the same period the price of the Indian basket of crude oil has fallen by close to 35%. The price as on April 2, 2015, was $54.77 per barrel. By December 11, 2015, the price had fallen to $35.72 per barrel. The same is true for diesel as well. The price of diesel in Mumbai as on April 2, 2015, was Rs 55.69 per litre. Currently, it retails at Rs 53.09 per litre or around 4.7% lower.

The government has captured much of this gain by increasing the excise duty on petrol and diesel. Excise duty collections between April and November 2015 are up by a whopping 67% to Rs 1,70,693 crore. Much of this jump has come from an increase in excise duty on diesel and petrol.

In fact, a series of tweets by revenue secretary Dr Hasmukh Adhia gives more clarity on this front. Adhia said that the total indirect taxes between April and November grew by 34.3% to Rs 4,38,291 crore. Customs duty, service tax and excise duty, together make up for indirect taxes.

The increase has primarily come from “the excise increases on diesel and petrol, the increase in clean energy cess, the withdrawal of exemptions for motor vehicles, capital goods and consumer durables, and from June 2015, the increase in Service Tax rates from 12.36% to 14%.” If these increases are discounted for then the increase in indirect taxes was at 10.3%, Adhia tweeted.

Getting back to oil. Earlier this year the investment bank Goldman Sachs said that there is less than 50% chance that oil prices will drop to as low $20 per barrel. If that were to happen, it would be great if the government passed on the gain to the end consumers as well, instead of trying to capture all the gain for itself.

My guess is that the government will try and capture the gains from any further fall in the price of oil as well.  This ‘easy money’ will allow the government to go easy on other fronts. This will mean that the government will continue to subsidise loss making companies like MTNL and Air India. No hard decisions will be made on this front. Further, the disinvestment of public sector companies will take a backseat, as it already has, on the pretext of the stock market not doing well.

Theoretically falling oil prices should also push down the fuel bill of companies. But as the recently released data on the performance of non-financial private corporate business sector during the second quarter of 2015-16 (July- September 2015) by the Reserve Bank of India shows, that is clearly not happening. The power and fuel costs of Indian companies (a sample of 2,711 companies) went down by just 4.2%, despite the price of oil falling much more. The reason for this lies in the fact that the government hasn’t passed on this fall in price to the end consumer.

India imports close to 80% of the oil that it consumes. Given this, any fall in price of oil is beneficial to the country. Any fall in oil prices means that we will be paying fewer dollars for the oil that we import. And this means that our oil import bill will come down. That’s the good bit.

On the flip side, India is also a big exporter of oil products (we refine oil and export oil products). In October 2014, oil products were India’s biggest export at $5.73 billion. Since then with a fall in the price of oil, oil products have become India’s third largest export at $2.46 billion in October 2015. Hence, while falling crude prices are beneficial on the import front, they hurt on the export front as well.

The column originally appeared on The Daily Reckoning on December 15, 2015