Why 2.8 Crore Indians Applied for 90,000 Jobs in Indian Railways

indian flag
The Indian Railways recently got 2.8 crore applications for around 90,000 jobs it had advertised for.

This basically means that the ratio of number of applicants to the number of jobs stands at 311:1. Further, it means that 18.7% of India’s youth workforce (people in the age group 18-29) applied for it. Or to put it a little more simplistically, every one in five individuals who are a part of India’s youth workforce, applied for these jobs.

This is even without taking any education qualifications into account. If we do that (i.e. people who have at least passed the tenth standard or some such parameter), the proportion of India’s youth workforce which applied for these jobs in the Indian Railways would go up even further.

If this is not an indication of India’s massive jobs crisis, we don’t know what is.

The argument being offered against this is that just because someone has applied for a government job, does not mean he or she is unemployed. Of course, this is a fair argument, but an incomplete one. Allow me to explain.

Let’s us look at Table 1, a table we have used multiple times before.

Table 1: 

Table 1 clearly tells us that only 60.6% of India’s workforce which is looking for a job all through the year, is able to find one. So, yes Indians may not be unemployed, but they are terribly underemployed. Hence, nearly 40% of Indians looking for a job all through the year are unable to find one. Or two in five Indians who are looking for a job all through the year are unable to find one.

Further, this underemployment translates into low levels of income, as can be seen from Table 2.

Table 2: Self-employed/Regular wage salaried/Contract/Casual Workers
according to Average Monthly Earnings (in %) 

Table 2 shows us the income levels of India’s workforce. As far as the self-employed and the contract workers are concerned, nearly two-thirds of them make up to Rs 7,500 per month or Rs 90,000 per year. In case of contract workers, more than 84% of contract workers earn up to Rs 7,500 per month or Rs 90,000 per year.

The per capita income in 2015-2016 was at Rs 1.07 lakh. This basically means that a bulk of India’s non-salaried workforce, earns a significantly lower income than the per capita income.

The non-salaried workforce works largely in the informal sector, which forms a bulk of India’s economy (as high as 92% as per one estimate). As the Economic Survey of 2015-2016, points out: “By most measures, informal sector jobs are much worse than formal sector ones-wages are, on average, more than 20 times higher in the formal sector.”

Given these low levels of income primarily because of huge underemployment, so many people tend to apply for government jobs in general, and the recent vacancies in Indian Railways are no exception to this. People are looking for a regular and stable source of monthly income. They want to get rid of the irregularity of payment that they have to regularly deal with in the informal sector.

The Indian government is a good paymaster, especially at lower levels. As the Report of the Seventh Pay Commission points out: “To obtain a comparative picture of the salaries paid in the government with that in the private sector enterprises the Commission engaged the Indian Institute of Management, Ahmedabad to conduct a study. According to the study the total emoluments of a General Helper, who is the lowest ranked employee in the government is Rs 22,579, more than two times the emoluments of a General Helper in the private sector organizations surveyed at Rs 8,000-9,500.”

Hence, the IIM Ahmedabad study “on comparing job families between the government and private/public sector has brought out the fact that…at lower levels salaries are much lower in the private sector as compared to government jobs.”

In this scenario, it isn’t surprising that so many people apply for government jobs in India. The employment opportunities in the informal sector are irregular and simply don’t pay enough. India’s huge underemployment gets reflected in the number of people applying for government jobs.

And at the end of the day, underemployment is also a representation of unemployment and the huge jobs crisis that India is facing. There simply aren’t enough jobs/employment opportunities which will keep individuals occupied for the full year, going around, for everyone who is a part of India’s burgeoning workforce.

Indeed, that is something to worry about. And what is even worrying is that the Modi government is not worrying about this huge issue.

Postscript: Dear Reader, you must be wondering why are we still using 2015-2016 data even in 2018-2019. The Labour Bureau carried out six household-based Annual Employment-Unemployment Surveys (EUS) between 2010 and 2016. Of these, reports of five rounds have been released till date. The last report was released in September 2016. The question is, why has the report for the sixth round of the Survey not been released till date.

Recently, in an answer to a question raised in Parliament, the government said, “On the recommendations of the Task Force on Employment, however, this survey has been discontinued.” Basically, a survey that brought bad news in the form of huge underemployment that India has been facing, has been discontinued, and then the government goes around talking about lack of data.

The column was originally published on Equitymaster on April 16, 2018.
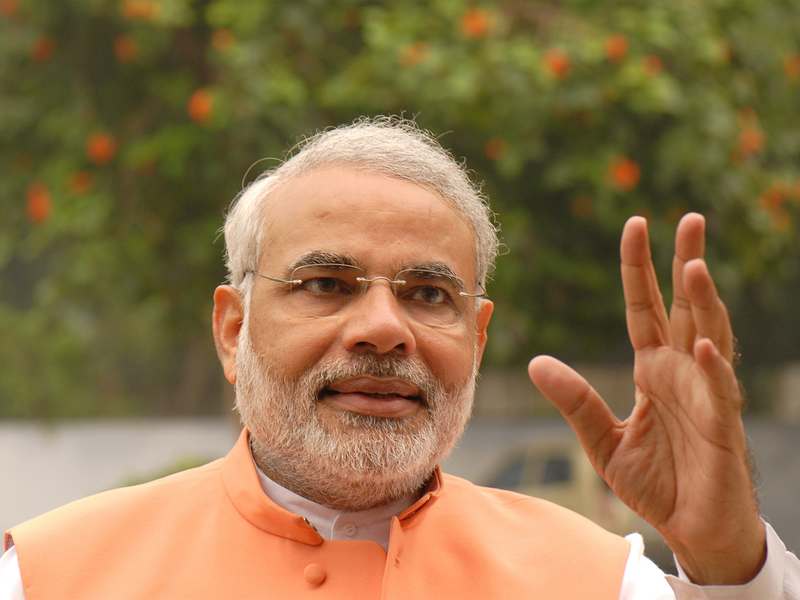
Modi government refuses to acknowledge India’s jobs crisis

narendra_modi
Indian Railways, India’s largest public sector employer, recently received more than 28 million applications for 90,000 jobs posts, it had advertised for. As of March 31, 2017, the Indian Railways employed around 1.31 million individuals.

The ratio of the number of applicants to the number of jobs stood at a whopping 311:1.
The number of applicants was more than the population of Australia, which was a little over 24 million in 2016. It was around 6 times the population of New Zealand, which in 2016, was around 4.6 million.

Using data provided by the Central Statistics Office of the government of India, we can estimate that the number of Indians between the ages of 15 and 29, who are most likely to apply for these jobs on offer, are at 360 million (189 million males and 171 million females).

This basically means that close to 7.8% of the population in the age group that can be categorised as India’s youth has applied for the 90,000 jobs on offer at the Indian Railways. What this calculation does not take into account is the fact that everybody in the age group 15-29 is not looking for a job.

Many individuals in this age group are studying. In case of females, many are married at a young age and take care of the family. In some other cases, females have been pulled out of school or college, and are waiting at home to get married.

We need to adjust for this i.e. take the labour force participation rate of this age group of the population into account, and then recalculate the numbers.

The labour force participation rate for males in the age group 15-29 is 63.1% (as per NSSO June 2012). These are the proportion of people who are actually looking for jobs. For women it is 18.3%.

There are two explanations for the low female labour participation rate. One lies in the fact that many individuals in this age group are still studying. Further, the overall labour force participation rate for females is also very low at 18.1%, and this reflects in this age-group as well.

Taking the labour force participation rates into account, the total number of people actively looking for jobs in the 15-29 age group works out to 150 million (119 million males and 31 million females).

This means close to 18.7% (28 million expressed as a percentage of 150 million) of the population in the 15-29 age group, has applied for the 90,000 jobs on offer at Indian Railways. Or to put it a little simplistically, one in five individuals in the 15-29 age-group has applied for the jobs on offer in the Indian Railways.

This tells us the sad state of affairs for the one million youth who are joining the Indian workforce every month. Another factor at work here is that the government pays much better at lower levels than the private sector in India does, which obviously gets many people to apply.

The above figures clearly show the lack of formal jobs in India. This is a problem that the Indian government is not willing to acknowledge. Recently, Jayant Sinha, a junior minister in the Modi government, called India’s jobs crisis more of a data crisis, in a column he wrote for The Times of India, India’s largest selling English newspaper.

In his column he stated that 6.5 million new jobs were created in the retail sector between 2014 and 2017. While he didn’t state the source of this data, some digging around suggests that he borrowed this number from Human Resources and Skill Requirement in the Retail Sector, authored by KPMG, for the NITI Aayog, a government run think tank.

The 6.5 million jobs that Sinha talked about was basically a forecast, which Sinha passed off as the actual number of jobs created.

As far as the lack of data is concerned, the Labour Bureau carried out six household based Annual Employment-Unemployment Surveys (EUS) between 2010 and 2016. Of this, reports of five rounds have been released till date. (Makes us wonder why has the report on the sixth round been held back up until now).

The report of the fifth round was released in September 2016. One the major findings of the report was that only 60% of the Indians who were looking for a job all through the year, found one. This figure showed the bad state of jobs in India, very clearly. This finding was consistent with a similar finding reported in the report on the fourth round of the survey as well.

Recently, in an answer to a question raised in the Parliament, the government said, “On the recommendations of Task Force on Employment, however, this survey has been discontinued”. Basically, a survey which brought bad news has been discontinued and then the government goes around talking about lack of data.

There is enough data that suggests that India is facing a huge jobs problem. The so called demographic dividend is collapsing. The Modi government refuses to even acknowledge this problem. The first step towards solving any problem is to acknowledge it. If you don’t acknowledge a problem, how do you solve it?

The column was originally published on April 13, 2018, on AsiaTimes.

Do Numbers Always Tell the Truth?

Nirav_Modi

The writer Gregg Easterbrook once said: “Torture numbers, and they’ll confess to anything.” Allow me to explain with an example, on how numbers can be used to muddle the truth.

Nirav Fraud has defrauded the Punjab National Bank of Rs 12,645.97 crore. This is the loan amount that the diamond merchant has defaulted on. On its own the number sounds like a pretty big number, which it is.

But now let me show, how even a number as big as this, can be made to look small, by someone who is looking to muddle the truth.

The question is how big is Nirav Modi’s fraud vis a vis the accumulated bad loans of Punjab National Bank. His fraud is ultimately going to add to the bad loans of the bank.

Bad loans are loans where the borrower has stopped repaying for 90 days or more. The accumulated bad loans of Punjab National Bank stood at Rs 57,519 crore as on December 31, 2017.

Hence, Nirav Modi’s default will add around 22% more to the bad loans number of Punjab National Bank. At this level, the default still seems big. Let’s go a little further.
Now let’s take a look at the bad loans of all banks (i.e. public sector banks + private banks + foreign banks). This stands at around Rs 9,00,000 crore, as on December 31, 2017. Nirav Modi’s default amounts to just 1.4%, which is very small in the overall scheme of things. A big default number now suddenly seems very small.

Let’s look at this in one final way. The average size of a fraud in the case of Indian banking, where the borrower willfully defaulted, was around Rs 3 crore, between 2012-2013 and 2016-2017, a period of five years. In case of Punjab National Bank, the average size of a fraud amounted to Rs 9.6 crore.

When we compare Nirav Modi’s fraud with these figures, we realise how big his fraud is, in the context of borrowing frauds. And this is how Nirav Modi’s fraud needed to be looked at and which is how, thankfully, it is being looked at.

The context is the most important point when trying to make sense of a number. The good thing is that nobody tried to muddle the truth in this case, and it was clear from day one that Nirav Modi’s fraud was a big fraud, from day one. But that is not always the case.

Few years back, in the days after Nirbhaya was battling for her life, I remember reading a news item which suggested that Sweden had one of the highest incidences of rape in the world. The Indian scenario was much better, the newsreport suggested.

Of course, the newsreport totally missed out on the context and muddled the truth. As Hector Macdonald writes in Truth—How the Many Sides to Every Story Shape Our Reality: “Sweden is said to have the second highest incidence of rape in the world, with more than 60 cases reported per 100,000 inhabitants each year (the rate for India is 2 per 100,000). Yet this reflects not only Sweden’s better reporting of sexual crime but also a broader definition of rape.” In India, other than fewer rape victims coming out in the open, the system also works to protect the rapists in many cases.

Or take the case of rates of kidnapping. As Macdonald writes: “Canada and Australia have the highest rates of kidnapping in the world. Really, it’s true. Not because they are more dangerous than Mexico and Colombia but because their governments include parental disputes over child custody in kidnapping statistics.”

The broader point here is that before believing a number, it is important to look at the overall context in which it is being used. As Macdonald writes: “When someone tries to persuade you that a number is especially significant, the first thing to do is to translate it into a more revealing truth that incorporates relevant context.”

Now that of course is, easier said, than done.

The column originally appeared in Bangalore Mirror and Mumbai Mirror on April 11, 2018.

Under Current Terms Only LIC is Likely to Buy Air India

LIC

India’s three main airlines, IndiGo, Jet Airways and SpiceJet, have made it clear that they are not interested in buying Air India, in the current form it is being offered in. (As I finished writing this column, a Reuters journalist tweeted to suggest that the Tatas are also unlikely to bid for Air India, as well. Guess, nostalgia, doesn’t always work). The government of India wants to:

A) Sell 76% of Air India.

B) 100% of Air India Express, the low-cost arm of Air India.

C) 50% of SATS, a gateway solution and food services provider. Against this sale, the government, wants the buyer:

a) To take on two-thirds of the debt of Air India. As on March 31, 2017, the total debt of the company was at Rs 48,447.37 crore. Two-thirds of this works out to Rs 32,298 crore.

b) The buyer also needs to give a guarantee that none of the permanent employees of the airline will be sacked for a year. After that the buyer can offer them a voluntary retirement scheme.

In return, the buyer, along with the aircrafts of Air India, will also get 2,543 international landing slots negotiated with many countries, over the years. The landing slots is for what any airline will want to buy Air India. The real estate of Air India, which includes the famous Air India building in Nariman Point, will continue to remain with the government.

What also works for the prospective buyer is that Air India has 12% market share in the domestic market in India. While, this has fallen from a 100% market share once upon a time, when private airlines were not allowed to operate in India, it needs to be taken into account that only 3% of Indians have travelled by air. Hence, the potential is immense. India is one of the last big airline markets that remains untapped.

Also, the airline has a 17% share in flights in and out of India.

All these factors work for the buyer. But there are other factors which don’t. As mentioned earlier, the airline had a debt of close to Rs 48,447 crore as on March 31, 2017. Two-thirds of this debt has to be picked up by the buyer.

The working capital loans constitute Rs 31,088 crore of this debt. This is a little lower than the amount of debt that the government wants the prospective buyer of Air India to pick up. It is worth asking how has this debt accumulated over the years? The airline loses money every year and in order to continue operating it needs to borrow.

The banks lend money to the airline because it is ultimately deemed to be lending to the government and a government doesn’t usually default. A private enterprise in the place of Air India, would have had to shut down by now.

The larger point is that by asking a prospective buyer to take on two-thirds of the debt, the government basically wants the buyer to take on the overall accumulated inefficiency of the airline.

Rs 33,298 crore is a lot of money and is basically a deal breaker as far as the sale of Air India is concerned. This kind of debt it could even bring down the airline that decides to buy Air India. (In fact, we had said the same thing in a column which appeared on January 15, earlier this year).

Other than the working capital loans of Rs 31,088 crore, the remaining Rs 17,360 crore is basically loans that have been taken for buying aircrafts. If this portion of the loan is passed on to the buyer, there is at least some justification given that there are airplanes that were bought using the loan.

Also, any prospective buyer will adjust for these loans before deciding on the price it wants to buy for Air India. But on the whole, the debt will drive away most prospective buyers.

Further, it is worth remembering that airline has lost a lot of money over the years and it continues to lose money. The airline lost Rs 41,657 crore between 2010-2011 and 2016-2017. These losses have continued in 2017-2018 (for the period between April to December 2017). Take a look at Table 1.

Table 1:

Domestic (Rs. in lakh)International (Rs. in lakh)
Traffic Revenue505,9641,044,676
Total Cost676,2311,334,296

Source: Loksabha Questions PDF 

Table 1 tells us that between April to December 2017, the airline lost a further Rs 4,599 crore. This basically means that the accumulated losses of the airline between April 2010 and December 2017, stand at Rs 46,256 crore.

Now that’s a lot of money. Other than the airline borrowing money to keep itself going, the government has also pumped in money into the airline over the years. Take a look at Table 2.

Table 2:

YearEquity Infused Rs. in (crore)
2011-121.200
2012-136,000
2013-146,000
2014-155,780
2015-162,500
2016-171,713
2017-18 (till date)1,800
Total Cost26,545.21

Source: Loksabha Questions PDF 

This infusion is a part of a restructuring plan which provides Rs 30,231 crore of equity infusion from the government into the airline, until 2021. It is clear that the restructuring plan is not working given that the airline continues to lose more than what the government has invested in it, over the last few years.

This isn’t surprising given that the cost of operation of the airline is very high. As a recent report by Kotak Institutional Equities points out, the operational costs of Air India are Rs 4.74 per available seat kilometre, in comparison to Rs 4.33 for Jet Airways, Rs 3.6 for SpiceJet and Rs 3.16 for IndiGo.

The airline also has a huge number of employees, backed by powerful trade unions which can be a huge nuisance. As on January 1, 2017, the airline had 18,049 employees. In comparison, IndiGo had 14,576 employees as on March 31,2017. IndiGo also employed 8,225 employees on a temporary/contractual/casual basis. Indigo has 40% share in India’s domestic airline business. Air India has 12%.

Also, 37.6% of Air India’s employees are retiring over the next five years. The trouble is that no prospective buyer will be willing to wait for five years, so that the airline can then have the right number of employees. Any quick turnaround will only happen if the buyer is allowed to fire employees.

The larger point here is that the airline is clearly not a family jewel that the government considers it to be (like all other public sector enterprises). It is basically a dangerous wound which has been bleeding the government and continues to bleed it. This bleeding needs to be stopped and it can only be stopped if the government decides to be a lot more flexible about the terms on which it is willing to sell the airline.

In fact, the government is more likely to attract bidders if it tries selling different parts of the airline, separately. For starters, the domestic business and the international business of Air India, need to be offered separately. In fact, even Air India Express, which primarily has flights to the middle east should also be offered separately. This might attract different buyers.

Further, the buyer should be allowed the flexibility of the doing what he deems fit to run the airline. The government cannot sell the airline and then want to continue running it through the backseat, by implementing terms and conditions.

Also, if this means that a few thousand Air India employees lose their jobs, then so be it. They have had a good time at the expense of the taxpayer, for many years now. This is as good a time, as any, to end it. If the government continues to run the airline, it will have to continue pumping money into it. This is money that is taken away from many other important areas like education, defence, health and agriculture. Further, the debt that the airline takes on will also eventually end up in the books of the government.

Under the current terms, the only institution that is likely to buy Air India, is the Life Insurance Corporation(LIC) of India. Given its past record under different governments in buying public sector enterprises, it won’t be surprising if the financial institution is forced to come to the rescue of the government and pick up a stake in the beleaguered airline. Funnier things have happened.

The column originally appeared on Equitymaster on April 11, 2018.

Mr Jaitley, One Thing Direct Tax Collections Show is That Acche Din are Here for CAs

A little over a week back, the numbers for the direct tax collections for 2017-2018, were released. The net direct tax collections have improved by around 17.1% to Rs 9.95 lakh crore. The direct tax collections consist of corporate tax, personal income tax and other direct taxes. This is the gross direct tax collection. After, refunds are deducted from it, what remains are the net direct tax collections.

The finance minister attributed this increase in net direct tax collections to demonetisation and Goods and Services Tax, which had resulted in a higher formalisation of the economy. The interpretation being that with increased formalisation people paid more tax.

The trouble with looking at just the absolute direct tax collections is that they do not take into account the fact that the size of the economy has also grown. Hence, any tax collection, should always be looked at as a proportion of the gross domestic product. How do things look when we look at the direct tax to the GDP ratio?

Take a look at Figure 1, which plots that.

Figure 1: 

Source: https://www.incometaxindia.gov.in/Documents/Direct%20Tax%20Data/Time-Series-Data-2016-17.pdf.
For 2017-2018, the figure has been arrived at using data from http://pib.nic.in/PressReleseDetail.aspx?PRID=1527290
and http://pib.nic.in/PressReleseDetail.aspx?PRID=1522059.

What does Figure 1 tell us? It tells us that the direct tax to GDP ratio in 2017-2018 is likely to be at 5.94%. We use the word likely because right now what we have is a GDP estimate for 2017-2018, which will change when the actual numbers come out, later this year.

The direct tax to GDP ratio in 2016-2017 was at 5.6%. Hence, there is an improvement of 34 basis points (one basis point is one hundredth of a percentage), year on year. If we look at historical data, such a jump happened almost every year between 2001-2002 and 2007-2008. And no demonetisation or GST happened back then.

In 2007-2008, the direct taxes to GDP ratio peaked to 6.3%. The stock market was rallying big time back then. Once it crashed, the direct taxes to GDP ratio fell over the next few years. What this basically means is that when the stock market is doing well, the investors pay a lot more short-term capital gains tax than they do otherwise. And this improves the direct taxes to the GDP ratio of the government.

This is a factor that needs to be taken into account for the jump in direct tax collections as 2017-2018 as well. The stock market has been rallying over the last few years, and there is bound to have been some jump in the short-term capital gains tax collections. Given that an exact breakdown of different kinds of taxes is not available in the public domain as of now, we cannot adjust for it. These gains need to be adjusted for simply because they are temporary in nature.

But, we are sure, the mandarins at the finance ministry have this data, they can very well adjust for it and then tell us, what has been the real growth in direct tax collections.

There is another factor which makes the data look a lot better than it perhaps actually is. The net direct tax collections as mentioned earlier are arrived at by subtracting refunds from gross direct collections. Let’s take a look at Figure 2.

Figure 2: 

Source: Author calculations on data from https://www.incometaxindia.gov.in/Documents/Direct%20Tax%20Data/Time-Series-Data-2016-17.pdfhttp://pib.nic.in/PressReleseDetail.aspx?PRID=1527290
and http://pib.nic.in/PressReleseDetail.aspx?PRID=1522059.

The refunds have fallen from 1.07% of the GDP in 2016-2017, to 0.89% of the GDP in 2017-2018. This is the second biggest fall in refunds between 2000-2001 and 2017-2018. It will be interesting to see what portion of the returns filed still remain to be processed. The larger point being that the direct tax collections data does not pass this basic smell test.

Further, if we look at GDP growth, 2017-2018 has seen slowest GDP growth (in nominal terms without adjusting for inflation) since 2011-2012. The government collecting higher taxes while the overall economy is slowing down, is not something to be proud of.

Let’s look at another data point that the Modi government keeps tom-tomming about at any given opportunity. That the number of tax returns being filed has been going up at a rapid pace. As the press release accompanying the announcement of direct tax numbers pointed out: “During FY 2017-18, 6.84 crore Income Tax Returns (ITRs) were filed with the Income Tax Department as compared to 5.43 crore ITRs filed during FY 2016-17, showing a growth of 26%. There has been a sustained increase in the number of ITRs filed in the last four financial years. As compared to 3.79 crore ITRs filed in F.Y. 2013-14, the number of ITRs filed during F.Y. 2017-18 (6.84 crore) has increased by 80.5%.”

Between 2013-2014 and 2017-2018, the number of income tax returns being filed has gone up 80.5%. During the same period the direct taxes to GDP ratio has gone up from 5.62% to 5.94%, by around 32 basis points.

What does this tell us? It tells us that more and more income tax returns are being filed, without any tax being paid. Why? Simply because the taxable income is not enough to be taxed.

The Economic Survey of 2017-2018 acknowledges this: “Analysis suggests that new filers reported an average income, in many cases, close to the income tax threshold of Rs. 2.5 lakhs.”

The Survey believes that “as income growth over time pushes many of the new tax filers over the threshold, the revenue dividends should increase robustly.”

Basically, what the Economic Survey is saying that a bulk of new tax filers are close to the income threshold of Rs 2.5 lakh. Income tax needs to be paid by individuals only if taxable income is more than Rs 2.5 lakh. The Economic Survey believes that as these people earn more, cross the Rs 2.5 lakh limit and pay tax. But the assumption here is that the Rs 2.5 lakh limit will continue to be the same.

Logically, it will have to go up in the years to come, simply because inflation needs to be taken into account. Hence, this argument doesn’t quite hold.

To conclude, the chartered accountants (CAs) in the business of filing returns are basically having the last laugh. The good thing at least someone is seeing the promised acche din.

The column originally appeared on Equitymaster on April 10th, 2018.