Why Demonetisation Did Not Hurt Modi

narendra_modi

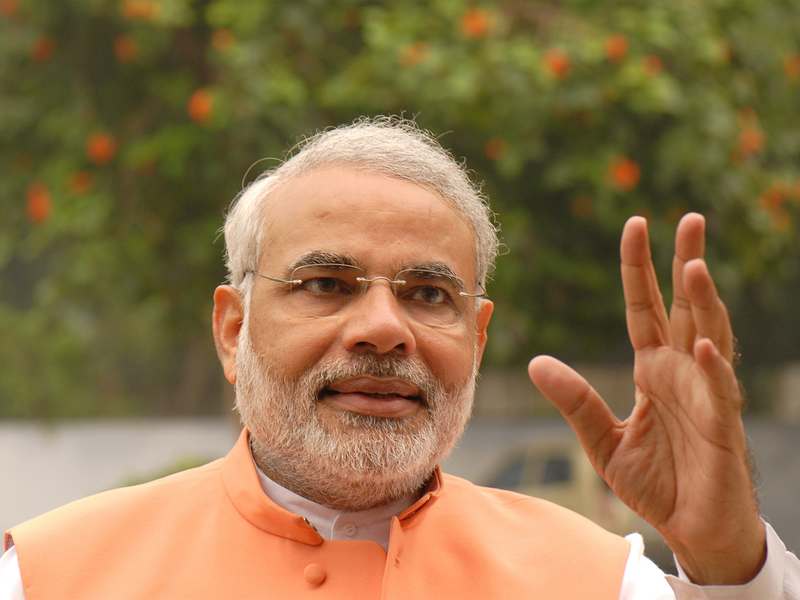
Later this week, the prime minister Narendra Modi will complete three years in office. In the recent past, there have been a spate of articles analysing the performance of the Modi government.

The general conclusion seems to be that the prime minister continues to remain politically popular. The recent wins of the Bhartiya Janata Party in the Uttar Pradesh state assembly elections and the Delhi municipal elections, is evidence of the same.

Over and above this, there has been a lot of analysis around the impact of demonetisation, as more data becomes available. Most data show that the economic impact of demonetisation has been negative. For all the trouble that people were put through, the income tax department hasn’t been able to identify much of black money.

Further, barely any fake currency was identified during the process of demonetisation. Digital transactions peaked in December 2016 and have fallen since then. Hordes of informal businesses were shut down and many people lost their jobs, in the process. And if all this wasn’t enough, on some days ATMs still run out of cash.

Nevertheless, despite all this Modi continues to be a popular prime minister. What is happening here? The negative economic environment created in the aftermath of demonetisation hasn’t impacted the prime minister.

Narendra Modi is what political scientists call a populist leader. What is the definition of a populist leader? Jan-Werner Müller, a professor of politics at Princeton University, defines this in his book What is Populism?

First and foremost “it is a necessary but not sufficient condition to be critical of elites in order to count as a populist”. Over and above this, there are other factors that go into the making of a populist leader like Modi is.

As Müller writes: “Populists claim that they, and they alone, represent people… The claim of exclusive representation is not an empirical one; it is always distinctly moral. When running for office, populists portray their political competitors as part of the immoral, corrupt elite; when ruling, they refuse to recognise any opposition as legitimate. The populist logic also implies that whoever does not support populist parties might not be a proper part of the people—always defined as righteous and morally pure.”

A populist leader also likes cutting out the middleman. This means relying as little as possible on party organisations and the media, which acts as intermediaries between party organisations and the people.

This explains why Modi chose to directly address the nation on Doordarshan while announcing demonetisation on November 8, 2016. He spoke to the nation through the mann ki baat programme on radio on November 27, 2016. He addressed the nation again on December 31, 2016.

The focus of the message delivered was on how black money of the morally corrupt elite was hurting India big time and how important it was to tackle this problem on a war footing on an immediate basis. By doing this a situation of a crisis was created.

As Müller writes: “A “crisis” is not an objective state of affairs but a matter of interpretation. Populist will often eagerly frame a situation as a crisis, calling it an existential threat, because such a crisis then serves to legitimate populist governance. Put differently, a “crisis” can be a performance, and politics can be served as a continuous stage of siege.”

And this direct talking by populists attacking the so called morally corrupt elite goes down well with the true people, something which all the data and the numbers offered against decisions made by them can’t do anything about.

As Müller writes: “Populists ultimately appeal to a certain symbolic rendering of the “true people,” the appeal of that image will not vanish automatically when voters are presented with a some set of correct statistics about a particular policy area”.

And that best explains why demonetisation was a politically popular decision though numbers clearly show that it hurt the Indian economy.

The column originally appeared in the Bangalore Mirror on May 24, 2017

The Banking Ordinance is no magic pill for ailing banks

RBI-Logo_8

Recently, the government promulgated the Banking Regulation(Amendment) Ordinance, 2017, to tackle the huge amount of bad loans that have accumulated in the Indian banking system in general and the government owned public sector banks in particular. Bad loans are essentially loans in which the repayment from a borrower has been due for 90 days or more.

This Ordinance is now being looked at the magic pill which will cure the problems of Indian banks. Will it?

The Ordinance essentially gives power to the Reserve Bank of India(RBI) to give directions to banks for the resolutions of bad loans from time to time. It also allows the Indian central bank to appoint committees or authorities to advise banks on resolution of stressed assets.

The basic assumption that the Ordinance seems to make is that the RBI knows more about banking than the banks themselves. This doesn’t make much sense for the simple reason that if the RBI was better at banking than the banks themselves, it would have been able to identify the start of the bad loans problem as far back as 2011, which it didn’t.

Over and above this, this is not the first time that Indian banks have landed in trouble because of bad loans. They had landed up in a similar situation in the early 1980s and the early 2000s as well, and the RBI hadn’t been able to do much about it.

In fact, at the level of banks, many banks have been more interested in postponing the recognition of the problem of bad loans. This basically means they haven’t been recognising bad loans as bad loans. One way of doing this is by restructuring the loan and allowing the borrower a moratorium during which he does not have to repay the principal amount of the loan. In some cases, even the interest need not be paid. In some other cases, the tenure of the loan has been increased. In many cases this simply means just pushing the can down the road by not recognising a bad loan as a bad loan.

Why have banks been doing this? The Economic Survey gives us multiple reasons for the same. Large debtors have borrowed from many banks and these banks need to coordinate among themselves, and that hasn’t happened. At public sector banks recognising a bad loan as a bad loan and writing it off, can attract the attention of the investigative agencies.

Also, no public sector banker in his right mind would want to negotiate a settlement with the borrower who may not be able to repay the entire loan, but he may be in a position to repay a part of the loan. As the Economic Survey points out: “If PSU banks grant large debt reductions, this could attract the attention of the investigative agencies”. What makes this even more difficult is the fact that some of defaulters have been regular defaulters over the decades, and who are close to politicians across parties.

Hence, bankers have just been happy restructuring a loan and pushing the can down the road.

Over and above this, writing off bad loans once they haven’t been repaid for a while, leads to the banks needing more capital to continue to be in business. In case of public sector banks this means the government having to allocate more money towards recapitalisation of banks. There is a limit to that as well.

Also, a bigger problem which the Economic Survey does not talk about is the fact that the rate of recovery of bad loans has gone down dramatically over the years. In 2013-2014, the rate of recovery was at 18.8 per cent. By 2015-2016, this had fallen to 10.3 per cent. Hence, banks were only recovering around Rs 10 out of the every Rs 100 of bad loans defaulted on by borrowers. This is clear reflection of the weak institutional mechanisms in India, which cannot change overnight.

Also, many of the companies that have taken on large loans are no longer in a position to repay. As the Economic Survey points out: “Cash flows in the large stressed companies have been deteriorating over the past few years, to the point where debt reductions of more than 50 percent will often be needed to restore viability. The only alternative would be to convert debt to equity, take over the companies, and then sell them at a loss.”

The first problem here will be that many businessmen are very close to politicians.
Hence taking over companies won’t be easy. Over and above this, it will require the government and the public sector banks, working with the mindset of a profit motive, like a private equity or a venture capital fund. And that is easier said than done.

The column originally appeared in the Daily News and Analysis on May 22, 2017.

Of “Shaky” Demonetisation Statistics, Arun Jaitley and Black Money

We don’t live in a perfect world. And given this, governments like to showcase the positive impact of the decisions they make, all the time. Sometimes, they get very desperate in the process.

Take the case of the economic impact of demonetisation. Most data now coming out clearly shows that the decision did not have a positive impact on the Indian economy. It might have helped the Bhartiya Janata Party to win the Uttar Pradesh assembly elections, but that doesn’t necessarily make it a right decision on the economic front.

Nevertheless, the Modi government would like us to believe that demonetisation has helped the country on the economic front. Early last week the finance minister Arun Jaitley said that “more than 91 lakh people were added to the tax base due the result of the actions taken by the income tax department.”

It was later clarified that 91 lakh people were added to the tax base in 2016-2017(i.e. between April 1, 2016 and March 31, 2017). As per Jaitley’s statement 91 lakh individuals were added to the tax base post demonetisation, which is incorrect.

Meenakshi Goswami, Income Tax Commissioner and the official spokesperson of the Central Board for Direct Taxes (CBDT), told NDTV later in the week that91 lakh was the total number of new taxpayers enrolled in the financial year 2016-2017.”

Now this makes things interesting. On the face of it, the addition of 91 lakh individuals to the income tax base sounds like a huge number. But when we are talking about any increase or decrease, a number should never be viewed in isolation.

The trouble is that we don’t have long term data on this front because of a change in the definition of “tax base” and “new tax payer added during the year”. The annual report of the ministry of finance for 2015-2016 points out that new taxpayers “added during the year 2014-15 is 76,04,154”. This basically means that 76 lakh new taxpayers were added during 2014-2015. I couldn’t find any data for 2015-2016. Now compare the 91 lakh additions in 2016-2017 to 76 lakh additions in 2014-2015, and suddenly the number doesn’t seem too high, given that no demonetisation was carried out in 2014-2015.

Even if the government doesn’t do anything, taxpayers get added every year, especially when the minimum tax slab continues to remain the same. In 2014-2015, the minimum tax slab was Rs 2,50,000, which is where it continues to be. This basically means that inflation alone would have ensured that more people came into the tax bracket and thus increased the tax base.

Over and above this, as the economy grows and people earn more, more people come into the tax bracket.

Once we take these factors into account, the addition of 91 lakh taxpayers suddenly doesn’t sound much, especially taking into account the disruption that demonetisation caused through the length and the breadth of the country.

Further, Sushil Chandra, chairman of CBDT said that between November 2016 and March 2017, the search actions of the income tax department revealed an undisclosed income of Rs 16,398 crore. On the other hand, the surveys had led to a detection of Rs 6,746 crore during the same period.

Again, if we look at these numbers in isolation, they sound like a lot of money. But that doesn’t turn out to be the case if we look at numbers over a period of time. Take a look at Table 1. It shows the undisclosed income admitted to and detected during the search operations as well as surveys conducted by the income tax department over the last few years.

Table 1: Undisclosed income

Financial YearNumber of groups searchedUndisclosed income admitted (in Rs Crore)Number of surveys conductedUndisclosed income detected (in Rs Crore)Total undisclosed income (in Rs Crore)
2012-201342210,291.61463019,337.4629,629.07
2013-201456910,791.63532790,390.711,01,182.34
2014-201554510,288.05503512,820.3323,108.38
2015-1644511,066.2444229,654.820,721.04
2016-17*2226,304.7197717,62.518,067.22

*Up to September 2016 in case of search numbers and August 2016 in case of survey numbers
Source: Ministry of Finance Annual Reports and the Press Information Bureau
The numbers for 2016-2017 are incomplete. But there is enough detail that lets us analyse the issue. Between April and September 2016, the total undisclosed income (or black money) admitted through search operations of the income tax department stood at Rs 6,304.71 crore. The undisclosed income detected through surveys conducted between April and August 2016 had stood at Rs 1,762.51 crore. If we add these numbers we get Rs 8,067.22 crore.

Between November 2016 and March 2017, the search actions of the income tax department revealed an undisclosed income of Rs 16,398 crore, as pointed out earlier. On the other hand, the surveys had led to a detection of Rs 6,746 crore during the same period. Adding both these numbers we get Rs 23,144 crore. Adding this to the earlier Rs 8,067.22 crore, we get around Rs 31, 211 crore.

This is the total undisclosed income identified by the income tax department during the course of 2016-2017. The number is incomplete because the information for the month of October 2016 is missing in case of search operations and information for the months of September-October 2016 is missing in case of survey operations.

Nonetheless, it is a good ballpark number to work with. Hence, the total amount of undisclosed income or black money identified by the income tax department in 2016-2017 stood at more than Rs 31,211 crore.

Is it such a big deal? Look at Table 1. The total amount in 2012-2013 had stood at Rs 29,629 crore. This amount hasn’t been adjusted for inflation. It is safe to say that in inflation adjusted terms more undisclosed income was identified by the income tax department in 2012-2013 than in 2016-2017. In 2013-2014, the number stood at Rs 1,01,182 crore, which is significantly more than 2016-2017. And it is worth remembering here that these numbers happened without demonetisation. In fact, as the numbers clearly show the efficacy of the income tax department when it comes to identification of black money has come down since 2014-2015.

To conclude, the rosy picture of demonetisation that the government is trying to paint, is really not true. The more data we look at the clearer this becomes.

Postscript: I recently did a podcast with the writer Amit Varma who is currently the editor of the Pragati magazine, on the Right to Education and how it has screwed up our education system. Most of what I spoke was based on my new book India’s Big Government—The Intrusive State and How It is Hurting Us. You can listen to the podcast here.

The column originally appeared in Equitymaster on May 22, 2017.

Why Bangalore Came Last in IPL

Virat_Kohli_26_Feb_2012

The Indian Premier League(IPL) is just about to come to an end. The Bangalore team did not do particularly well in this year’s edition and won only three out of their 14 games. They lost 10 games and one game was drawn because of rains.

The team was a finalist last year and lost to Hyderabad in the final. Given this, at the beginning of the 2017 season, nobody expected that the Bangalore team would come last among the 8 teams. Nevertheless, reasons are now being offered on why the Bangalore team did not do well this time around.

While analysing and offering reasons is fine, some of the cricket experts are now saying that they always knew that Bangalore wouldn’t do well this year. Multiple reasons have been offered. Here are a few that I have heard.

The captain Virat Kohli was injured and missed the first few games. KL Rahul missed the entire tournament because of an injury. Chris Gayle was not in his usual form. AB de Villiers was also injured and came in only after the first few games. One expert even said that the injury to batsman Sarfaraz Khan hit the team hard.  And hence, the team was never able to build the momentum that is required to keep winning T20 games.

While all this sounds fine, none of these reasons were offered at the beginning of the tournament. At the beginning of the tournament none of the experts said that they don’t expect the Bangalore team to do well this year. But now once the Bangalore team has not done well, they are busy coming up with various reasons to explain the non-performance.

And along with that they are convinced about the fact that they had always believed that the Bangalore team would not do well this year. As David Hand writes in The Improbability Principle: “After the fact, it’s easy to put the pieces together, and show how they form a continuous chain leading to the outcome.” Or to put it simply, everything is obvious once you know the answer. Hence, Bangalore did not do well because Kohli was injured and could not play in the first few games. Bangalore did not do well in these games and in the process, they were never able to build the required momentum which is an essential part of a tournament of this kind.

This kind of storyline could not have been offered at the beginning of the tournament. As Hand writes: “Before the fact, however, there are many pieces and potential chains and it’s just not possible to know which events fit together. This isn’t because there are too many pieces, but simply because they can be put together in a vast number of possible ways, and there’s no reason to select any one of them.”

Hence, before this year’s IPL started one did not know that Chris Gayle, the master of the T20 game, would have the kind of disastrous year he did. It was always difficult to predict that the likes of de Villiers, Travis Head and Shane Watson, brilliant T20 players in their own right, wouldn’t have much of an impact on Bangalore’s overall performance. Even Kedhar Jadhav burdened with the  responsibility to keep wickets, looked out of touch.

But all this and more can be now said with confidence, almost at the end of the tournament. As Hand writes: “Our innate tendency to retrospectively adjust a new recollection as new information becomes available, to identify the chain which led to the disaster and to say, after the fact, ‘Look, it was staring us in the face!’ is called hindisight bias.”

The point being that Bangalore lost because they did not score enough runs and they did not take enough wickets. Any analysis beyond this, is essentially hindsight bias.

The column originally appeared in the Bangalore Mirror on May 17, 2017

New IIP Shows Demonetisation Slowed Down Indian Manufacturing Growth Big Time

India_textile_fashion_industry_workers

India has a new Index of Industrial Production (IIP). It is bigger and according to economists who track such things, it is better than the previous one. The IIP basically gives growth estimates of three sectors-manufacturing, mining and electricity. The manufacturing sector forms more than three-fourths of the IIP.

The base year for the new IIP has been changed to 2011-2012 from the earlier 2004-2005. This has been done to capture the changes in the industrial sector that have happened over a period of time and “to also align it with the base year of other macroeconomic indicators like the Gross Domestic Product (GDP), Wholesale Price Index (WPI)”.

Like any other index, the IIP tracks various items that make for the manufacturing, mining and electricity sectors. These items need to be changed or relooked at from time to time in order to ensure that the IIP continues to maintain a representativeness of the manufacturing, mining and electricity sectors in particular and the industry as a whole in general.

The new IIP has a total of 809 items in the manufacturing sector. The earlier one had 620. While, the number of items which constitute the manufacturing part of IIP have gone up, 124 items have been removed as well. These include items like gutka, calculators and colour TV picture tubes. Items like cement clinkers, medical and surgical accessories, refined palm oil etc., have been added. Along similar lines, the electricity sector now includes data from the renewable energy sector as well.

Over and above this, there has been an increase in number of factories in panel for reporting data and closed ones have been removed. All in all, these steps have been taken in order to ensure that the new IIP is a better representation of industry than the old one was.

Given that, items that constitute IIP have change majorly, it is not surprising that the growth figures of IIP have changed as well. Take a look at Figure 1. It plots both the new IIP and the old IIP growth rates over the last half decade, April 2012 onwards.

Figure 1: 

One look at Figure 1 is enough to tell us that the old IIP and new IIP are different beasts altogether, though both are very volatile. Now take at data from March 2013. As per the old IIP series, the growth was at 3.5 per cent. The new IIP series puts the growth at 15.1 per cent. That’s how different the old and the new IIP are.

In fact, as per the new IIP, the industrial growth stood at 3.3 per cent in 2014-2015, the last year of the Congress led UPA government. As per the old IIP the growth had stood at – 0.1 per cent. Hence, we can conclude that the state of the industry in the last year of the Congress government wasn’t as bad as it seemed at that point of time. It’s just that the old IIP may have no longer remained a good representation of the Indian industry.

In fact, the new IIP shows that industrial growth picked up in 2016-2017, the last financial year. The growth stood at 5.1 per cent. As per the old IIP the industrial growth was at 0.6 per cent, during the course of the year. What this also tells us is that the two IIPs are as different as chalk and cheese.

There is an interesting trend that the new IIP catches on to in the manufacturing sector. Manufacturing makes up for 77.6 per cent of the new IIP as against the 75.5 per cent in the old one. Take a look at Table 1.

Table 1: Manufacturing Growth

PeriodManufacturing Growth(in %)
Dec 2012 to Mar 20139.4
Dec 2013 to Mar 20143.7
Dec 2014 to Mar 20153.2
Dec 2015 to Mar 20164.9
Dec 2016 to Mar 20171.6

Source: Centre for Monitoring Indian Economy.

The manufacturing growth between December 2016 and March 2017 stood at 1.6 per cent. This has been the slowest in comparison to the same period in previous years. Why is this the case? The one word answer to this is demonetisation. The Modi government announced demonetisation of Rs 500 and Rs 1,000 notes on November 8, 2016, and sent the economy into a tailspin. The interesting thing is that the average manufacturing growth between April 2016 and October 2016 had stood at 6.9 per cent. This signalled the revival of the manufacturing sector after having grown by around 3 per cent in 2015-2016 and 3.8 per cent in 2013-2014.

Demonetisation managed to scuttle that revival in this growth. Also, it is worth pointing out here that the IIP data is collected from “entities in the organised sector units registered under the Factories Act, 1948”. This means that the unorganised sector is not covered. And as I have often written in the past, the impact of demonetisation on the unorganised sector has been far greater.

Up until now, the government has refused to admit that demonetisation has had a negative impact on the economy (Subscription Required). I guess it’s time it looked at the new IIP numbers to realise the obvious.

(The column was originally published in Equitymaster on May 16, 2017)