In an Ocean of Corporate Defaulters, Vijay Mallya is a Small Fish

Mallya4545

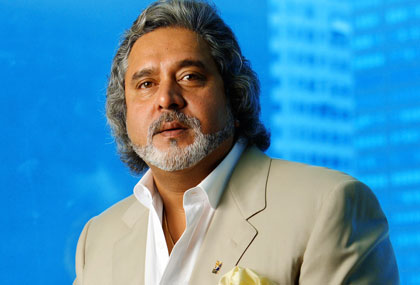
The process of extraditing Vijay Mallya started on April 18, 2017. As a part of the process he was arrested and then later released on bail.

Newsreports suggest that the Indian government has taken up this issue with the British government at the highest level. What this suggests that there is a political will to get Mallya back to India and prosecute him. Indeed, that is a very good thing.

Having said that, in an ocean of corporate defaulters and bad loans of banks, Mallya is a very small fish. A newsreport on Moneycontrol points out that Mallya owes banks and the service tax department around Rs 9,000 crore. This includes the principal loan amount, interest on the loans as well as penalties.

Now compare this to the total gross non-performing assets(NPAs) or bad loans of Indian banks. These are loans which borrowers have defaulted on and stopped their repayment. As of December 31, 2016, the gross NPAs of banks stood at Rs 7,23,323 crore. The gross NPAs of public sector banks, to whom Mallya mainly owes money, stood at Rs 6,46,199 crore.

This comparison clearly tells us that Mallya is a small fry in the overall NPA pie. Let’s now look specifically at the corporate NPAs. As of March 31, 2016, the total corporate gross NPAs of public sector banks stood at Rs 3,36,124 crore or 11.95 per cent of the total loans given out to corporates. This is the latest number I could find. There is enough evidence to suggest that the situation has worsened since then. Compare this to what Mallya owes to banks and you know why Mallya is a small fish in the ocean of corporate defaulters.

While the government needs to put all its effort into getting Mallya back to India, it also needs to go after other defaulters sitting peacefully in India. This is something that hasn’t really happened up until now.

Let’s take a look at Table 1. It shows the non-performing assets recovered by the public sector banks over the years.

Table 1: NPAs of PSBs recovered through various channelsTable 1 does not make for a happy picture. The rate of recovery of non-performing assets or bad loans has fallen dramatically over the years. In 2013-2014, the total bad loans involved were Rs 1,49,149 crore. Of this Rs 28,052 crore was recovered. The rate of recovery worked out to 18.8 per cent.

In 2014-2015, the total bad loans involved were at Rs 2,26,529 crore. Of this Rs 27,849 crore was recovered. The rate of recovery worked out to 12.3 per cent. In 2015-2016, the rate of recovery fell further. The total bad loans involved were Rs 1,91,464 crore. Of this Rs 19,757 crore was recovered. The rate of recovery worked out to 10.3 per cent.

Hence, the rate of recovery of loans has fallen on the whole. How does the scenario look if we ignore Lok Adalats as a channel of recovery, given that the amounts involved there are on the smaller side. The rate of recovery improves but only a little.

In 2013-2014, 2014-2015 and 2015-2016, the rate of recovery works out to 20.2 per cent, 13.5 per cent and 13.6 per cent, respectively. Hence, the rate of recovery goes up a little if
we ignore Lok Adalats as a channel of recovery, but the difference is not much to change the overall conclusion.

If the government really wants to clean up the mess that prevails at public sector banks, it should be looking to improve the rate of recovery of bad loans. And that will only be possible if banks go after large defaulters with a lot of vigour, something that has not happened up until now.

This will happen only if there is political will for the same because ultimately public sector banks are owned by the government, and if the government wants something to happen it will happen. No bank employee is going to risk his career by going after a loan which has been defaulted on by a large corporate, only to find out that the corporate is friends with a politician.

In fact, the Economic Survey had some interesting data on corporates which had taken
on a lot of bank loans and are now finding it difficult to repay them. Many corporates to which banks lent money now have an interest coverage ratio of less than one. These companies are referred to as stressed companies. This basically means that the operating profit (earnings before interest and taxes) of these firms is lower than the interest that they need to pay on their outstanding debt, during a given period. Hence, these companies are simply not earning enough to pay the interest on the loans they had taken on.

The stressed companies with an interest coverage ratio of less than one, owe a little more than 40 per cent of the loans given out by Indian banks. It is these companies which are essentially holding Indian banks back.

In fact, even within stressed companies (i.e. companies with an interest coverage ratio of less than one) the problem is concentrated among a few borrowers. A mere 50 companies account for 71 per cent of the loans owed by the stressed companies. On an average these companies owe Rs 20,000 crore each to the banking system. The top 10 companies on an average owe Rs 40,000 crore apiece.

This is where the real problem of Indian banking lies. Only if the public sector banks  along with the government can clean this up, will the mess get cleaned up. Whether the government will show the same vigour as it has to get Mallya back to India, on this front, on that your guess remains as good as mine.

The column originally appeared on April 20, 2017, on Equitymaster

Will RBI’s Latest Rescue Act Clean the Mess in Public Sector Banks?

o-URJIT-PATEL-facebook-1

Late last week, the Reserve Bank of India(RBI) unleashed yet another weapon to clean up the mess that India’s public sector banks are in. The RBI reviewed and revised the preventive corrective action (PCA) framework for banks.

At a very simplistic level, the PCA framework essentially will restrict the ability of any bank to go about their normal business, in case they don’t meet certain performance parameters. The idea is to ensure that banks do not get into a further mess.

The RBI has basically set three risk levels for the PCA framework to kick-in. Take the case of bad loans or net non-performing assets(NPAs) of banks. (NPAs are essentially loans which borrowers have defaulted on and are no longer repaying. These NPAs are referred to as gross NPAs. Against, the gross NPAs, the banks set aside a sum of money referred to as provisions. Once these provisions are subtracted from gross NPAs what remains are net NPAs).

Let’s say the net NPA of a bank is greater than or equal to 6 per cent but less than 9 per cent. In this case, the bank will face a restriction on dividend distribution. This is the first risk level of the PCA framework. In case, the net NPA is greater than or equal to 9 per cent and less than 12 per cent, along with dividend restrictions the bank will also face a restriction on branch expansion and at the same time will have to increase its provisions or the money it sets asides against gross NPAs. This is the second risk level of the PCA framework.

If the net NPA is greater than or equal to 12 per cent, then along with the dividend restrictions, restrictions on bank expansion, greater provisioning, the banks will have to limit the management compensation and directors’ fees. This is the third risk level of the PCA framework.

Along with net NPAs, the other performance parameters that the RBI plans to take a look at as a part of the PCA framework are the capital adequacy ratio, return on assets and the leverage of the bank. If the bank does not meet the RBI set levels of these parameters, the actions highlighted above will kick-in.

Over and above this, there are other actions that can kick-in. These include:

  1. Special audit of the bank
  2. A detailed review of business model in terms of sustainability of the business model of the bank.
  3. RBI to actively engage with the bank’s Board on various aspects as considered appropriate.
  4. RBI to recommend to owners (Government/ promoters/ parent of foreign bank branch) to bring in new management/ Board.
  5. RBI to supersede the Board.
  6. Reduction in exposure to high risk sectors to conserve capital.
  7. Preparation of time bound plan and commitment for reduction of stock of NPAs.
  8. Preparation of and commitment to plan for containing generation of fresh NPAs.
  9. Strengthening of loan review mechanism.
  10. Restriction of staff expansion.
  11. Restrictions on entering into new lines of business.
  12. Restrictions on accessing/ renewing wholesale deposits/ costly deposits/ certificates of deposits.
  13. Reduction in loan concentrations; in identified sectors, industries or borrowers.

If you look at the above actions, other than the RBI superseding the board of the bank, the other steps are more or less what any bank which is in trouble would undertake. The question is will the PCA unravel the mess that the Indian banks, in particular the government owned public sector banks, are currently in.

The biggest problem for the public sector banks has been the fact that their gross NPAs have been increasing at a very rapid rate. Between December 2014 and December 2016, the gross NPAs of public sector banks increased by 137 per cent to Rs 6.46 lakh crore.

What is the reason for this huge and sudden increase in gross NPAs? A major reason lies in the fact that banks have been recognising their bad loans as bad loans at a very slow speed. The question is the recognition of bad loans as bad loans over? Have all bad loans been recognised as bad loans? Or are banks still resorting to accounting gimmicks and postponing the recognition of bad loans? This is a question which only the banks or the RBI can answer.

The most important step in cleaning up the balance sheets of Indian banks is ensuring that all the bad loans have been recognised as bad loans. A problem can be solved only after it’s properly identified. The tendency not recognise bad loans as bad loans and project a financial picture which is incorrect needs to end.

The second biggest problem for Indian banks has been the poor recovery rate of bad loans (i.e. net NPAs in this case). Data from RBI shows that in 2015-2016, the recovery rate fell to 10.3 per cent of the net NPAs. In 2014-2015, it was at 12.4 per cent. In 2013-2014 and 2012-2013, the recovery rates were even better at 18.4 per cent and 22 per cent, respectively.

This basically means that the ability of banks to recover bad loans has gone down over the years. Will the PCA framework be able to help on this count? It doesn’t seem so. A greater portion of the bad loans need to be recovered from corporate India. As the Economic Survey points out: “The stressed debt is heavily concentrated in large companies.” Hence, any major recovery from large companies will need a lot of political will something, which is something the RBI cannot do anything about.

The PCA framework will kick-in depending on the performance of banks as on March 31, 2017. But taking the net NPA numbers as on December 31, 2016, how does the scene look like for public sector banks? There are 21 public sector banks which currently have a net NPA ratio of greater than 6 per cent. Hence, the PCA framework will apply to all of these banks. The first risk level of the PCA framework will apply to all these banks.

Of these ten banks have an NPA of greater than 9 per cent. The second risk level of the PCA framework will apply to these banks. Two banks have an NPA of greater than 12 per cent. The Indian Overseas Bank is the worst of the lot at 14.3 per cent. The State Bank of Patiala came in next as of December 2016. This bank has since been merged with the State Bank of India.

The PCA framework will essentially limit the ability of these banks to carry out business and hence, limit further damage to the bank and the financial system.

Nevertheless, there is no way the framework will clear up the mess that these banks are in. For that what is needed is a lot of political will to go after corporates and recover the bad loans that are outstanding. The question is do we have that kind of political will?

The column originally appeared on Firstpost on April 19, 2017 

Why Rich Indians Don’t Donate Their Wealth

220px-Azim_H._Premji_World_Economic_Forum_2013

In economics there is this concept called the diminishing marginal rate of utility. While the term sounds pretty complicated, the concept isn’t.

As James Kwak writes in Economism—Bad Economics and the Rise of Inequality: “People generally gain utility by having more stuff—more food, more clothes, more toys—or at least people behave that way. But the more you have of a particular thing, the less you benefit from getting even more of it.”

A good example of diminishing marginal utility is a comparison between two individuals making an extra Rs 10 lakh, during the course of a year. In the first individual’s case his salary doubles from Rs 5 lakh to Rs 10 lakh. In the second individual’s case, the salary increases by 5 per cent from Rs 1 crore to Rs 1.05 crore.

While the Rs 5 lakh increase in the second case might seem like small change, in the first case it is clearly a lot of money. And this is the basic point behind diminishing marginal utility—as you have more and more of something, the less it matters.

As Kwak writes: “This concept applies to most things—think about eating five pieces of pizza in a row—but in particular it applies to overall wealth: an increase in your net worth from $1 million to $1.1 million will never be as significant as going from $0 to $100,000.”

The point being that as overall wealth goes up, it matters less and less, or at least it should matter less and less to the person earning it. And if that is the case we should see more and more rich donate their wealth to noble causes. But that is clearly not the case in India, Azim Premji notwithstanding.

A simple reason for this could lie in the fact that income and wealth are ways through which the wealthy “keep score in a long-running competition with each other”. The other major reason may lie in the fact that in India people like to leave their wealth to their families. And that to an extent explains why any mention of inheritance tax in the country gets hugely negative reactions. Further, that may also be a reason as to why the rich don’t donate even a fraction of their wealth.

The second reason needs to be elaborated on. Typically, it’s the businessmen who tend to be rich and have more money than others. While, the first generation builds the business, in most cases, the second and the third generation are not able to do much with it, though there are always examples in which case the second generation does better.

Gurcharan Das in his book India Unbound talks about a book titled Buddenbrooks written by Thomas Mann. He calls it the best book ever written on family businesses. As he writes about the book: “It describes the saga of three generations: in the first generation the scruffy and astute patriarch works hard and makes money. Born into money, the second generation does not want more money. It wants power… Born into money and power, the third generation dedicates itself to art. So the aesthetic but physically weak grandson plays music. There is no one to look after the business and it is the end of the Buddenbrook family.”

How is this linked with the rich not donating their money? At some level, the individual starting and running a business knows that his company may not survive the test of time, when he is no longer there to run it. His progeny may not have the same instinct or for that matter inclination towards business.

Hence, it is important for him to ensure that the wealth that he has built up through his business over a period of time, continues to remain with the family, so that the coming generations can continue to have a good and a comfortable lifestyle. And that is only possible if the wealth is not donated away and continues to remain in the family.

The column originally appeared in Bangalore Mirror on April 19, 2017

Digital Payments Go Up in March, But a Large Part is Seasonal

paytm_logo

I have been closely tracking the increase in currency in circulation and the volume of digital payments being made by Indians, for some time now.

The idea is to check if people are “increasingly” moving towards digital modes of payment in the aftermath of demonetisation. Having more and more people go digital has emerged as one of the motives for demonetisation.

I use the word increasingly because even without demonetisation, people have been moving towards digital modes of payment over the years at a pretty good rate.

Look at Table 1. It shows the volume of digital transactions happening in India over the last few months. This table has been reproduced from a report titled Macroeconomic Impact of Demonetisation: A Preliminary Assessment, authored by the Reserve Bank of India and published on March 10, 2017. The table had data until February 2017, I have updated it for March 2017 as well.

Table 1: Number of digital transactions.

Volume (in Crore)Nov-16Dec-16Jan-17Feb-17Mar-17
National Electronic Funds Transfer12.316.616.414.818.7
Cheque Truncation System8.71311.81011.9
Immediate Payment Service3.65.36.266.7
Unified Payment Interface0.030.20.420.420.62
Unstructured Supplementary Service Data00.010.030.020.02
Debit and Credit Card Usage at Point of Sales20.631.126.621.223
Prepaid Payment Instrument5.98.88.77.89
Total51.175.070.260.269.9

Source: Reserve Bank of IndiaBetween February 2017 and March 2017, the total number of digital transactions has jumped by around 16 per cent to 69.9 crore. There are two reasons for it. One is the fact that the rate of increase in currency circulation has gone down dramatically during the month of March 2017.

This is something I had discussed last week. Take a look at Figure 1. It plots the rate at which currency circulation has been increasing week on week since January 6, 2017.

Figure 1: 

Due to reasons which only the government or the RBI can explain, the rate of increase in currency circulation has been slowing during the course of March. What does this mean? The currency in circulation as on March 3, 2017, was at Rs 11,98,412 crore. This increased to Rs 12,45,819 crore as on March 10, 2017. This meant a jump of Rs 47,407 crore or around 4 per cent (Rs 47,407 crore crore divided by Rs 11,98,412 crore). This jump of 4 per cent is referred to as the rate of increase in currency circulation.

For the week ending March 30, 2017, the currency in circulation increased by just 1.7 per cent. Hence, even though the currency in circulation is going up, the rate at which it is going up has slowed down dramatically. For the week ending January 13, 2017, it had grown by 5.9 per cent.

This slow growth of currency in circulation wasn’t enough to satiate the demand of the public and to a large extent explains why ATMs have generally been running dry. And this to some extent explains the increase in digital transactions.

Take a look at debit and credit card usage at point of sale terminals in Table 1. After falling dramatically in between January and February 2017, they have jumped up again by 8.5 per cent during the course of March. This is a good indicator of the fact that the shortage of currency forced people to use digital money.

Over and above this, there is a seasonality factor as well. March is the last month of the financial year and digital payments seem to go up during the course of the month, as people pay their taxes (advance income tax and service tax) as well as settle business payments between them.

Take a look at Table 2. It shows the digital payments made between November 2015 and April 2016. It shows that the digital payments showed a jump between February 2016 and March 2016.

Table 2:

Volume (in Crore)Nov-15Dec-15Jan-16Feb-16Mar-16Apr-16
National Electronic Funds Transfer101211.91112.911.2
Cheque Truncation System7.18.27.88.48.87.9
Immediate Payment Service1.92.12.32.42.62.7
Debit and Credit Card Usage at Point of Sales16.617.81817.218.519.1
Prepaid Payment Instrument6.36.96.56.57.26.9
Total41.94746.545.55047.8

Source: Reserve Bank of IndiaIn Table 2, I have ignored Unified Payment Interface as well as Unstructured Supplementary Service Data, given that the numbers are very small and do not have any overall impact. As can be seen from Table 2, the total number of digital transactions in March 2016, went up by around 9.9 per cent to 50 crore, in comparison to February 2016.

Between February 2017 and March 2017, the jump was at 15 per cent (ignoring Unified Payment Interface as well as Unstructured Supplementary Service Data). As explained earlier, a part of this jump is because of shortage of cash, something that the government wants and a part of this jump is simple seasonality as people make their tax payments and settle their year-end business payments.

As can be seen from Table 2, in April 2016, the total number of digital transactions fell by around 4.4 per cent. Given this, once April 2017, data comes out, we will get a much clearer trend on the impact of demonetisation and shortage of cash on digital payments.

Dear Reader, keep watching this space.

The column originally appeared on Equitymaster on April 19, 2017

But What About the Rs 2,000 Note?

In the Diary dated December 13, 2016, I had tried to answer a question: The question was what portion of black money is held in the form of cash.

In order to answer the question I had reproduced some data out of the White Paper on Black Money published by the Manmohan Singh government in May 2012. This data was reproduced in the form of two tables. The tables had data from the search and seizure operations carried out by the income tax department. They are reproduced below:

Table 1: Value of assets seized (in Rs. Crore)

YearCashJewelleryOther assetsTotal Undisclosed Income
Admitted (in Rs Crore)
2006-07187.4899.1977.963,612.89
2007-08206.35128.0793.394,160.58
2008-09339.86122.1888.194,613.06
2009-10300.97132.20530.338,101.35
2010-11440.28184.15150.5510,649.16
2011-12499.91271.40134.309,289.43

Source: White Paper on Black MoneyThe cash seized at the time the search and seizure operations were carried out by the income tax department, was a small portion of the total undisclosed income. This becomes clear from Table 2.

Table 2:

YearCashTotal Undisclosed Income
Admitted (in Rs Crore)
Proportion of cash in total
undisclosed wealth
2006-07187.483,612.895.2%
2007-08206.354,160.585.0%
2008-09339.864,613.067.4%
2009-10300.978,101.353.7%
2010-11440.2810,649.164.1%
2011-12499.919,289.435.4%
Total1,974.8540,426.474.9%

Source: Author calculations based on White Paper on Black MoneySo what do the tables tell us? They tell us that a very small portion of black money is held in the form of cash. People tend to hold their black money in the form of assets other than cash. And given this, what was the point of carrying out the demonetisation exercise which tried to tackle black money held in the form of cash, is a question worth asking.

As the ministry of finance press release on demonetisation said: “Use of high denomination notes for storage of unaccounted wealth has been evident from cash recoveries made by law enforcement agencies from time to time. High denomination notes are known to facilitate generation of black money.” By demonetising the notes of Rs 500 and Rs 1,000, the idea perhaps was to ensure that a lot of black money is deposited into banks. And after that the government would find ways of recovering it.

So far so good. By now, you must be wondering dear reader, as to why am I repeating things which I have already pointed out earlier, perhaps multiple times. What is the current context? Well, over the weekend I happened to read a recently published book titled Demonetisation and Black Money written by C Rammanohar Reddy.

On Page 61 of the book Reddy has a table which is more or less similar to the Table 1 earlier in the Diary. The point he is trying to make is the same as the point I made earlier, i.e., very little of black money is held in the form of cash. Hence, Reddy goes on to say: “Thus, prima facie, cash is not a dominant component of the aggregate stock of black money or of the total value of transactions in the black economy.”

If cash is not a dominant component of the black money i.e. people don’t hold a significant portion of their black money in the form of cash, then attacking it through demonetisation does not seem to make any sense. But Reddy does not totally agree with this and offers two reasons on why attacking the cash component of the economy through demonetisation can be justified. As he writes: “First, because cash is one instrument which is used for both transactions and investment-more for the former than for the latter—an attack on ‘black cash’, as it were, could have a disruptive effect on the market value of the stocks in the black economy.”

Honestly, this is the first well argued point that I have come across in support of demonetisation. What does it mean in simple English? People who have black money do not hoard it in the form of cash, that is a given. Despite that transactions in the black economy are carried out in the form of cash.

Take the case of a home that has been bought using both white money and black money. When it is sold, the payment will be sought both in white money in the form of a cheque, and black money in the form of cash. Hence, as Reddy puts it: “The availability of a buyer with cash becomes critical for effecting the transaction… Cash, is not a dominant part of the black economy, [but] it lends liquidity to the transactions in the black economy“. If you take cash out of the system, you make it difficult for those who transact in the black economy to continue transacting. And to that extent, there was some justification for demonetisation.

As I said earlier Reddy had offered two reasons in favour of attacking the cash component. Here is the second reason. As he writes: “Second, attacking cash may be the most effective way of communicating the government’s determination to deal with the black economy. So any attempts to disable its use may send the appropriate signals to the holders of unaccounted wealth and to people at large.” This is also a relevant point. It is easier for a government to attack cash than it attack hoards of black wealth held in the form of gold and real estate. That would be significantly tougher.

These are two very good reasons offered in favour of demonetisation carried out by the Narendra Modi government on November 8, 2016. Having said that along with demonetisation the government did something which has entirely opposite of what it was trying to achieve. It introduced a Rs 2,000 note replacing the Rs 1,000 note.

As mentioned earlier, while cash is not used to store black money, it is used to carry out transactions in the black economy. Also, higher the denomination of the paper money, easier it is carry out transactions in the black economy. It also makes it easier to store black money in the form of cash.

As Reddy writes: “It may have been a strange decision to take to introduce a new currency of even higher denomination, given that one of the objectives of the entire exercise was to remove high denomination notes from circulation.”

One reason for introducing a Rs 2,000, a note of higher denomination than Rs 500 and Rs 1,000 notes which were demonetised, lies in the fact that it accelerated the process of remonetisation i.e. the process of printing notes and pumping them into the financial system. It takes one Rs 2,000 note to replace two Rs 1,000 notes or four Rs 500 notes. Hence, the process of remonetisation works faster.

Having said that, it goes against the entire idea of demonetising in the first place. A Rs 2,000 note makes it even more easier to carry out transactions in black than a Rs 1,000 note, given that fewer notes are needed. It also makes it easier to store black money in the form of cash due to the same reason.

Hence, it is important that the government withdraw the Rs 2,000 note. It needs to do this gradually over a period of time. The Rs 1,000 note needs to be re-introduced. The moment a Rs 2,000 note comes back to a bank, it needs to be replaced by two Rs 1,000 notes. A date also needs to be set by which the Rs 2,000 notes need to deposited back into the banks.

Again, it is important that the mess that was created in the aftermath of demonetisation be avoided. This can be done by having a last date which is a couple of years down the line. The RBI has carried out phased withdrawal of currency in the past, which is precisely what can be done in this case as well.

The column originally appeared in Equitymaster on April 1, 2017