Go West at your own peril

go west(Go West) Life is peaceful there
(Go West) In the open air
(Go West) Where the skies are blue
(Go West) This is what we’re gonna do
– Pet Shop Boys, a British pop group

I heard this song sometime in the early 1990s when MTV first came to India. A few years later when words like career, job and degree first intruded into my rather peaceful middle-class existence, the lines of the Go West started to make even more sense to me.

Back then, in the small town that I come from, a person was deemed to be successful, if he completed his engineering degree, perhaps did an MBA to follow it up, got married and then went to work in the United States of America. If not the United States, the United Kingdom was just about fine.

Parents beamed in pride if their sons (yes, primarily sons) went to work in the West. But all that was nearly two decades back. Ironically, I still see the same story playing out with many parents and their sons (yes, still sons). There is still great pressure from parents to Go West. Parents still take great pleasure in telling others if their sons are going abroad to work, even for a few days.

But this fascination to Go West may no longer be a formula for success. Between the early 1980s and 2008, the Western countries, in particular the United States, did reasonably well on the economic front.

All this changed in mid-September 2008, when the investment bank Lehman Brothers went bust, and the current financial crisis started. Since then, the Western countries have taken various measures to tackle the low economic growth, but they have been unsuccessful at it.

As Satyajit Das writes in his new book The Age of Stagnation—Why Perpetual Growth is Unattainable and the Global Economy is in Peril: “The assumption was that government spending, lower interest rates, and the supply of liquidity (or cash) to money markets would create growth…But activity did not respond to these traditional measures.”

In fact, conditions in the economy haven’t returned to the way they were before the crisis started. As Das writes: “Conditions in the real economy have not returned to normal. Must- have latest electronic gadgets cannot obscure the fact that living standards for most people are stagnant. Job insecurity has risen. Wages are static, when they are not falling. Accepted perquisites of life in developed countries, such as education, houses, health services, aged care, savings and retirement, are increasingly unattainable. Future generations may have fewer opportunities and lower living standards than their parents.”

The basic problem is that the Western countries are not making ‘enough’ things. As Raghuram Rajan and Luigi Zingales write in Saving Capitalism from the Capitalists: “For decades before the financial crisis in 2008, advanced econo­mies were losing their ability to grow by making useful things.”

Further, as Thomas Piketty points out in Capital in the Twenty First Century, between 1900 and 1980, 70–80 percent of the glo­bal production of goods happened in the United States and Europe. By 2010, this share had declined to around 50 percent, around the same level it was at in 1860. This has led to loss of jobs and a slow economic growth through much of the Western world.

The politicians tried to correct for this by encouraging easy credit. As Rajan and Zingales write: “They needed to somehow replace the jobs that had been lost to technology and foreign competition… So in an effort to pump up growth, governments spent more than they could afford and promoted easy credit to get households to do the same. The growth that these countries engineered, with its dependence on borrow­ing, proved unsustainable.”

This formula is being repeated by the Western countries, in the aftermath of the financial crisis. Nevertheless, this time around easy credit hasn’t led to economic growth and like it had in the past, this will also end badly.

Hence, Go West at your own peril.

(Vivek Kaul is the author of the Easy Money trilogy. He tweets @kaul_vivek)

The column originally appeared in the Bangalore Mirror on December 23, 2015
Mr Jaitley, what is India’s ‘real’ fiscal deficit?

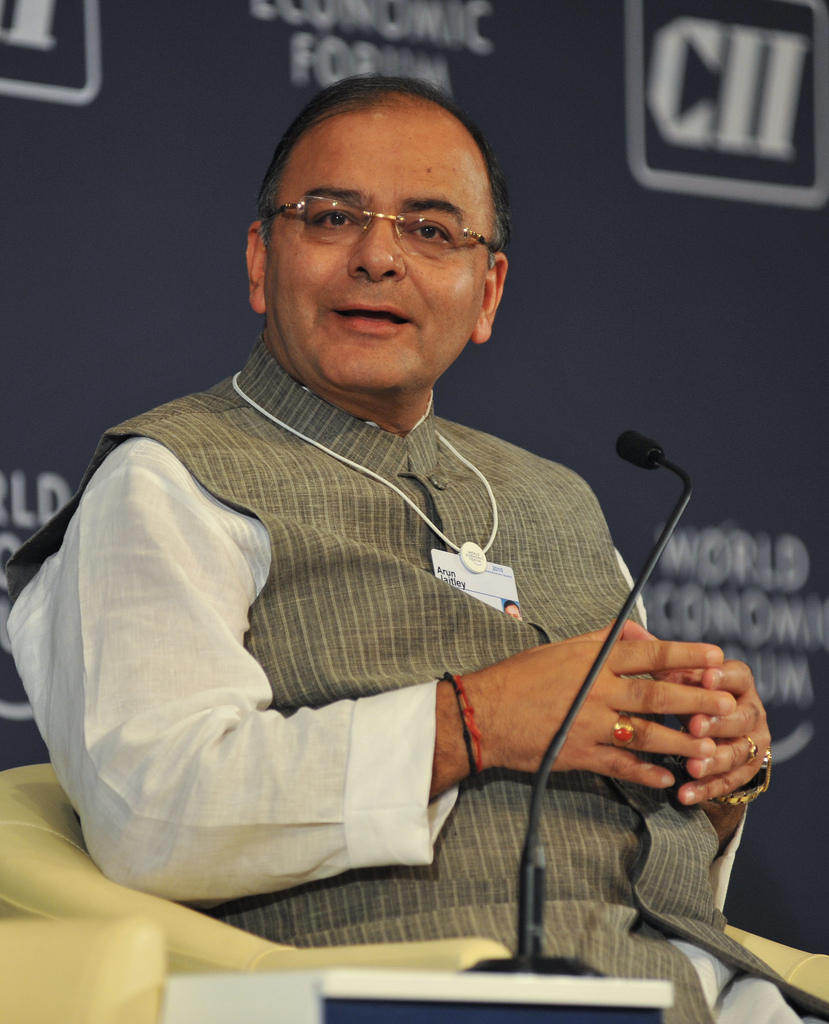
Fostering Public Leadership - World Economic Forum - India Economic Summit 2010
The ministry of finance released the Mid-Year Economic Analysis for 2015-2016(April 2015 to March 2016) last week. One of the worrying things that it pointed out in the report was regarding India’s fiscal deficit. Fiscal deficit is the difference between what a government earns and what it spends.

In the annual budget for 2015-2016, it was projected that the fiscal deficit for the year would work out to Rs 5,55,649 crore or 3.9% of the gross domestic product (GDP). From the way things stand as of now it is highly unlikely that this number will be achieved.

Why is that? It is all about the way the GDP number has been calculated. When the government says that it expects the fiscal deficit to be at 3.9% of the GDP, it is talking about the GDP in nominal terms. Nominal GDP is essentially GDP which hasn’t been adjusted for inflation. The GDP for 2015-2016 has been projected at Rs 14,108,945 crore by assuming an 11.5% growth over the GDP of Rs 12,653,762 crore for 2014-2015 (April 2014 to March 2015).

Hence, the projected fiscal deficit of Rs 5,55,649 crore expressed as a proportion of the projected nominal GDP of Rs 14,108,945 crore is 3.9%. So far so good.
The trouble is that 11.5% growth is turning out to be an extremely optimistic assumption. The Mid-Year Economic Analysis points out that the GDP growth during the first six months of 2015-2016, has been at 8.2% instead of the assumed 11.5%. And this is a huge gap.

If the GDP is to grow by 11.2% during the course of the year, then it needs to grow by 13.6% during the second half of the year. i.e. between October 2015 and March 2016.

The way things stand as of now that seems highly unlikely. So how will the fiscal deficit look if the GDP grows by only 8.2% during the course of the year? In that case, the fiscal deficit will work out to 4.1% of the GDP, assuming that the absolute number of Rs 5,55,649 crore, does not change. Hence, the fiscal deficit will see a jump of 20 basis points from the expected 3.9% to the actual 4.1%. One basis point equals one hundredth of a percentage.

As the Mid-Year Economic Analysis points out: “It is true that the decline in nominal GDP growth relative to the budget assumption will pose a challenge for meeting the fiscal deficit target of 3.9 per cent of GDP. Slower-than-anticipated nominal GDP growth (8.2 percent versus budget estimate of 11.5) will itself raise the deficit target by 0.2 percent of GDP. The anticipated shortfall in disinvestment receipts, owing to adverse market conditions for a portfolio that largely comprises commodity stocks, will add to the challenge.”

So how does the government plan to tackle this challenge? As the Mid-Year Economic Analysis points out: “Tax collections have been buoyant. That plus the additional revenue measures (the Swachh Bharat cess and recent increases in excise) will ensure that central government’s target will be met.”

Last week the government raised the excise duty on petrol and diesel again by Rs 0.30 per litre and Rs 1.17 per litre respectively. This will add Rs 2,500 crore to the government kitty during the remaining part of the year. The total excise duty on petrol and diesel currently stands at Rs 19.36 and Rs 11.83 per litre.

Excise duty on diesel and petrol has been a major source of finance for the government. As Harsh Damodaran writes in The Indian Express: “Since June 2014, the specific excise duty on diesel has been hiked from Rs 3.56 to Rs 11.83 per litre, and from Rs 9.48 to Rs 19.36 per litre for petrol. The annual revenue gain to it from these increases would add up to Rs 95,000 crore or so — Rs 68,000 crore from diesel, and Rs 27,000 crore from petrol.” The excise duty has been hiked seven times since November 2014.

Getting back to the fiscal deficit—it is more than likely that the government will meet the fiscal deficit target of 3.9% of the GDP. This will be achieved through higher excise duty collections. Don’t be surprised if the excise duty on petrol and diesel is increased further, if the price of oil falls any further (let’s say it goes below $30 per barrel). Along with that some expenditure cuts will also have to be made. As the Mid-Year Economic Analysis points out: “If the typical pattern of revenue collection and spending is taken into account, the first half outturn is well in line with meeting the year’s target.”

Nevertheless, it needs to be pointed out here that the government has been postponing the payment of fertilizer as well as food subsidies. As the economist Ashok Gulati writes in The Indian Express: “Fertiliser policy is in a mess. Unpaid fertiliser subsidy bills to the industry have crossed Rs 40,000 crore, and will likely reach Rs 48,000 crore by the end of this fiscal year, as per industry estimates…The finance minister may be smart enough to show that the fiscal deficit is under control, but unpaid fertiliser and food subsidy bills have together already crossed Rs 1,00,000 crore.”

Over and above this, a report in The Financial Express points out that the unpaid subsidy of the Food Corporation of India (FCI) was at an all-time high of Rs 73,650 crore as of March 2015. What this tells us very clearly is that the fiscal deficit number of 3.9% of the GDP is incorrect. It has been achieved by the government postponing the payment of subsidies.

This is not a good practice given that the aim of any accounting should be to put forward the correct financial picture. By postponing the payment of bills, the government beats that very purpose.

It needs to be pointed out here that this isn’t something that the Narendra Modi government started. It was something that they have inherited from the previous Congress led United Progressive Alliance government.

Having said that it is now their problem and it needs to be tackled, instead of just being postponed. As Gulati writes: “Clear the arrears…If not in one go, the finance minister could commit to doing this over two years. Blaming the previous government for the mess will not help.

Indeed, that is a sensible suggestion which the finance minister Arun Jaitley should implement when he presents the next budget in February 2016. Also, a part of the finance for these payments could be raised through shutting of loss making public sector enterprises and selling off their assets (primarily land in cities which is in perennial short supply).

The question is will Jaitley choose to clean up the government accounts or postpone the problem again? My bet is on the latter. How about yours?

The column originally appeared on The Daily Reckoning on December 22, 2015


Why exports have fallen 12 months in a row

deflation

This is something I should have written last week but with all the focus on the Federal Reserve of the United States, the analysis of India’s export numbers had to take a backseat.

Merchandise exports (goods exports) for the month of November 2015 were down by 24.4% to $20 billion. Take a look at the following table. What it tells us is that the performance on the exports front has been much worse during the second half of 2015. During the first six months of the year the total exports fell by 16.4% in comparison to the same period in 2014. Between July and November 2015, exports have fallen by 19.7%, in comparison to July and November 2014.

MonthExports (in $ billion) in 2015

Exports (in $ billion) in 2014

% fall
January23.926.911.15%
February21.525.415.35%
March23.930.321.12%
April22.125.613.67%
May22.32820.36%
June22.326.515.85%
July23.125.810.47%
August21.326.820.52%
September21.828.924.57%
October21.325.917.76%
November2026.524.53%

Why have the exports fallen so dramatically? A major reason for the same lies in the fact that oil prices have been falling for a while now. At the beginning November 2014, the price of Indian basket of crude oil was at around $81 per barrel. Since then price of oil has fallen to $34 per barrel, a fall of around 58%.

But how does that impact Indian exports? India imports 80% of the oil that it consumes. Given this, any fall in the price of oil is usually welcome. The oil marketing companies need to spend fewer dollars in order to buy oil. At least that is the way one looks at things in the conventional sort of way. What most people don’t know is that in October 2014, petroleum products were India’s number one export at $5.7 billion. Several Indian companies run oil refineries which refine crude oil and then export petroleum products.

In November 2014, petroleum products were India’s second largest export at $ 4.7 billion. In November 2015, the export of petroleum products was down by 53.9% to $2.2 billion, in comparison to a year earlier. Also, petroleum is now India’s third largest exports behind engineering goods and gems and jewellery. This is a clear impact of the fall in price of oil price.

How do things look if we were to take a look just at exports of non-petroleum products? Exports of non-petroleum products in November 2015 was down by 18.3% to $17.8 billion. This doesn’t look as bad as fall of 24.4% of the overall exports, but is bad nonetheless.

How are India’s other major exports doing? Engineering goods are currently India’s number one export. In the last one year they have fallen 28.6% to $4.7 billion. Gems and jewellery are India’s number two export. In the last one year they have fallen 21.5% to $2.9 billion.

A simple explanation here is that the global economy as a whole has not been doing well and that is bound to have an impact on Indian exports as well.  When other countries are not doing well, they import less and this has had an impact on Indian exports.

As Dharmakirti Joshi and Adhish Verma economists at Crisil Research write in a research note titled Exports, Hex, Vex: “Global growth recovery has been slow and uneven. In its latest world economic outlook released in October, the International Monetary Fund (IMF) downgraded its global growth forecast for 2015 to 3.1% from 3.3% earlier. The World Trade Organisation has predicted stagnant trade growth at 2.8% in 2015, which implies annual trade growth would be below 3% for the fourth consecutive year compared to over 7% in the pre-financial crisis period…This suggests global trade has fallen more than world growth, implying trade intensity of world GDP has declined – a worrying phenomenon for export-dependent economies.

But have Indian exports just because global growth and in the process global trade have slowed down? As Joshi and Verma write: “For instance, while world real GDP growth improved from 3.2% in 2009-2011 to 3.4% in 2012-2014, India’s real growth of exports came down from 11.1% to 4.1%. This suggests the decline isn’t merely cyclical; there are structural elements at play as well. The cyclical component of exports will move up when cyclical factors (world GDP growth, prices) turn favourable, but structural factors, if not addressed, will continue to act as a drag on India’s export performance. Falling competitiveness is one of the structural factors restricting export growth. For key export items such as gems & jewellery and textiles, revealed comparative advantage has come down over the years.”

So Indian exports have come down also because their competitiveness vis a vis goods from other nations has gone down over the years. It’s not just about slowing global economic growth.

How are things looking on the imports front? Imports in the month of November 2015 fell by 30.3% to $29.8 billion. This is primarily on account of a huge fall in oil imports due to plummeting oil prices. Oil imports during November 2015 fell by a whopping 45% to $6.4 billion.

If we ignore oil imports from the total imports number, how do things look? Total imports ignoring oil were down by 24.5% to 23.4 billion in November 2015 in comparison to a year earlier. In fact, if we look at non-oil non-gold imports things get interesting. Non-oil non-gold imports for the month of November 2015 have fallen by 22.1% to $19.8 billion. This number is a very good reflection of how consumer demand as well industrial demand is holding up and still hasn’t recovered. And things clearly aren’t looking good on this front.

The column originally appeared on The Daily Reckoning on Dec 21, 2015

Janet Yellen raises interest rates. What happens next?

yellen_janet_040512_8x10

In the column dated December 16, 2015, I had said that the Federal Reserve of the United States would raise the federal funds rate, at the end of its meeting which was scheduled on December 15-16, 2015. That was the easy bit given that Janet Yellen, chairperson of the Federal Reserve of the United States, had more or less made this clear in a speech she made on December 3, 2015.

The Federal Open Market Committee(FOMC) of the Federal Reserve of the United States raised the federal funds rate by 25 basis points (one basis point is one hundredth of a percentage) to be in the range of 0.25-0.5%. Earlier, the federal funds rate moved in the range of 0-0.25%. FOMC is a committee within the Federal Reserve which runs the monetary policy of the United States

The federal funds rate is the interest rate at which one bank lends funds maintained at the Federal Reserve to another bank on an overnight basis. It acts as a sort of a benchmark for the interest rates that banks charge on their short and medium term loans. This is the first time that the FOMC has raised the federal funds rate since mid-2006.

I had also said that the Yellen led FOMC would make it very clear that the increase in the federal funds rate would happen at a very gradual pace. The statement released by the FOMC said that it expects the “economic conditions will evolve in a manner that will warrant only gradual increases in the federal funds rate; the federal funds rate is likely to remain, for some time, below levels that are expected to prevail in the longer run.”

As Yellen put it in central banking parlance in the press conference that followed the Federal Reserve meeting: “The monetary policy will continue to remain accomodative”. In fact, the members of the FOMC expect the federal funds rate to be at 1.4% in a year, 2.4% in two years and 3.3% in three years.

If the federal funds rate has to be at 1.4% one year down the line, then it means that the FOMC will have to raise the federal funds rate by around 25 basis points each (one basis point is one hundredth of a percentage) four times next year. This seems to be a little difficult given that the presidential elections are scheduled in the United States next year. Also, there are other problems that this could create.

The low interest rate policy was unleashed by the Federal Reserve in the aftermath of the financial crisis which started in September 2008, when Lehman Brothers, the fourth largest investment bank on Wall Street went bust. The hope was that both households and corporations would borrow and spend more and in the process, economic growth would return.

What has happened? The household debt to gross domestic product(GDP) ratio has been falling since the beginning of 2009 as can be seen from the accompanying chart.


The household debt to GDP ratio has fallen from around 98% of the GDP at the beginning of 2009, around the time the financial crisis had just started to around 79.8% of the GDP now. What this tells us is that the household debt as a proportion of the total economy has come down. This despite low interest rates being prevalent when at least theoretically people should have borrowed and spent more money.

Take a look at the following chart. It shows that the proportion of the disposable income that Americans are paying to service their debts has also improved. In end 2007, Americans were spending 13.1% of their disposable income to service debt. It has since fallen to 10.1%, though it has jumped a little in the recent past. But the broader trend is clearly down.

What these two graphs tell us clearly is that the household debt in the United States has come down in the aftermath of the financial crisis. So if households have not been borrowing who has? The answer is corporates.

As Albert Edwards of Societe Generale wrote in a research note in November: “The primary driver for the rapid rise in bank lending…has been borrowing by US corporates and we all know they have been using the Fed’s free money not to invest in capacity expanding expenditures, but rather to buy back mountains of their own shares…Corporate debt borrowing at an $674bn annual rate [is] closing in rapidly on the all-time borrowing splurge of 2007!

In another note released after the FOMC decision to raise the federal funds rate Edwards writes that “the real rate of corporate borrowing is even greater than was seen during the late 1990s tech bubble.”

American corporates have borrowed at rock bottom interest rates not to expand their capacities by building more factories among other things, but to buy back their shares. When a corporate buys back and extinguishes its own shares, fewer number of shares remain in the open market. This pushes up the earnings per share of the company. This in turn pushes up the share price. A higher earnings per share leads to a higher market price.

As a result of all this borrowing, the US corporate debt has reached 70% of the GDP, around the level it was at the time the financial crisis started. A Goldman Sachs research note points out that between 2007 and now, the total borrowing of the US corporates has doubled.

Nevertheless, all this money needs to be repaid. And this will become increasingly difficult with sales of US corporates falling. As Edwards writes in his latest research note: “It doesn’t help that both corporate profits and revenues are now falling…Nominal business sales have been contracting all year. Originally, it was put down to unseasonably cold weather – but the chilly data has just not gone away, as a combination of unit labour costs and weak pricing power have led to a typical late cycle decline in profit margins.”

If the Federal Reserve keeps increasing the federal funds rate, the interest rate that American corporates need to pay on their debt will keep going up as well.

The interest rate that the American corporates have been paying on their debt has fallen from 6% in 2009 to around 4% in 2015. A higher interest rate would mean a further fall in the profit made by American companies. Lower earnings would lead to lower stock prices and lower broader index levels.

And this is not something that the Federal Reserve would want. A falling stock market because of higher interest rates would jeopardise the American economic recovery.

As Yellen said in her speech earlier this month: “Household spending growth has been particularly solid in 2015, with purchases of new motor vehicles especially strong….Increases in home values and stock market prices in recent years, along with reductions in debt, have pushed up the net worth of households, which also supports consumer spending. Finally, interest rates for borrowers remain low, due in part to the FOMC’s accommodative monetary policy, and these low rates appear to have been especially relevant for consumers considering the purchase of durable good.”

Once we factor in all this, it is safe to say that the Federal Reserve will go really slow at increasing interest rates. In fact, I don’t see it increasing the federal funds rate to 1.4% by the end of next year. This means good news for Indian stock and bond markets, at least for the time being.
The column originally appeared on The Daily Reckoning on December 18, 2015

What the media did not tell you about the economy this month

newspaperAn old adage in journalism goes: “if it bleeds, it leads”. But this doesn’t seem to apply to bad economic news. Allow me to elaborate. Let’s start with new car sales. New car sales are a reliable economic indicator which tell you whether the economy is starting to pick up.

People buy a car only when they feel certain about their job prospects. Further, once car sales pick up, sale of steel, tyres, auto-components, glass etc., also starts to pick up. New car sales have a multiplier effect and hence, are a good indicator of economic growth. At least that’s how one would look at things theoretically.

The jump in the new car sales numbers was on the front page of the Mumbai edition of the leading pink paper where it was reported that sales saw a double digit growth in November 2015. Car sales in November 2015 went by 11.4% to 2,36,664 units, in comparison to November 2014. That is indeed a good jump and does indicate at some level that the consumer sentiment is improving.

But we need to take into account the fact that Diwali this time was in November and that always pushes up car sales. The December 2015 new car sales number will be a proper indicator of whether car sales have actually recovered or not.

Now contrast this with merchandise exports (goods exports) which fell by 24.4% to $20 billion in November 2015, in comparison to the same period last year.

Over and above this, the exports have been falling for the last twelve months. This piece of news was buried in the inside pages of the Mumbai edition of the leading pink paper. Exports are a very important economic indicator. Countries which have driven their masses out of poverty have done so by having a vibrant export sector.

Getting back to car sales. It is important to ask how important car sales are in the Indian context.  As per the 2011 Census, 4.7% of the households owned cars in India. At the same time 21% of households owned two-wheelers (scooters, motorcycles and mopeds (yes, they still get made and sold).

This tells us very clearly that two-wheeler sales are a better economic indicator in the Indian context than car sales. Many more people own two-wheelers than cars. Further, many more people are likely to buy two wheelers than cars given the fact that two-wheelers are more affordable.

And how are two-wheeler sales doing? Not too well. Two wheeler sales in the month of November 2015 went up just 1.47% to 13,20,561 units, in comparison to November 2014. The motorcycle sales went up by 1.57% to 8,66,705 units. Scooter sales went up by 2.45% to 3,96,024 units. And moped sales fell by 6.16% to 57,832 units.

In fact, the increase in two-wheeler sales in November 2015 in comparison to November 2014 stood at just 19,130 units. Whereas the increase in car sales was at 24,226 units. The increase in car sales was greater than two wheeler sales. And this is indeed very surprising, given that total two wheeler sales in November 2015, were 5.6 times the car sales.

You won’t find this very important point having been made in the pink papers. What does this tell us? It tells us that a large part of India is still not comfortable making what is for them an expensive purchase. It also tells us that the consumer demand at the level of the upper middle class (for the lack of a better term), which can afford to buy a car, is much better than it is for others.

The question is why is did the business media miss out on this? A possible explanation is that most of the business media these days is run out of Delhi. And in Delhi everyone owns a car, at least that’s the impression you are likely to get if you work in the media in Delhi. So car sales are important, two wheeler sales are not. But that is really not the case even in Delhi.

As TN Ninan writes in The Turn of the Tortoise—The Challenge and Promise of India’s Future: “In Delhi, according to data collected for the 2011 Census, 20.7 per cent owned cars and 38.9 per cent owned two-wheelers…In a conscious middle-class entity like Gurgaon, neighbouring Delhi…the credit rating agency CRISIL assessed that 30 per cent of households owned cars [and] 38.9 per cent owned two-wheelers.”

Long story short—two wheeler sales are a better economic indicator than car sales. What this also tells us is that any piece of positive news will be played up and highlighted on the front page whereas any piece of negative news will be buried in the inside pages. Why does this happen? Why did the media almost bury the news of very low growth in two-wheeler sales?

Satyajit Das has an explanation for this in his terrific new book The Age of Stagnation—Why Perpetual Growth is Unattainable and the Global Economy is in Peril: “Bad news is bad for business. The media and commentariat, for the most part, accentuate the positive. Facts, they argue, are too depressing. The priority is to maintain the appearance of normality, to engender confidence.”

Also, given that a business newspaper (or for that matter any newspaper) makes money from advertisements and not the price the buyers pay to buy a newspaper, this isn’t surprising.

Of course, you dear reader, need not worry, as long as you keep reading The Daily Reckoning.

The column originally appeared on The Daily Reckoning on December 17, 2015