The Indian Hustler

Ramalinga_Raju_at_the_2008_Indian_Economic_SummitVivek Kaul

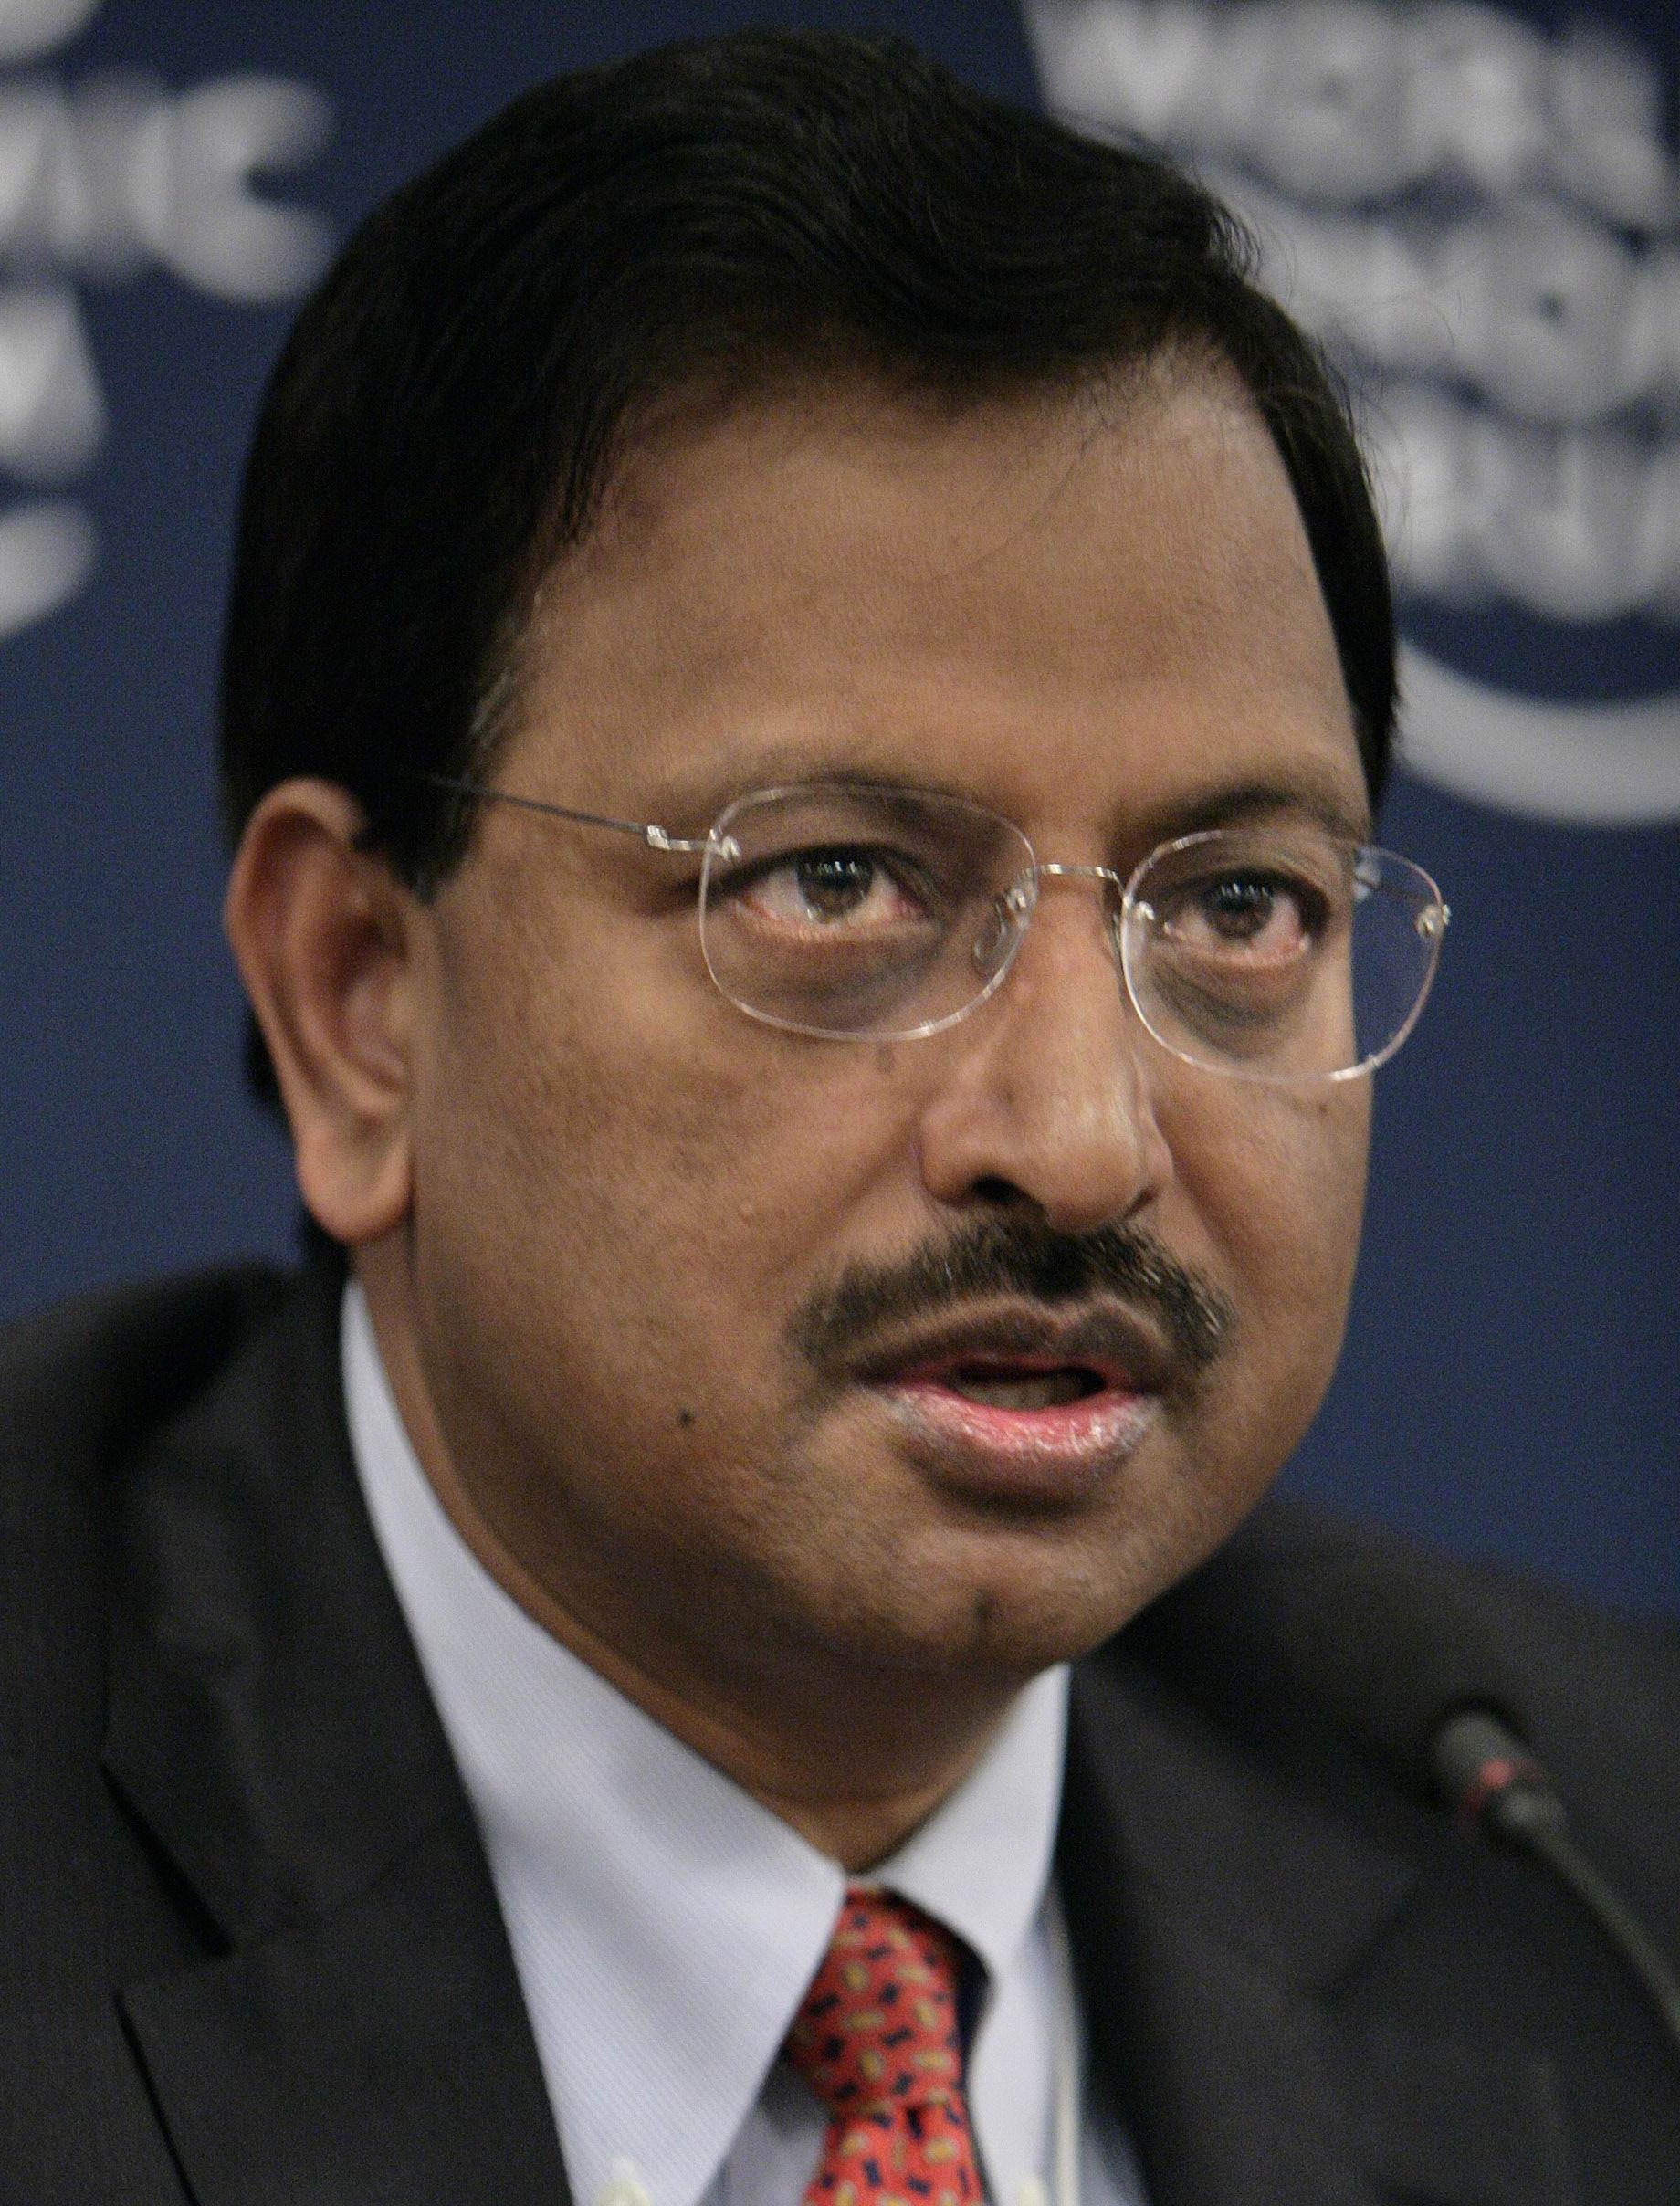
At the heart of it most scams are very simple—Satyam was no different. Sometime in 2003, B Ramalinga Raju, the founder and chairman of Satyam Computer Services started over-declaring revenues of the company. The process continued till 2008. On January 7, 2009, Raju in a letter to the board of directors of the company admitted to fudging the accounts of Satyam.
Between 2003 and 2008, Raju over-declared revenues of the company by creating fictitious clients. Once he had over-declared revenues he automatically ended up over-declaring profits. Over-declared profits had to be invested somewhere. This led to the creation of fictitious bank statements and fixed deposit receipts. With a rapid advancement in the quality of colour printers, creating fictitious bank statements wouldn’t have been very difficult.
In his letter to the board, Raju admitted that the cash and bank balances were hugely overstated. The cash and bank balances of the company as on September 30, 2008(the last time the company declared quarterly results) were at Rs 5,313 crore. Th actual number was at a much lower Rs 273 crore. More than half a decade of declaring fictitious profits had led to a massive jump in the cash and bank balances of the company. But the number, like the profits of the company, was fictitious.
The company was guzzling whatever “real” cash it had at a very fast rate. By the time January 2009 started, the company’s actual cash and bank balance of the company would have been much lower than Rs 273 crore.
One of the theories put forward after Raju admitted to all the wrongdoings in the letter was that only when he realized that the company wouldn’t have enough money to keep paying salaries to its employees did he decide to come out with the truth. As Raju said in his letter: “The company had to carry additional resources and assets to justify higher level of operations…It was like riding a tiger, not knowing how to get off without being eaten.”
The irony is that Raju had to get off the tiger, and he still hasn’t been eaten. Like all big businessmen in India, Raju is also a survivor. A special court in Hyderabad has found him and nine others guilty of cheating, criminal breach of trust, destruction of evidence and forgery. The court pronounced a seven year-jail term for the founder and also imposed a Rs 5 crore fine on him.
It took the judicial system six years and three months to sentence Raju. And this is not the end of it. The decision will be challenged in higher courts and the process will continue for a while.
The question I want to explore in this column is the timing of Raju’s confession. Raju sent a tell-all letter to the Satyam Board in January 2009. Why didn’t he do the same in January 2008? Or even earlier, for that matter, is a question worth asking.
The probable reason is that Raju was confident enough of pulling off the scam till he wasn’t. And why is that? It is worth remembering that between 2003 and 2008, the stock market in India had a huge bull run. The economy was also booming. And in such a scenario, when the financial system is flush with money, it is easy to keep a scam going.
As economic historian Charles Kindleberger writes in
Manias, Panics and Crashes: “The propensities to swindle and be swindled run parallel to the propensity to speculate during a boom.” This precisely what Ramalinga Raju was busy doing.
The stock market started crashing from early 2008, due the advent of what we now call the global financial crisis. And because of this, money wasn’t as easy to raise as was the case earlier. Raju tried to plug the huge gap in Satyam’s balance sheet by buying out two real estate firms Maytas Properties and Maytras Infra. Both these firms were owned by his family (Maytas is the opposite of Satyam).
But by late 2008, an era of easy money had come to an end. And sham transactions were not as easy to pull through. The idea here was to use Satyam’s fake cash and bank balances to buy out the real estate firms and thus have “real” assets on the balance sheet. As Raju wrote in the letter: “ The aborted Maytas acquisition deal was the last attempt to fill the fictitious assets with real ones…Once Satyam’s problem was solved, it was hoped that Maytas’ payments can be delayed.” But this deal fell through after the independent directors on the Satyam board raised issues about an IT company taking over real estate assets. In fact, if Raju had tried to push this deal through a year earlier, chances are that the board might have agreed, given that the going was good at that point of time. And when the going is good no one wants to spoil the party by asking inconvenient questions.
As the economist John Kenneth Galbraith writes in
The Great Crash 1929: “At any given time there exists an inventory of undisclosed embezzlement. This inventory – it should perhaps be called the bezzle – amounts at any moment to many millions of dollars. In good times people are relaxed ,trusting, and money is plentiful. … Under these circumstances the rate of embezzlement grows, the rate of discovery falls off, and the bezzle increases rapidly. In depression all this is reversed. … Just as the (stock market boom) accelerated the rate of growth (of embezzlement), so the crash enormously advanced the rate of discovery.”
Interestingly, the Satyam scam was the first of many scams that were to hit the nation starting in 2009. It was followed by the 2G, Commonwealth games and the coalgate scam. Sahara, Saradha, Rose Valley and many other big Ponzi schemes came to light. The National Spot Exchange scam came to light as well. These scams were mostly executed during the period between 2003 and 2008, when the economy was doing well and the stock market was going from strength to strength, but they were only revealed after the good days came to a stop.
In that sense Raju set the trend of things to come. We have to give him credit for at least that.

(Vivek Kaul is the author of the Easy Money trilogy. He tweets @kaul_vivek)

The article originally appeared in the Daily News and Analysis on April 12, 2015

Even RBI does not trust the new GDP number

RBI-Logo_8
Earlier this year, the ministry of statistics and programme implementation revised the way the gross domestic product(GDP) is calculated. Such a revision is necessary every few years, given that the structure of the economy keeps changing. Over and above that, the datasets that are used to compute the GDP also keep improving. Given this, the change is necessary. This revised method led to the economic growth for 2013-2014 being revised to 6.9% against the earlier 5%. In fact, using the new model, the growth projected for 2014-2015 was forecast to be at 7.4%. Earlier, the Reserve Bank of India (RBI) had projected an economic growth of 5.5% for 2014-2015.
The ruling politicians have caught on to the new economic growth number, with finance minister Arun Jaitley even talking about India returning to double digit economic growth soon. As he said in the budget speech in February: “Based on the new series, real GDP growth is expected to accelerate to 7.4%, making India the fastest growing large economy in the world…We have turned around the economy dramatically, restoring macro-economic stability and creating the conditions for sustainable poverty elimination, job creation and durable double-digit economic growth. Domestic and international investors are seeing us with renewed interest and hope.”
Jaitley’s comment notwithstanding, there has been extensive scepticism about the new growth number. Arvind Subramanian, the chief economic adviser to the ministry of finance in
an interview to the Business Stanard said: “This is mystifying because these numbers, especially the acceleration in 2013-14, are at odds with other features of the macro economy. The year 2013-14 was a crisis year – capital flowed out, interest rates were tightened and there was consolidation – and it is difficult to understand how an economy’s growth could be so high and accelerate so much under such circumstances.”
Andy Mukherjee
writing for Reuters made a very pertinent point when he said: “No large economy has pulled off…such a handsome pickup in output[GDP],to [an]…analysis of 189 nations over 33 years.” Mukherjee was talking about the jump in economic growth in 2013-2014, from the earlier stated 5% to 6.9% as per the new method.
Now even the RBI has questioned the credibility of the new method of measuring the GDP. In the monetary policy report dated April 2015 and released on April 7, the central bank said: “The new GDP data…came as a major surprise as it produced significantly higher growth at constant prices.”
“The divergence between the new series and the old series in the pace of growth of the manufacturing sector has turned out to be stark; in particular, the robust expansion of manufacturing portrayed in the new series is not validated by subdued corporate sector performance in Q3 and still weak industrial production,” the RBI said.
For the period October to December 2014 (or what is referred to as Q3 by the RBI) both corporate profit and sales remained weak. A
newsreport in the Business Standard points out that “aggregate net profit of 2,941 companies” declined by 16.9% in comparison to October to December 2013. The sales growth also has been the weakest in at least 12 quarters, the report points out. This clearly shows that the manufacturing sector continues to remain in a weak zone.
And manufacturing is not the only sector which remains in trouble. As the RBI report points out: “In the financial and real estate sub-sector, the high growth of 13.7 per cent at constant prices is not corroborated by the observed sluggishness in key underlying variables such as credit and deposit growth, housing prices, rent and most importantly, the subdued performance of real estate companies in terms of sales growth and earnings.”
Lending by banks has grown by a minuscule 9.5% in the last one year, data from the RBI points out. In comparison, the growth in deposits collected by banks has been at 11.4%. What also needs to be taken into account here is that the deposit growth has been on a higher base. Both deposit growth as well as loan growth of banks is at a multi-decade low. So, how is the finance as well as real estate sector growing at 13.7%, is a question that RBI is asking?
The RBI report then goes on to say: “Data revisions and their after-effects are not unique to India, but the magnitude of the gap in real GDP growth rates between the old and the new series for 2013-14 and 2014-15 has complicated the setting of monetary policy. Undoubtedly, the new GDP data embody better coverage and improved methodology as per international best practices. Yet these data cloud an accurate assessment of the state of the business cycle and the appropriate monetary policy stance.”
There are multiple things that the central bank is saying here. First, is that it doesn’t really believe in the new GDP number. And that has made the setting of the monetary policy more difficult for the RBI. If India is currently growing at more than 7%, then the RBI should not be cutting the repo rate, but raising it. Repo rate is the rate at which RBI lends to banks and acts as a sort of a benchmark to the interest rates that banks pay for their deposits and in turn charge on their loans.
Nevertheless, all real time data seems to suggest that India is not growing at higher than 7%.
The broader point here is that if the RBI does not believe the new GDP number, why would anyone else do as well? As Ruchir Sharma of Morgan Stanley recently wrote in the
Financial Times: “India’s latest growth data look less like the work of a calculating political machine than the result of bungling… This is a classic example of how Indian bureaucrats can take something that is not broken and fix it until it is…It’s hard to see how India’s economy could have been accelerating when the government was restraining its spending, investment was weak and credit was barely growing.” This clearly does not show India in a good light.
The situation needs to be set right if India does not want to go the Chinese way on this front. Analysts have questioned the validity of Chinese data for a very long time. India clearly needs to avoid going that way. 

The column originally appeared on The Daily Reckoning on Apr 9, 2015

Satyam scam: Ramalinga Raju, the man who knew too much, gets 7 years in jail

Ramalinga_Raju_at_the_2008_Indian_Economic_Summit
A special court in Hyderabad found all the ten accused in the Satyam scam guilty of cheating, forgery, destruction of evidence and criminal breach of trust. This includes the founder and the Chairman of the company B Ramalinga Raju.
The decision came more than six years after the scam first came to light. On January 7, 2009, Raju wrote a letter to the board of directors of Satyam Computer Services, in which he admitted to cooking the books of the company. A copy of the letter was sent to the stock exchanges as well as the Securities and Exchange Board of India.
In this letter Raju admitted to inflating the cash and bank balances of the company by Rs 5,040 crore. The company’s total assets as on September 30, 2008, stood at Rs 8,795 crore. 

Of this cash and bank balances stood at Rs 5,313 crore which was nearly 60% of the total assets.  This was overstated by Rs 5,040 crore. The company basically had cash and bank balances of less than Rs 300 crore.
Raju also admitted to fudging the last financial result that the company had declared, for the period of three months ending September 30, 2008. The company had reported revenues of Rs 2,700 crore, with an operating margin of 24% of revenues or Rs 649 crore. These numbers were made up. The actual revenues were Rs 2,112 crore with an operating margin of Rs 61 crore or 3% of the total revenues.
So, Satyam had made a profit of Rs 61 crore but was declaring a profit of Rs 649 crore. The difference was Rs 588 crore. The operating profit for the quarter was added to the cash and bank balances on the balance sheet. Hence, cash and bank balances went up by an “artificial” Rs 588 crore just for the three month period ending September 30, 2008.
This was a formula that Raju had been using for a while. First Satyam over-declared its operating profit. Once this fudged operating profit was moved to the balance sheet, it ended up over-declaring its cash and bank balances. And this led to a substantially bigger balance sheet than was actually the case.
The company had total assets of Rs 8,795 crore as on September 30, 2008. Once the Rs 5,040 crore of cash and bank balances that were simply not there were removed from this, the “real” total assets fell to a significantly lower Rs 3,755 crore.
Raju went on to say that: “The gap in the Balance Sheet has arisen purely on account of inflated profits over a period of last several years (limited only to Satyam standalone, books of subsidiaries reflecting true performance). What started as a marginal gap between actual operating profit and the one reflected in the books of accounts continued to grow over the years.”
What was Raju upto? Raju’s fraud was no Enron, where complicated derivative transactions were used to boost revenues as well as profit. He had been cooking the books since 2003 by simply over-declaring revenues and profits. In the process he ended up boosting his balance sheet as the cash and bank balances kept going up.
So, how did Raju manage to boost revenues? In order to do this Raju created fictitious clients with whom Satyam had entered into business deals. This was again something akin to Enron, which essentially entered into business deals with its subsidiaries. The subsidiaries paid Enron for the deal by borrowing money. While the revenues brought in from the subsidiaries was recorded by Enron, the debt that they had taken on, wasn’t.
Getting back to Raju, in order to record the fake sales he introduced 7000 fake invoices into the computer system of the company. He couldn’t stop at this.
The clients were fake. Fake clients could not make real payments. Given this, the company kept inflating the money due from its clients (or what Raju called debtors position in his letter).
Further, once fake sales had been recorded, fake profits were made. And fake profits brought in fake cash which needed to be invested somewhere. This led to Raju creating fake bank statements(forged fixed deposit receipts) where all the fake cash that the company was throwing up was being invested.
Raju then tried to use this “fake cash” and buy out two real estate companies called Maytas Properties and Maytras Infra (opposite of Satyam and promoted by the family) for a total of $1.6 billion. But this did not work out. As Raju said in his confessional statement: “The aborted Maytas acquisition deal was the last attempt to fill the fictitious assets with real ones. Maytas’ investors were convinced that this is a good divestment opportunity and a strategic fit. Once Satyam’s problem was solved, it was hoped that Maytas’ payments can be delayed.”
The idea was to have some “real” assets against all the “fake” cash that the company had managed to accumulate. But that did not happen and after this, Raju had no way out but to come clean.
The question is how could Raju run such a big scam for such a long period of time. Satyam’s accounts were audited by Price Waterhouse, a member-firm of PricewaterhouseCoopers International Ltd — since the financial year 2000-2001.
The auditor had no clue that Satyam’s assets were overstated by more than Rs 5,000 crore. When the scam first broke out a middle level executive from a Big 4 consulting firm told me: “All the auditor needed to ask was the bank statements of the various banks in which this (supposed) cash had been deposited or mutual funds it had been invested in. This is overstatement of Rs 5,000 odd crore we are talking about, not Rs 500.” The auditor clearly did not do that.
The auditor is paid to ask questions; in this case it seems to have been paid not to ask any. The company couldn’t have hoodwinked the investors without the auditor being on its side. This was no complicated accounting fraud like Enron was.
The many analysts who covered Satyam also did not have any clue about the fact that the profits as well as revenues of Satyam were fake. Brokerage analysts who follow companies need to keep companies in a good humour. Without that, they run the risk of being given limited or at times no access to the company, at all. This explains why none of the analysts caught on to what was happening at Satyam. It also explains why the number of sell recommendations on stocks put out by brokerage analysts are lower when compared to the number of buy recommendations that brokerages put out.
And finally we come to the media. It had no clue of what was happening at Satyam. One reason for this lies in the fact that the Indian media over the years has been extremely taken in by the IT companies and the people who run them.
The case with Satyam’s Raju was no different. Lot of magazines and newspaper wrote stories on him and painted him as a person who could do no wrong. This blinds investors, media and experts who follow a company. This comes from the need of the media to create a story around the individual.
As Nassim Nicholas Taleb writes in his book 
Fooled by Randomness on how the Halo effect around a CEO is built up by the media: “We would get very interesting and helpful comments on his remarkable style, his incisive mind, and the influences that helped him achieve that success. Some analysts may attribute his achievement to precise elements among his childhood experiences. His biographer will dwell on the wonderful role models provided by his parents; we would be supplied with black and white pictures in the middle of the book of  great mind in the making.”
Something similar had happened with Satyam as well. And given this the media expected Satyam to do no wrong. The Halo effect was clearly at work in case of Satyam as well. Investors could see Raju doing no wrong. Raju even sold his shares in Satyam to fund social causes. How could such a man be a fraud? When the Halo effect is at work, the ability to ask incisive pointed questions clearly goes down, and that’s what happened in Satyam’s case as well.
So, while Raju ran his fraud, the auditor slept, the analysts slept and so did the media. To be fair, the media did an excellent job of exposing Raju and his many other ‘shenanigans’ after he had confessed.
Now more than six years later, the first decision in the Satyam scam has been made. Of course, we haven’t seen the last of this case, given the slow pace at which our judicial system works.
Stay tuned.

(Vivek Kaul is the author of the Easy Money trilogy. He tweets @kaul_vivek)

The column was originally published on Firstpost on Apr 9, 2015

Writing on the wall: Global debt has shot up by $57 trillion since 2007

3D chrome Dollar symbolAnnual income twenty pounds, annual expenditure nineteen pounds nineteen and six, result happiness. Annual income twenty pounds, annual expenditure twenty pounds nought and six, result misery.” – Charles Dickens, David Copperfield

The McKinsey Global Institute recently released a very interesting report titled Debt and (not much) deleveraging. In this report they found that between 2007 and the second quarter of 2014, the total global debt had grown by $57 trillion. The total global debt as of the second quarter of 2014 stood at $199 trillion or 286% of the global GDP.
In 2007, the total global debt had stood at $142 trillion or 269% of the global GDP. This means an increase in debt at the rate of 5.3% per year. What is interesting is the comparison between 2000 and 2007, which allows us to analyse the increase between 2007 and 2014 in a much better way.
In 2000, the total global debt was at $87 trillion or around 246% of the global GDP. Between 2000 and 2007, the global debt went up at the rate of 7.3% per year.
In comparison, the global debt between 2007 and 2014 has gone up by only 5.3%. Further, between 2000 and 2007, the total global debt went up by 2300 basis points to 269% of the global GDP. In comparison, between 2007 and 2014, the global debt went up by 1700 basis points to 286% of the global GDP. One basis point is one hundredth of a percentage.
So, yes the growth in debt has slowed down since 2007, but the debt is still growing. And that is something to worry about. As the McKinsey report points out: “Seven years after the global financial crisis, global debt and leverage have continued to grow. From 2007 through the second quarter of 2014, global debt grew by $57 trillion, raising the ratio of global debt to GDP by 17 percentage points [1700 basis points]. This is not as much as the 23-point increase[2300 basis points] in the seven years before the crisis, but it is enough to raise fresh concerns.”
In fact, the breakdown of the total global debt makes for fairly interesting reading. The growth in household debt has slowed down considerably to 2.8% per year between 2007 and 2014. Between 2000 and 2007 this was at 8.5% per year. This rapid increase in global debt was the major reason behind the global financial crisis.
In the aftermath of the financial crisis, the governments around the developed world have printed a lot of money to drive down interest rates, in the hope of people borrowing and spending more, and economic growth returning. But that hasn’t happened. People don’t seem to be in the mood to make the same mistake again and end up with excess borrowing, as they had in the past.
While the rate of rise in household debt has slowed down considerably, the same cannot be said about government debt. The total government debt all around the world had stood at $33 trillion as of 2007. It has since jumped to $58 trillion, a jump of $25 trillion, at the rate of 9.3% per year.
During the period 2000 and 2007, government debt had increased at the rate of 5.8% per year to $33 trillion (from $22 trillion).
Governments all around the world in the aftermath of the financial crisis have increased their expenditure, in the hope of reviving economic growth. The countries which were in the biggest mess in the aftermath of the financial crisis saw their governments raise the most amount of debt. “Not surprisingly, the rise in government debt, as a share of GDP, has been steepest in countries that faced the most severe recessions: Ireland, Spain, Portugal, and the United Kingdom,” the McKinsey report points out.
This explains the dramatic jump in government debt since 2007. As the McKinsey report asks: “This raises fundamental questions about why modern economies seem to require increasing amounts of debt to support GDP growth and how growth can be sustained.”
In the past very few countries have been able to repay their debt, once they have crossed a certain level. In fact, one of the rare occasions in history when a country did not default on its debt either by simply stopping repayment or through inflation was when Great Britain repaid its debt in the 19th century.
The country had borrowed a lot to finance its war with the American revolutionaries and then the many wars with France in the Napoleonic era. The public debt of Great Britain was close to 100 percent of the GDP in the early 1770s. It rose to 200 percent of the GDP by the 1810s.
It would take a century of budget surpluses run by the government for the level of debt to come down to a more manageable level of 30 percent of the GDP. (Budget surplus is a situation where the revenues of a government are greater than its expenditure.) Between 1815 and 1914, tax revenues of the British government exceeded its expenditure by several percent of the GDP. (Source: Thomas Piketty’s 
Capital in the Twenty-First Century). It is worth remembering here that this was during a time when Great Britain ruled large parts of the world.
There have been a few other examples of countries repaying their debt. In the aftermath of the Second World War, the total government debt in the United States was at 121% of GDP. In the United Kingdom it was at 238% of GDP. Both the countries brought down these huge ratios over the next two decades. The United States through strong economic growth and the United Kingdom through austerity i.e. the government cut down on its expenditure and hence, borrowed lesser.
In the recent past, Canada brought down its government debt level from 91% of GDP in 1995 to 51% in 2007. This happened because of strong global growth as well as commodity exports. But such examples are rare. The point being that countries more often than not tend to default once their debts reach high levels.
What does not help is the fact that most developed countries are not going to see fast economic growth in the foreseeable future. As the McKinsey report points out: “To generate the growth needed to begin reducing government debt ratios in the most indebted nations today would require real GDP growth rates far higher than are currently projected. In our model, GDP in Spain, France, Portugal, the United Kingdom, and Finland would have to grow by two percentage points more than the current forecasts, reaching real growth rates of 3.6 to 5.5 percent a year. The Japanese economy would have to grow almost three times as fast as the consensus outlook—2.9 percent vs. 1.1 percent.”
So, it doesn’t look like that economic growth will come to the rescue of the total global government debt. How about austerity? In many parts of Europe, economic growth is likely to be negative in the near future. As Mark Blyth writes in 
Austerity—The History of a Dangerous Idea: “As the economy deflates, debts increase as incomes shrink, making it harder to pay off debt the more the economy craters. This, in turn, causes consumption to shrink, which in the aggregate pulls the economy down further and makes the debt to be paid back all the greater.” In this environment if the government cuts down on its expenditure (and in the process its borrowing and absolute debt) it hurts the economy further. The private sector has cut down on its expenditure and if the government does the same, economic growth collapses further.
Taking all these factors into account it can safely be said that—all is not right on the global front. 

(Vivek Kaul is the author of the Easy Money trilogy. He tweets @kaul_vivek) 

The column originally appeared on Firstpost.com on Apr 7, 2015

Rajan doesn’t have much scope to cut repo rate further

ARTS RAJAN
The Reserve Bank of India(RBI) governor Raghuram Rajan presented the first monetary policy for this financial year, yesterday. He kept the repo rate at 7.5%, after having cut it by 25 basis points(one basis point is one hundredth of a percentage) each in January and March, earlier this year. Repo rate is the rate at which RBI lends to banks and acts as a sort of a benchmark to the interest rates that banks pay for their deposits and in turn charge on their loans.
Rajan further said that “going forward, the accommodative stance of monetary policy will be maintained.” This meant that the RBI would continue to bring down the repo rate subject to a few factors.
First, Rajan said that the banks had not passed on the earlier cuts in the repo rate to the end consumers by cutting their base rates or the minimum interest rate a bank charges its customers. Without this happening there is no point in the RBI cutting the repo rate. (In a column earlier this month I had explained why banks are not cutting their base rates.
You can read it here).
Secondly Rajan said that “ developments in sectoral prices, especially those of food, will be monitored, as will the effects of recent weather disturbances and the likely strength of the monsoon.” The northern part of the country has seen unseasonal rains and that has led to rabi cop being damaged. This is expected to push food prices up. Governor Rajan wants to monitor this for a while and see how it pans out, before deciding to cut the repo rate further.
Third, the RBI is watching what the government is doing on the policy front to “ to unclog the supply response so as to make available key inputs such as power and land.” And fourth, the Rajan led RBI is watching “for signs of normalisation of the US monetary policy”. This essentially means that the RBI is closely observing as to when the Federal Reserve of the United States, will start raising interest rates in the United States.
Depending on how these factors play out, the RBI will decide if and when to cut the repo rate further. But the question is how much room does the RBI have to cut the repo rate any further? Rajan has often said in the past that he
wants to maintain a real interest rate level of 1.5-2%. Real interest is essentially the difference between the rate of interest (in this case the repo rate) and the rate of inflation.
The current repo rate at which the RBI lends stands at 7.5%. In the monetary policy statement released yesterday RBI said: “The Reserve Bank will stay focussed on ensuring that the economy disinflates gradually and durably, with CPI inflation targeted at 6 per cent by January 2016.”
If we consider the rate of inflation of 6% and add a real rate of interest of 1.75%(the average of 1.5% and 2%) to it, we get 7.75%. The current repo rate is at 7.5%, which is 25 basis points lower than 7.75%.
What if, we consider the latest rate of inflation as measured by the consumer price index? For the month of February 2015, the inflation stood at 5.4%. If we add 1.75% to it, we get 7.15%, which is lower than the prevailing repo rate of 7.5%. If we add 1.5% to the prevailing rate of inflation, we get 6.9%, which is sixty basis points lower than the prevailing repo rate of 7.5%.
What both these calculations clearly tell us is that there is not much scope for the RBI to cut the repo rate further. At best it can cut the repo rate by another 50 basis points. This is assuming that Rajan maintains his previous stance of maintaining a real interest rate level of 1.5-2%.
As of now there is no evidence to the contrary.
As Rajan had said in September 2014: “Have we artificially kept the real rate of interest somehow below what should be the appropriate natural rate of interest today and created bad investment that is not the most appropriate for the economy?”
This is a very important statement and needs to be dealt with in some detail. Look at the accompanying chart.
The government of India between 2007-2008 and 2013-2014 was able raise money at a much lower rate of interest than the prevailing inflation. The red line which represent the estimated average cost of public debt(i.e. Interest paid on government borrowings) has been below the green line which represents the consumer price inflation, since around 2007-2008.
And if the government could raise money at a rate of interest below the rate of inflation, banks couldn’t have been far behind. Hence, the interest offered on fixed deposits by banks and other forms of fixed income investments was also lower than the rate of inflation, between 2007-2008 and 2013-2014.
This essentially ensured that household financial savings fell from 12% of the GDP in 2009-2010 to 7.2% of the GDP in 2013-2014. As the rate of interest on bank fixed deposits was lower than the rate of inflation, people moved their money into real estate and gold. Household financial savings is essentially the money invested by individuals in fixed deposits, small savings scheme, mutual funds, shares, insurance etc.
If the household financial savings rate has to be rebuilt, the rate of interest on offer to depositors has to be significantly greater than the rate of inflation. Given this, a real rate of interest of 1.5-2% that Rajan has talked about makes immense sense, if household financial savings need to be rebuilt all over again.
And if a real interest rate of 1.5-2% has to be maintained then the RBI doesn’t have much scope to cut the repo rate further—around 50 basis points more.

The column originally appeared on The Daily Reckoning on April 8, 2015