What Arun Jaitley can learn from marketers and real estate agents

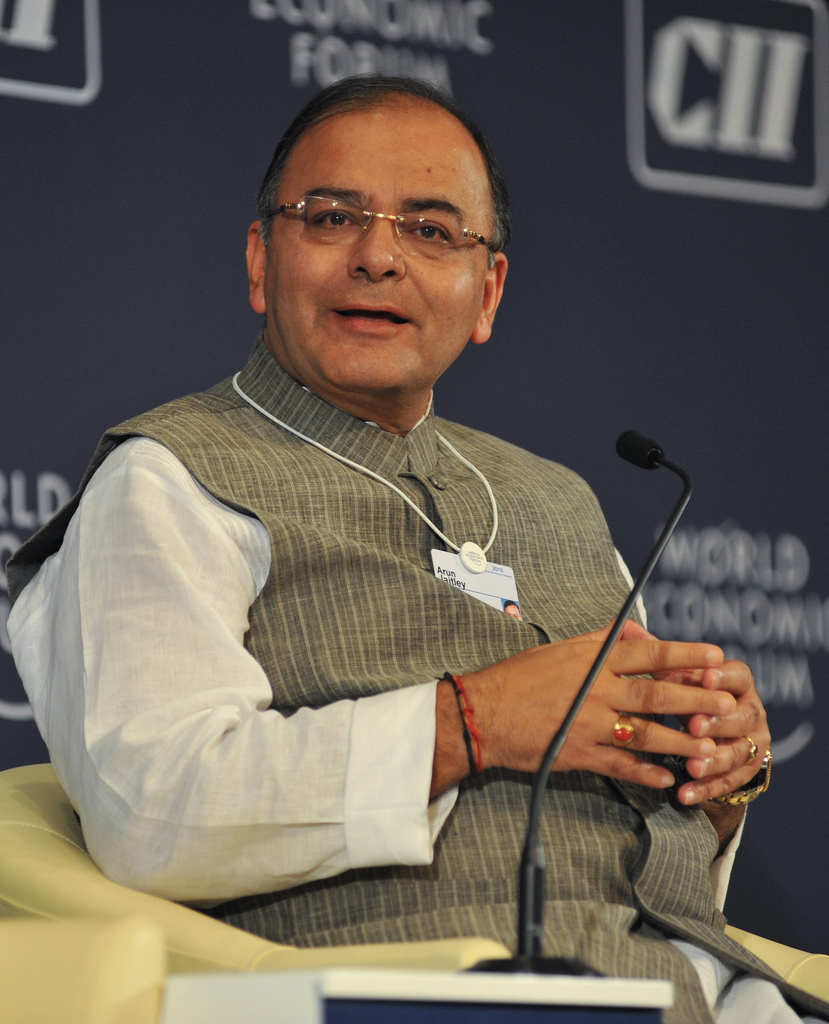
Fostering Public Leadership - World Economic Forum - India Economic Summit 2010Vivek Kaul


I need to confess at the very start that I should have written this column a few days back. But more important things happened and this idea had to take a back seat. Nevertheless, as they say, it’s better late than never.
So, let’s start this column with two examples—one borrowed and one personal. The idea behind both the examples is to illustrate two concepts from behavioural economics—contrast effect and anchoring.
In the book
The Paradox of Choice: Why More is Less, Barry Schwartz discusses an example of a high-end catalog seller, who was selling an automatic bread maker for $279. As he writes “Sometime later, the catalog seller began to offer a large capacity, deluxe version for $429. They didn’t sell too many of these expensive bread makers, but sales of the less expensive one almost doubled! With the expensive bread maker serving as anchor, the $279 machine had become a bargain.”
Essentially, there are two things that are happening here. The buyer first gets “anchored” on to high price of the deluxe version of bread maker which is priced at $429. After this the contrast effect takes over. The bread maker priced at $279 seems cheaper than the deluxe version and people end up buying it.
As John Allen Paulos writes in A Mathematician Plays the Stock Market “Most of us suffer from a common psychological failing. We credit and easily become attached to any number we hear. This tendency is called “anchoring effect.””
And once an individual is anchored on to a number, he then tends to compare it with other numbers that are thrown at him. Marketers exploit this very well. As Schwartz points out “When we see outdoor gas grills on the market for $8,000, it seems quite reasonable to buy one for $1,200. When a wristwatch that is no more accurate than one you can buy for $50 sells for $20,000, it seems reasonable to buy one for $2,000. Even if companies sell almost none of their highest-priced models, they can reap enormous benefits from producing such models because they help induce people to buy cheaper ( but still extremely expensive) ones.”
This was the borrowed example. Now let me discuss the personal example. Sometime in May 2006, I was suddenly asked to leave the apartment that I lived in because the landlord had not been paying the society charges for a very long time. And thus started the search for another apartment to rent. Affordable apartments in Central Mumbai tend to be in buildings that are not in best shape.
Given this, real estate agents use a trick where they try and exploit the contrast effect. The first few apartments that they show are in a really bad shape. After having done this they show an apartment which is slightly better than the ones shown earlier, but the rent is significantly higher.
The attractiveness of the apartment shown later is increased significantly by showing a few “run down” apartments earlier.
The idea behind sharing these two examples was to explain the idea of anchoring and contrast effect. I hope both these concepts are clear by now. Now let me move on to real issue that I want to talk about in this column.
On November 18,
the finance minister Arun Jaitley said in a speechInflation, especially food inflation, has moderated in the last few months and global fuel prices have also come down. Therefore, if RBI, which is a highly professional organisation, in its wisdom decides to bring down the cost of capital, it will give a good fillip to the Indian economy.”
In simple English, Jaitley, as he has often done in the past, was asking the Reserve Bank of India (RBI) to cut the repo rate. Repo rate is the interest rate at which RBI lends to banks. The idea is essentially that at lower interest rates, people will borrow and spend more, and companies will invest and expand. This will lead to faster economic growth. While this sounds good in theory, as I had argued a few days back,
it isn’t as simple it is made out to be.
One argument offered by those asking the RBI to cut interest rates is that inflation as measured by the consumer price index has fallen to 5.52% in October 2014. It was at 6.46 % in September 2014 and 10.17% in October 2013.
Nevertheless, is inflation really low? Or are Jaitley and others like him who have been demanding an interest rate cut just becoming victims of anchoring and the contrast effect?
The inflation figure of greater than 10% which had been prevalent over the last few years is anchored into their minds. And in comparison to that an inflation of 5.52% does sound low. Hence, the contrast effect is at work here.
Further, it is worth remembering that this so called low inflation has been prevalent only for a few months. Chances are that food prices might start rising again. The government has forecast that the output of 
kharif crops will be much lower than last year and this might start pushing food prices upwards all over again. Also, recent data showsthat vegetable and cereal prices have started rising again because of the delayed monsoon.
Central banks of developed countries typically tend to have an inflation target of 2%. In the recent past they have been unable to meet even that number. Large parts of the world might now be heading towards deflationary scenario, where prices will fall.
In October, the consumer price inflation in China stood
at 1.6%, well below the targeted 3.5%. Also, in January earlier this year the Report of the Expert Committee to Revise and Strengthen the Monetary Policy Framework set up by RBI had recommended that the Indian central bank should set an inflation target of 4%, with a band of +/- 2 per cent around it .
The committee had said “transition path to the target zone should be graduated to bringing down inflation from the current level of 10 per cent to 8 per cent over a period not exceeding the next 12 months and 6 per cent over a period not exceeding the next 24 month period before formally adopting the recommended target of 4 per cent inflation with a band of +/- 2 per cent.”
Once, these factors are taken into account, the latest inflation number of 5.52% as measured by the consumer price index, isn’t really low, even though it seems to be low in comparison to the very high inflation that had prevailed earlier. But as explained this is more because of anchoring and the contrast effect at work.
Also, as I had written earlier, more than anything people still haven’t come around to the idea of low inflation, given that inflationary expectations(or the expectations that consumers have of what future inflation is likely to be) continue to remain on the high side.
As per the
Reserve Bank of India’s Inflation Expectations Survey of Households: September – 2014, the inflationary expectations over the next three months and one year are at 14.6 percent and 16 percent. In March 2014, the numbers were at 12.9 percent and 15.3 percent. Hence, inflationary expectations have risen since the beginning of this financial year.
If inflationary expectations are to come down, then low inflation needs to be prevail for some time. Just a few months of low inflation is not enough. As RBI governor
Raghuram Rajan had said in a speech in February this year “ the best way for the central bank to generate growth in the long run is for it to bring down inflation…Put differently, in order to generate sustainable growth, we have to fight inflation first.”
Rajan is trying to do just that, and it’s best that Jaitley allows him to do that, instead of demanding a cut in interest rates every now and then.

The article appeared originally on www.equitymaster.com on Nov 21, 2014
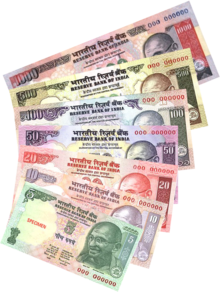
With Kisan Vikas Patra 2.0 now invest your black money with the government

indian rupeesIf you can’t beat them, join them,” goes the old adage.
The government of India has done just that by relaunching the Kisan Vikas Patra (KVP). An investment in the newly launched KVP will double in 100 months. This means a return of 8.7% per year. It also comes with a lock-in of two and a half years.
There are no tax benefits, neither at the time of investment nor when the investment matures. Initially, the KVPs will be sold through post offices. But over a period of time the government plans to sell KVPs through some designated branches of public sector banks as well.
“The basic aim is to provide an investment opportunity to people who do not know where to invest and put their money into options like Ponzi schemes,”
the finance minister Arun Jaitley said at the relaunch of the scheme.
A ponzi scheme is a fraudulent investment scheme in which money is repaid to old investors by using money being brought in by new investors. The scheme runs as long as the money being redeemed by the old investors is lower than the money being brought in by the new investors. The moment this reverses, the scheme collapses.
In the recent past, the country has seen a whole host of Ponzi schemes like Sahara, Saradha, Rose Valley etc. But how will the KVP stop people from investing in Ponzi schemes?
A major reason why people invested in Ponzi schemes over the last few years lies in the fact that real returns (i.e. nominal return minus the rate of inflation) on fixed income investments (like fixed deposits, post office savings schemes etc.) was negative over the last few years.
Between 2008 and 2013, both consumer price inflation and food inflation were greater than 10%, for large periods of time. In this scenario, the returns on offer on fixed income investments were lower than the rate of inflation.
Given this, individuals had to look at other modes of investment, in order to protect the purchasing power of their accumulated wealth. A lot of this money found its way into real estate and gold, which delivered good returns for most of that period. And some of it also found its way into Ponzi schemes, which promised a slightly higher rate of return than fixed deposits and other fixed income investments.
Inflation has fallen over the last few months, and after many years, the real return on fixed income investments is in the positive territory. This is, as true for KVPs, as it is for fixed deposits offered by public sector banks.
Take the case of a fixed deposit of less than Rs 1 crore with a tenure of one year to less than five years, offered by the State Bank of India. Such a deposit pays an interest of 8.75% per year, which is as good as the return of 8.7% per year offered by KVPs.
Further, the fixed deposit doesn’t come with a lock-in, unlike KVPs which have a lock-in of two and a half years. Also, those who have dealt with post offices on a regular basis will know that dealing with (even) public sector banks is relatively easier than dealing with a post office.
So, there is no basic case for investing in a KVP. Also, for those investing for the long term, instruments like PPF which are not taxed on maturity, remain a considerably better bet. Those comfortable with investing in debt mutual funds are also likely to get higher after tax returns in the long term, once indexation(or inflation in simple terms) is taken into account while calculating capital gains.
And as far as not investing in Ponzi schemes is concerned, the returns offered on KVP are not high enough to stop people from investing in Ponzi schemes.
The government also wants to increase savings by getting people to invest in this scheme. As Jaitley said at the launch “Over the last two three years, when economic growth slowed, our savings rate declined…So it is very necessary to encourage people to increase domestic savings.”
The latest RBI annual report points out that “the household financial saving rate remained low during 2013-14, increasing only marginally to 7.2 per cent of GDP in 2013-14 from 7.1 per cent of GDP in 2012-13 and 7.0 per cent of GDP in 2011-12…the household financial saving rate [has] dipped sharply from 12 per cent in 2009-10.”
Household financial savings is essentially the money invested by individuals in fixed deposits, small savings scheme, mutual funds, shares, insurance etc. It has come down from 12% of the GDP in 2009-10 to 7.2% in 2013-14. A major reason for the fall has been the high inflation that has prevailed since 2008. The return on offer on KVPs is similar to other forms of fixed-income investments available in the market and there is no reason that it should lead to higher financial savings.
So that brings us to the question, why did the government launch KVPs then? Before we understand that, here are a few more features of the scheme. The KVPs as mentioned earlier come with a lock-in of two and a half years. They come in denominations of Rs 1000,Rs 5,000, Rs 10,000 and Rs 50,000 and there is no upper limit to the number of KVP certificates that can be bought. Hence, there is no limit to the amount of money that can be invested in the scheme.
As far as fulfilling know your customer requirements are concerned,
the gazette notifications states that the individual buying the KYC will have to provide proof of name and residence. No PAN card details will have to be provided.
And here comes the clincher—
the KVP will be a bearer instrument, which will not carry the name of the investor. Jaitley stated this at the event to relaunch the KVP. “So people with currency can invest in this,” Jaitley said. “This will be a bearer instrument just like currency and easy to encash,” he added.
So what does this really mean? There are some basic know your customer norms that need to be followed. But the KVP certificate will not carry any name on it, and that essentially makes it an anonymous instrument, once it has been issued.
With this move, the government is hoping that the KVPs will be used to launder black money. In fact, this was precisely the reason the scheme was discontinued in November 2011,
a recent report in the Business Standard points out.
Black money over the years has gone into gold and real estate, where it isn’t productive enough. If it finds its way into the coffers of the government, it can be used more productively, or so the government would like to believe.
It would also lead to higher financial savings and in the process lower interest rates. The government will benefit because it will be able to finance the fiscal deficit at lower interest rates. Fiscal deficit is the difference between what a government earns and what it spends and is financed through borrowing.
The fact that the relaunched KVP is a bearer instrument, without the name of the investor and without any need to provide an identity proof, makes it ideal to invest black money in.
As R Jagannathan writes on Firstpost.com “Since it is a bearer certificate without limit, KVPs are likely to be more popular with the better off than just the poor…Rs 1 crore invested in KVPs of the face value of Rs 50,000 each will involve the creation of only 200 certificates. Not a very big pile and very portable for black money holders.” In fact, given the fact that it is a bearer instrument, KVPs can almost be used as a currency as well.
In the old days when the government wanted to access the black money in the country, it used to launch income tax amnesty schemes, where individuals could pay a one time tax on their accumulated black money and escape punishment. In its current form, the KVP looks more like a quasi-amnesty scheme. In fact, it is even better given that no tax needs to be paid on it.
It would have been a good idea to demand the PAN number from those investors who buy KVPs of Rs 1 lakh or more.
Nevertheless, the question is, should a government which has strong views on “black money” actually be launching a scheme, which makes it convenient for people to invest black money and that too with the government?

The article originally appeared on www.equitymaster.com on Nov 20, 2014

Yen carry trade from Japan will drive the Sensex higher

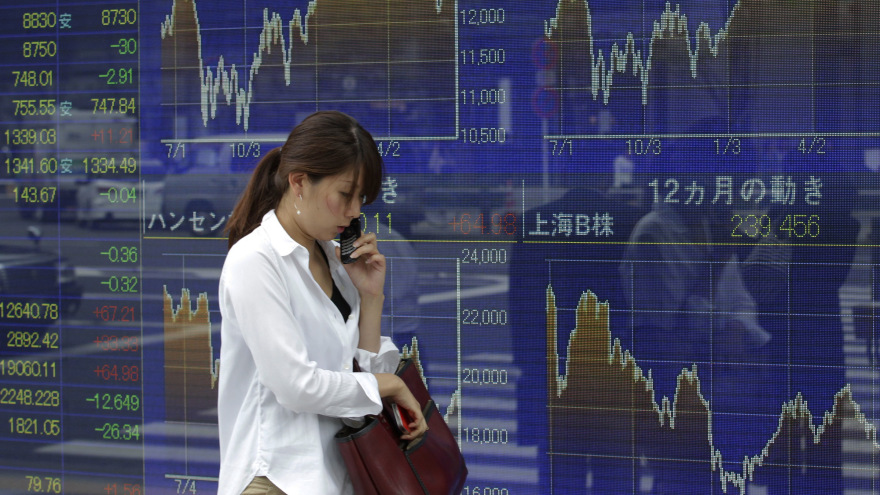
Japan World Markets

Vivek Kaul 

John Brooks in his brilliant book Business Adventures writes “The road to Hell is paved with good intentions!” One country on which this sentence applies the most is Japan. The country has been trying to come out of a bad economic scenario for two decades and it only keeps getting worse for them, despite the effort of its politicians and its central bank.
In the previous column, I wrote about how the prevailing economic scenario in Japan will ensure that they will continue with the “easy money” policy in the days to come, by printing money and maintaining low interest rates in the process.
But it looks like the situation just got worse for them. The Japanese economy contracted at an annual rate of 1.6% during the period July-September 2014. This after having contracted at an annual rate of 7.1% in April-June 2014. Two consecutive quarters of economic contraction constitute a recession.
Shinzo Abe was elected the prime minister of Japan in December 2012. His immediate priority was to create some inflation in Japan in order to get consumer spending going again. The Bank of Japan cooperated with Abe on this, and decided to print as much money as would be required to get inflation to 2%. This policy came to be referred as “Abenomics”.
In April 2013, the Bank of Japan decided to print $1.4 trillion and use it to buy bonds, and hence, pump that money into the financial system. The size of the Japanese economy is around $5 trillion. Hence, as a proportion of the size of Japan’s economy, this money printing effort was twice the size of the Federal Reserve’s third round of money printing, more commonly referred to as the third round of quantitative easing or QE-III.
Sometime in April this year, the Abe government decided to increase the sales tax from 5% to 8%. The idea again was to raise prices, by introducing a tax, and get people to start spending again. Nevertheless, this backfired big time and the economy has now contracted for two consecutive quarters.
Elaine Kurtenbach writing for the Huffington Post points out Housing investment plunged 24 percent from the same quarter a year ago, while corporate capital investment sank 0.9 percent. Consumer spending, which accounts for about two-thirds of the economy, edged up just 0.4 percent.”
Towards the end of October 2014, the Bank of Japan decided to print $800 billion more because the inflation wasn’t rising as the central bank expected it to. Now with the economy contracting again, there will be calls for more money printing and economic stimulus. In fact, after GDP contraction number came out,
Etsuro Honda, an architect of Abenomics, told the Wall Street Journal that it was “absolutely necessary to take countermeasures.”
While the “easy money” policy run by the Japanese government and the central bank hasn’t managed to create much inflation, it has led to the depreciation of the yen against the dollar and other currencies.
In early November 2012, before Shinzo Abe took over as the prime minister of Japan, one dollar was worth 79.4 yen. Since then, the yen has constantly fallen against the dollar and as I write this on the evening of November 18, it is worth around 117 to a dollar.
Interestingly, some inflation that has been created is primarily because of yen losing value against the dollar. This has made imports expensive. The consumer price inflation(excluding fresh foods) for the month of September 2014 came in at 3%.
Once adjusted for the sales tax increase in April, this number fell to a six month low of 1%, still much below the Bank of Japan’s targeted 2% inflation.
Analysts believe that the yen will keep losing value against the dollar in the time to come. John Mauldin wrote in a recent column titled
The Last Argument of Central Bankers The yen is already down 40% in buying power against a number of currencies, and another 40-50% reduction in buying power in the coming years is likely, in my opinion.”
Albert Edwards of Societe Generale is a little more direct than Mauldin and wrote in a recent research report titled
Forecast timidity prevents anyone forecasting ¥145/$ by end March – so I will “The yen is set to…[crash] through multi-decade resistance – around ¥120. It seems entirely plausible to me that once we break ¥120, we could see a very quick ¥25 move to ¥145 [by March 2015].”
Edwards further writes that he expects “
the key ¥120/$ support level to be broken soon and the lows of June 2007 (¥124) and Feb 2002 (¥135) to be rapidly taken out.” The note was written before the information that the Japanese economy had contracted during July-September 2014, came in.
This makes the Japanese yen a perfect currency for a “carry trade”. It can be borrowed at a very low rate of interest and is depreciating against the dollar. Before we go any further, it is important that we go back to the Japan of early 1990s.
The Bank of Japan had managed to burst bubbles in the Japanese stock and real estate market, by raising interest rates. This brought the economic growth to a standstill.
After bursting the bubbles by raising interest rates, the Bank of Japan had to start cutting interest rates and soon the rates were close to 0 percent. This meant that anyone looking to save money by investing in fixed-income investments (i.e., bonds or bank deposits) in Japan would have made next to nothing.
This led to the Japanese looking for returns outside Japan. Some housewife traders started staying up at night to trade in the European and the North American financial markets. They borrowed money in yen at very low interest rates, converted it into foreign currencies and invested in bonds and other fixed-income instruments giving higher rates of returns than what was available in Japan.
Over a period of time, these housewives came to be known as Mrs Watanabes and, at their peak, accounted for around 30 percent of the foreign exchange market in Tokyo, writes Satyajit Das in
Extreme Money.
The trading strategy of the Mrs Watanabes came to be known as the yen-carry trade and was soon being adopted by some of the biggest financial institutions in the world. A lot of the money that came into the United States during the dot-com bubble came through the yen-carry trade.
It was called the carry trade because investors made the carry, that is, the difference between the returns they made on their investment (in bonds, or even in stocks, for that matter) and the interest they paid on their borrowings in yen.
The strategy worked as long as the yen did not appreciate against other currencies, primarily the US dollar. Let’s try and understand this in some detail. In January 1995, one dollar was worth around 100 yen. At this point of time one Mrs Watanabe decided to invest one million yen in a dollar-denominated asset paying a fixed interest rate of 5 percent per year.
She borrowed this money in yen at the rate of 1 percent per year. The first thing she needed to do was to convert her yen into dollars. At $1 = 100 yen, she got $10,000 for her million yen, assuming for the ease of calculating that there was no costs of conversion.
This was invested at an interest rate of 5%. At the end of one year, in January 1996, $10,000 had grown to $10,500. Mrs Watanabe decided to convert this money back into yen. At that point, one dollar was worth 106 yen.
She got around 1.11 million yen ($10,500
× 106) or a return of 11 percent. She also needed to pay the interest of 1 percent on the borrowed money. Hence, her overall return was 10 percent. Her 5 percent return in dollar terms had been converted into a 10 percent return in yen terms because the yen had lost value against the dollar.
But let’s say that instead of depreciating against the dollar, as the yen actually did, it instead appreciated. Let’s further assume that in January 1996 one dollar was worth 95.5 yen. At this rate, the $10,500 that Mrs Watanabe got at the end of the year would have been worth 1 million yen ($10,500 × 95.5) when converted back into yen.
Hence, Mrs Watanabe would have ended up with the same amount that she had started with. This would have meant an overall loss, given that she had to pay an interest of 1 percent on the money she had borrowed in yen.
The point is that the return on the carry trade starts to go down when the currency in which the money has been borrowed, starts to appreciate. Since its beginnings in the mid-1990s, the yen carry trade worked in most years up to mid-2007. In June 2007, one dollar was worth 122.6 yen on an average. After this, the value of the yen against the dollar started to go up over the next few years.
With the yen expected to depreciate further against the dollar, it will lead to big institutional investors increasing their yen carry trades in the days to come. This will mean money will be borrowed in yen, and invested in financial markets all over the world.
Some of this money will find its way into the stock and the bond market in India. Moral of the story:
The easy money rally is set to continue. The only question is till when?
Stay tuned!

The article originally appeared on www.equitymaster.com on Nov 19, 2014

Why SBI’s $1 billion loan to Adani doesn’t make sense

SBI-logo.svg

Vivek Kaul

The State Bank of India(SBI) has decided to lend up to $1 billion to Adani Mining, the Australian subsidiary of Adani Enterprises for the Carmichael mine in Queensland, Australia. The mine has massive blocks of untapped coal reserves. The company aims to build the project by end of 2017.
“The MOU with SBI is a significant milestone in the development of our Carmichael mine,” Adani said in a statement released yesterday.
The loan as and when it is extended would be one of the largest given out by an Indian bank for a foreign project. The question is should SBI be giving out a loan of up to $1 billion to a company which already has a huge amount of debt.
Let’s take a look at how the numbers look. As on September 30, 2014, the long term debt of the company stood at Rs 55,364.94 crore. The short term debt stood at Rs 17,267.43 crore. Hence, the total debt of the company stood at Rs 72,632.37 crore.
As on March 31, 2014, the total debt of the company stood at Rs 64,979.04 crore. Hence, the total debt of the company has shot up by Rs 7653.33 crore in a matter of six months.
The question we are trying to answer here is how good is the ability of the company to service all the debt that it has managed to accumulate. For that we use results of the last four quarters and calculate the interest coverage ratio. Interest coverage ratio is essentially the earnings before interest, taxes and exceptional items (or what is often termed as operating profit) of a company divided by its interest expense. It tells us whether the company is making enough money to pay the interest on its outstanding debt.
The total operating profit of the company over the last four quarters comes at Rs 8999.92 crore. The interest that the company has paid on its debt in the last four quarters amounts to Rs 5,733.77 crore. This means an interest coverage ratio of around 1.57.
As www.investopedia.com points out “The lower the ratio, the more the company is burdened by debt expense. When a company’s interest coverage ratio is 1.5 or lower, its ability to meet interest expenses may be questionable.”
While Adani Enterprises’ interest coverage ratio is not lower than 1.5 it is clearly getting there. In fact, things get even more interesting once we start calculating the interest coverage ratio on the basis of quarterly data. The interesting coverage ratio for the period of three months ending March 31, 2014, stood at 2.67. It stood at 1.58, for the period of three months ending June 30, 2014. And for the period of three months ending September 30, 2014, it stood at 1.12.
As we can see, the ability of the company to keep paying the interest that it needs to pay on its debt has come down dramatically during the course of this financial year. As www.investopedia.com points out “An interest coverage ratio below 1 indicates the company is not generating sufficient revenues to satisfy interest expenses.” Adani Enterprises is clearly moving towards this situation. Further, in a May 2014 report, Bank of America Merrill Lynch had estimated that the company would have an interest coverage ratio of 1.2 during the course of this financial year.
What all this clearly tells us is that Adani Enterprises is in an over-leveraged situation and is getting to a situation where it will find it difficult to keep paying the interest on its debt. The thing with debt is that it can work both ways. When a company takes on a higher amount of debt it gives itself an opportunity to generate higher earnings vis a vis a situation where it hadn’t taken on that debt at all.
If this happens, then these increased earnings are spread among the same number of shareholders. But at the same time the company runs the risk of getting into a situation where the projected earnings simply don’t come along and it finds it difficult to keep paying the interest on all the debt that it has taken on.
Adani Enterprises runs the risk of getting precisely into this situation. Further as a Reuters news-report points out “Much bigger coal rivals, like BHP Billiton and Glencore, have also shelved coal developments in Queensland at a time when a third of Australia’s coal output is making losses.” Also, coal prices have fallen over the last few years. As a recent report in The Hindu points out “Globally, coal prices have been on a downtrend in the last three years and are at the lowest levels since 2009. Prices of steam coal, a slightly lower grade that is used in power generation, have halved since 2011 to $62 per tonne now.”
This fall in prices has happened because of the supply not shrinking along with demand. “For instance, demand from China — the largest consumer of coal accounting for half of the total global demand — has been slow. After growing at over 10 per cent annually during 2001-2011, the country’s demand has fallen — imports were down to 150 million tonnes (mt) in 2013, from 182 mt in 2011. And given the pollution-related issues, it is expected that the country may look at cleaner sources more actively, holding down demand. Goldman Sachs estimates that imports will fall to 75 mt by 2018,” The Hindu points out.
Goldman Sachs expects the demand growth to be 15 million tonnes per year during 2013-2018, against 60 million tonnes per year it was at during 2008-2012. The supply of coal isn’t likely to come down. In case of Australia the miners have entered into long term “take or pay” contracts which requires them to pay $20 per tonne of transport costs, irrespective of the fact whether or not they ship coal. Hence, Australian miners are likely to continue to ship coal.
What this tells us is that coal is not the best business to be in right now. Despite these reasons SBI has gone ahead and given a loan of up to $1 billion to Adani Enterprises. This is not a logical decision which takes into account the facts as they prevail. The only possible explanation for this decision is the “so called” closeness of Gautam Adani, chairman of Adani Enterprises to Narendra Modi, the prime minister of India.

The article originally appeared on www.FirstBiz.com on Nov 18, 2014

(Vivek Kaul is the author of the Easy Money trilogy. He tweets @kaul_vivek)

Bill Gates’ favourite business book tells us why Tata Nano “really” failed

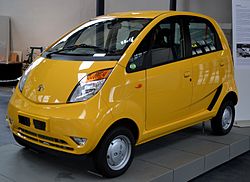
TATA NANOVivek Kaul

In July this year Bill Gates wrote a blog. He titled it The Best Business Book I’ve Ever Read. As he wrote “Not long after I first met Warren Buffett back in 1991, I asked him to recommend his favorite book about business. He didn’t miss a beat: “It’s Business Adventures, by John Brooks,” he said. “I’ll send you my copy.” I was intrigued: I had never heard of Business Adventures or John Brooks.” Gates got a copy of the book from Buffett. “Today, more than two decades after Warren lent it to me—and more than four decades after it was first published—Business Adventures remains the best business book I’ve ever read. John Brooks is still my favorite business writer. (And Warren, if you’re reading this, I still have your copy),” Gates added. The book is essentially a collection of 12 long articles (I don’t know what else to call them) that Brooks wrote for the New Yorker magazine, where he used to work. A chapter that should be of interest to Indian readers is The Fate of Edsel. A reading of this chapter clearly tells us why Tata Nano, the most hyped Indian car ever, has failed to live up to its hype. But before we get to that, here is a brief summary of the chapter. In 1955, the Ford Motor Company decided to produce a new car, which would be priced in the medium range of $2,400 to $4,000. The car was designed more or less as was the fashion of the day. It was long, wide, lavishly decorated with chrome, had a lot of gadgets and was equipped with engines which could really rustle up some serious power. The car was called the Edsel. It was named after Edsel Ford, the only son of Henry Ford who started the Ford Motor Company. In 1943, Edsel Ford had died at a young age of 49, of stomach cancer. In fact, even before the Edsel car was launched there was a lot of hype around it. As Brooks writes “In September 1957, the Ford Company put its new car, the Edsel, on the market, to the accompaniment of more fanfare than had attended the arrival of any other new car since the same company’s Model A. A model brought out thirty years earlier.” The company had already spent $250 million on the car, before it was launched. The Business Week called it more costly than any other consumer product in history. Given this huge cost, Ford had to sell around 200,000 Edsels in the first year, if it had to get its investment back. Nevertheless, two years, two months and fifteen days later, it had only sold 109,446 Edsels. This included cars bought by Ford executives, dealers, salesman, workers etc. The number amounted to less than 1% of the cars sold in America during that period. On November 19, 1959, it pulled the plug on the car. Estimates suggested that Ford lost around $350 million on the car. So what went wrong? Some of the feedback from trade publications was negative. Over and above that, some of the cars that were sent out initially were badly made. As Brooks writes “Automotive News reported that in general the earliest Edsels suffered from poor paint, inferior sheet metal, and faulty accessories, and quoted the lament of a dealer about one of the first Edsel convertibles he received: “The top was badly set, doors cockeyed, springs sagged.”” Some individuals who worked on making and launching the car liked to believe in later that it was the because of the Sputnik, the first artificial space satellite launched by the Soviets that led to the car not selling. As Brooks puts it “October 4th[1957], the day the first Soviet Sputnik went into orbit, shattering the myth of American technical pre-eminence and precipitating a public revulsion against Detroit’s fancier baubles.” Detroit was the city were the biggest motor companies in the United States were head-quartered back then. While these could have been reasons for the car not selling, the real reason for the car not selling was the hype that accompanied it. As Brooks writes “It was agreed that the safest way to tread the tightrope between overplaying and underplaying the Edsel would be to say nothing about the car as a whole but to reveal its individual charms a little at a time—a sort of automotive strip tease…The Ford Company had built up an overwhelming head of public interest in the Edsel, causing its arrival to be anticipated and the car itself to be gawked at with more eagerness than had ever greeted any automobile before it.” C Gayle Warnock, director of public relations of the Edsel division of Ford, shares an interesting example, which provides the real reason behind the failure of the Edsel car. In 1956, a senior official working on the Edsel launch (in fact it wasn’t called the Edsel then, it was just the E-Car) gave a talk about it in Portland, Oregon. Warnock was aiming for some coverage regarding the event in the local press. But what he got was something he had not expected. The story got picked up by wire services and was splashed all across the country. As Warnock recounts in the chapter “Clippings [of the media coverage] came in by the bushel. Right then I realized the trouble we might be headed for. The public was getting to be hysterical to see our car, figuring it was going to be some kind of dream car—like nothing they’d ever seen. I said… “When they find out it’s got four wheels and one engine, just like the next car, they’re liable to be disappointed.”” And this is precisely the reason why the Edsel flopped. The hype was so much that the public expected something that was totally out of the world. But what Ford was basically giving them in the rephrased words of Larry Doyle, the head of sales at the Edsel division, “exactly the car that they had been buying for several years.” As Doyle put it “We gave it to them and they couldn’t take it.” Further, it did not help that the first lot of cars was not properly manufactured. “Within a few weeks after the Edsel was introduced, its pitfalls were the talk of the land,” writes Brooks. Now replace the word Edsel with Nano and the situation stays more or less the same. The hype around the car was huge. When the car was launched in 2009, the entire world media was in Delhi for the launch. In fact, before the car was launched the rating agency Crisil said that the car could expand the Indian car market by 65%. People who had cars were already worried about the traffic on the roads getting worse than it already was, because of the Nano. Before the car was launched in 2009, prices in the used car market fell by 25-30%, given Nano’s expected price point of Rs 1 lakh. Nonetheless, Nano could not live up to the hype. In a May 2014 newsreport, the Business Standard pointed out that Launched in 2009,Nano sales between 2010-11 and 2012-13 constituted 23-24 per cent of Tata Motors’ total sales. But Nano sales declined dramatically after peaking to 74,527 in 2011-12. The numbers came down by more than 70 per cent in two years to 21,129 in 2013-14. Tata Motors has set up a facility at Sanand in Gujarat to make 250,000 Nanos a year.” So, the car sold nowhere near the numbers it was expected to. What did not help was that when the car actually started hitting the market in 2010, some units caught fire. After all the hoopla around the Nano, this wasn’t what the public was ready to accept. Brooks’ sentence written for Edsel can be re-written for Nano as well: “After the Nano was introduced, its pitfalls were the talk of the land.” Further, the hype around the car was so huge that the people were expecting something totally out of this world. They did not know what they wanted, but they did not want, what they got. The question that remains is how much could you expect out of a car which was supposed to be sold at Rs 1 lakh? The article originally appeared on www.FirstBiz.com on Nov 18, 2014

(Vivek Kaul is the author of the Easy Money trilogy. He tweets @kaul_vivek)